-
义乌市地处浙江省中部,有多个中小型水库和河流,主要代表为岩口水库和义乌江。岩口水库位于义乌市上溪镇岩口村(119°54′11″~119°55′13″ E,29°17′25″~29°18′49″ N),是义乌市最大的饮用水水库,总库容为3 590万m3,平均水深26.4 m,集供水、灌溉、防洪和发电为一体的中型丘陵水库。饮用水源地的水库富营养化和藻华暴发已成为当前生态环境的重要威胁[1],岩口水库也不例外。原居林等[2]评价岩口水库底泥肥力处于较高水平,且随着时间的推移,上游营养盐持续汇入水库,导致水体和底泥污染加剧,极易诱发藻华暴发。义乌江系东阳江下游的一段,位于义乌市境内,是义乌市最主要的河流,共有17条支流,其中航慈溪于后矮村流入岩口水库,合乔里何溪、溪华溪、斯何溪出水库往南,于月潭东入义乌江。义乌江全长39.75 km,有多个排污口,是污水厂出水的受纳水体。因此,义乌江的营养盐含量易受排污口排水的影响,水质基本处于Ⅴ类水和劣Ⅴ类水水平[3]。
2020年夏季岩口水库藻华暴发,导致水库周围的生态环境进一步恶化,干扰水产养殖的正常运行,一定程度上阻碍了周边旅游业的发展[4]。部分蓝藻(如微囊藻、颤藻等)会释放藻毒素,长期暴露于有毒藻华的空气中会对附近居民的身体健康构成潜在威胁[5]。本研究主要以义乌市典型水体——岩口水库水体和义乌江的富营养化现状为例,分析水体藻华暴发的原因;并将现有监测手段与该地区的水体藻华问题结合,确定可以采用的监测手段;最后,对未来义乌市水体富营养化监测技术的合理布局提出建议。
-
随着义乌市小商品经济的快速发展,较为密集的人类活动严重污染了当地水环境,加剧了水体富营养化程度。在典型的富营养化水体中,岩口水库水体属于中度富营养化,易在夏季暴发藻华;而义乌江属于贫营养化,较少出现藻华[6]。本研究按表1布点进行了采样并测定了Chl-a浓度,结果表明,岩口水库上游4条溪流(溪华溪、黄山溪、斯何溪和金傅宅溪)大部分时间处于中营养状态,而水库内部的营养状态较低。在每年5~9月,岩口水库都将暴发不同程度的藻华。其中,上游4条入库溪流中斯何溪和黄山溪的藻华最为严重。美国环境保护局(US EPA)采用叶绿素a(Chl-a) 作为水体营养化等级标准:ρ(Chl-a)> 10 mg/m3,富营养化;4 mg/m3 <ρ(Chl-a)< 10 mg/m3,中营养化;ρ(Chl-a)< 4 mg/m3,贫营养化。因此,夏季岩口水库多为富营养化状态,极易暴发藻华。
-
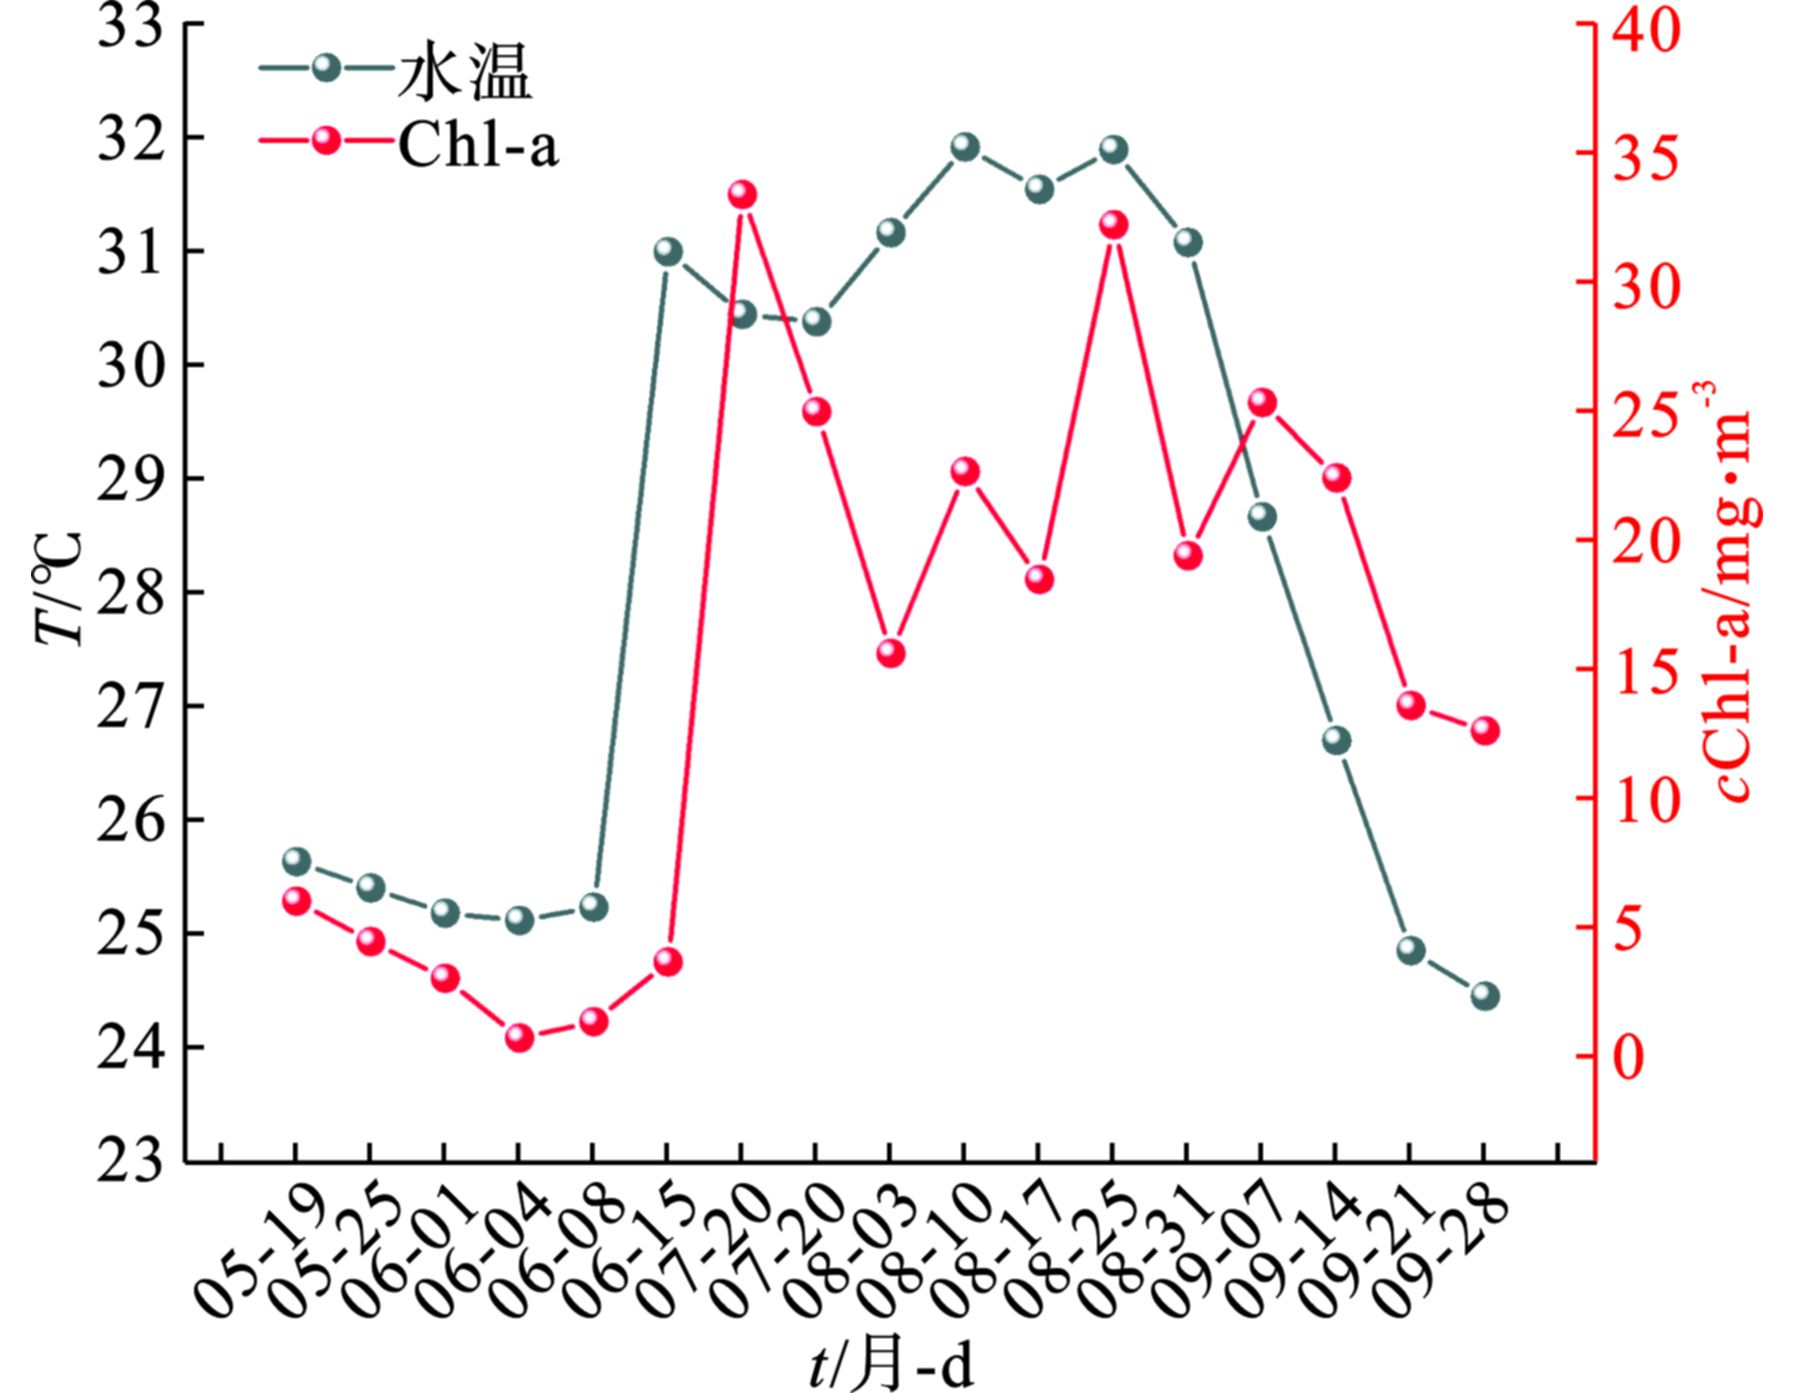
在2020年5~9月调研期间,岩口水库光照充足、热分层现象明显,底层水温低至13.1~25.1 ℃,而表层水温在24.05~31.87 ℃之间,正是藻类生长繁殖的最适温度。2020年岩口水库水温和Chl-a变化情况,见图1。
图1可知,随着水温的升高,衡量浮游植物生物量的Chl-a浓度也在升高;在8月期间,水温达到31 ℃以上,Chl a浓度随着水温的升高也在逐渐增大,随后岩口水库达到富营养化水平(ρ(Chl a)> 10 mg/m3),藻华暴发的风险极高。一般而言,温度会通过影响细胞内酶的活性来影响藻类的光合作用和生长代谢活动[7],因而湖面水温与藻华暴发息息相关,水温升高会导致藻类生长活性增强,本次调研结果也证实了这点。并且义乌市属于亚热带季风气候,加之全球变暖的趋势愈演愈烈,因此,一般夏季水体藻华问题较为严重,控制难度有所增加。
-
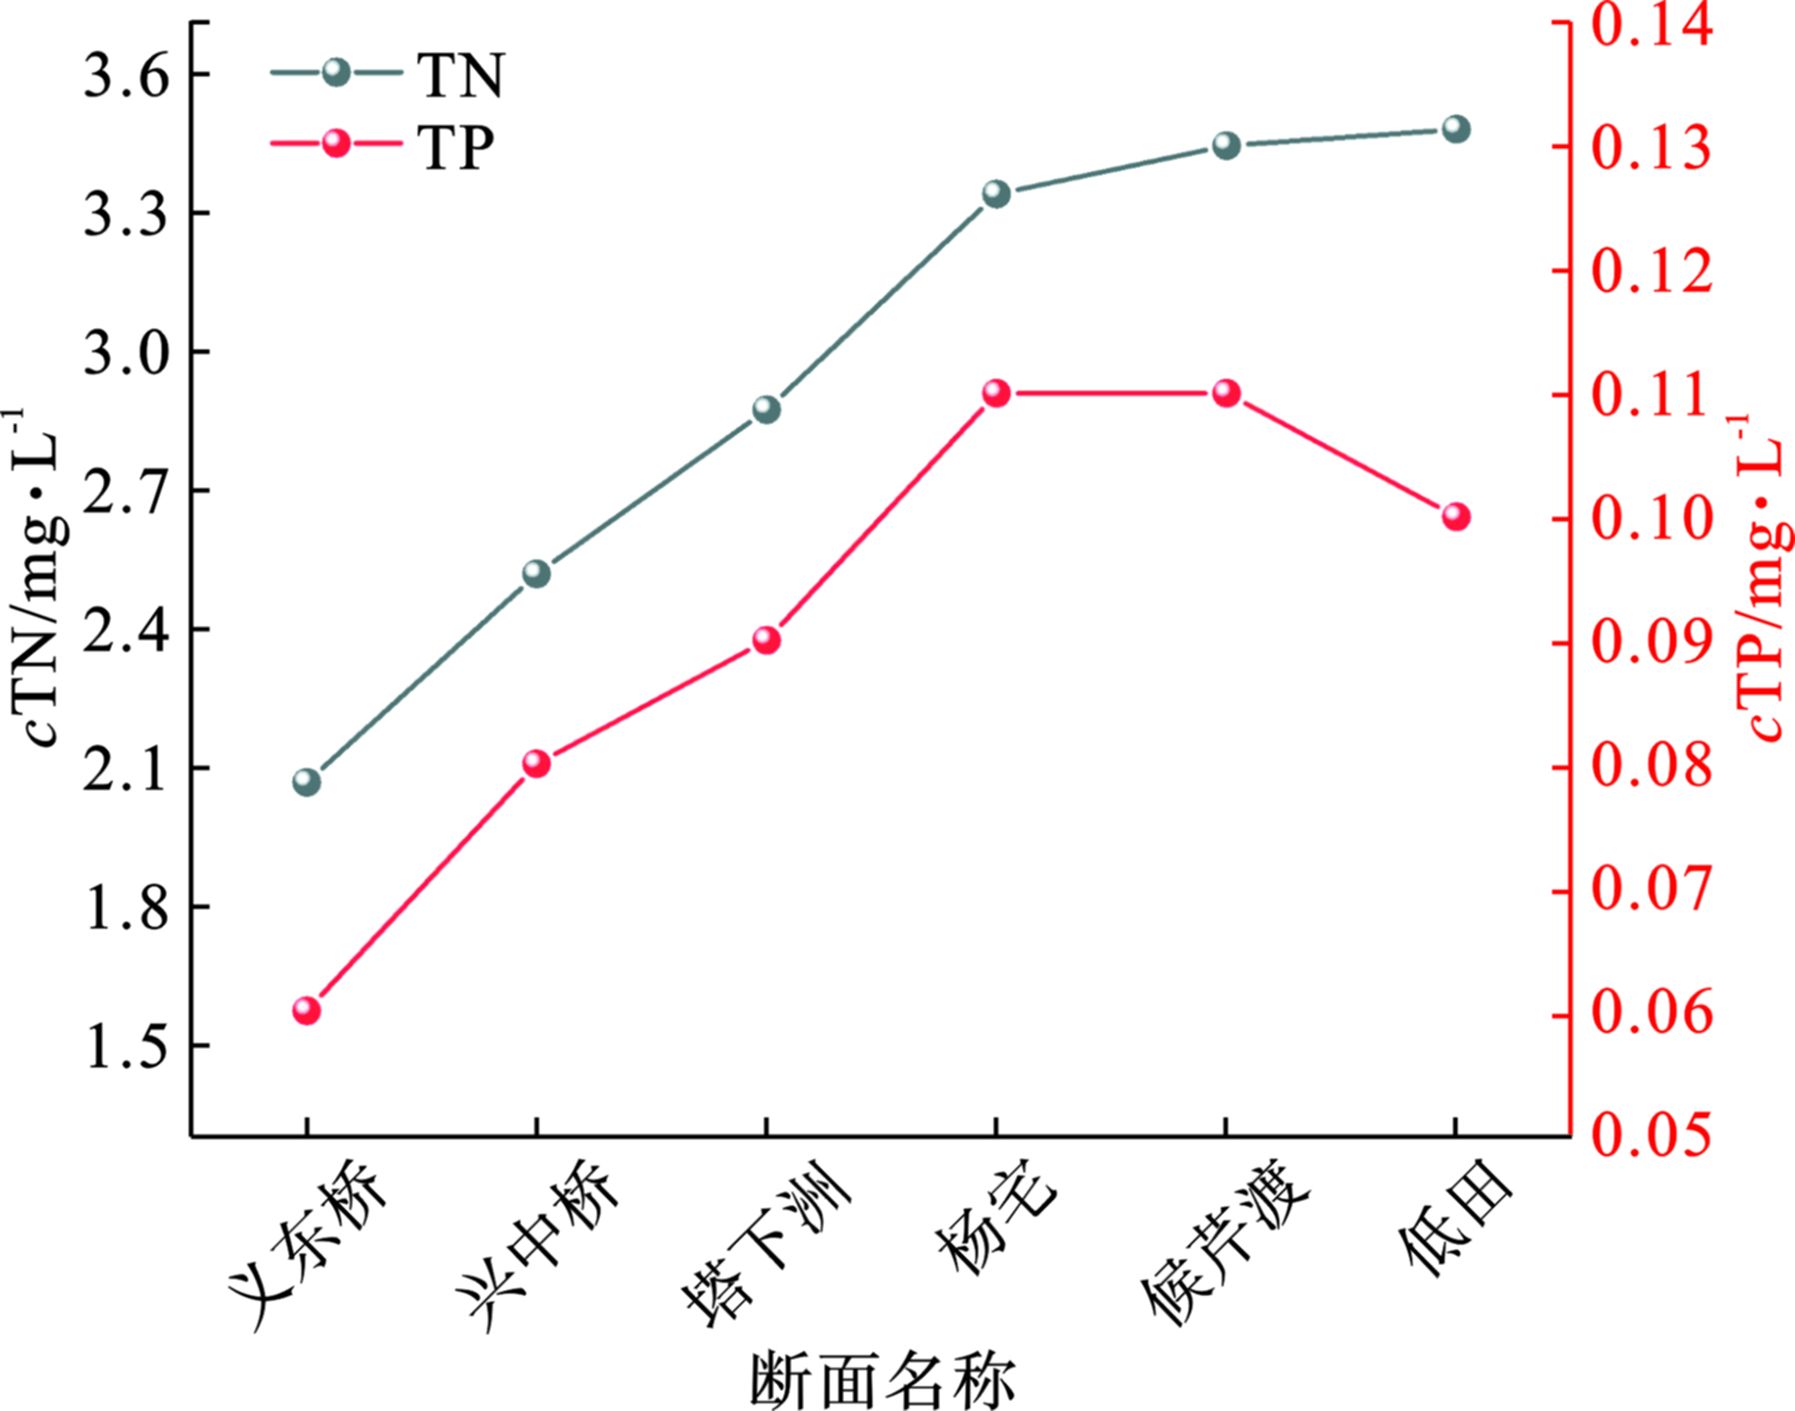
2019年3月对义乌江6个县控断面进行的水质监测结果表明,上游义东桥断面TN、TP浓度较低,水质相对较好;而下游低田断面TN、TP浓度较高,水质较差,见图2。
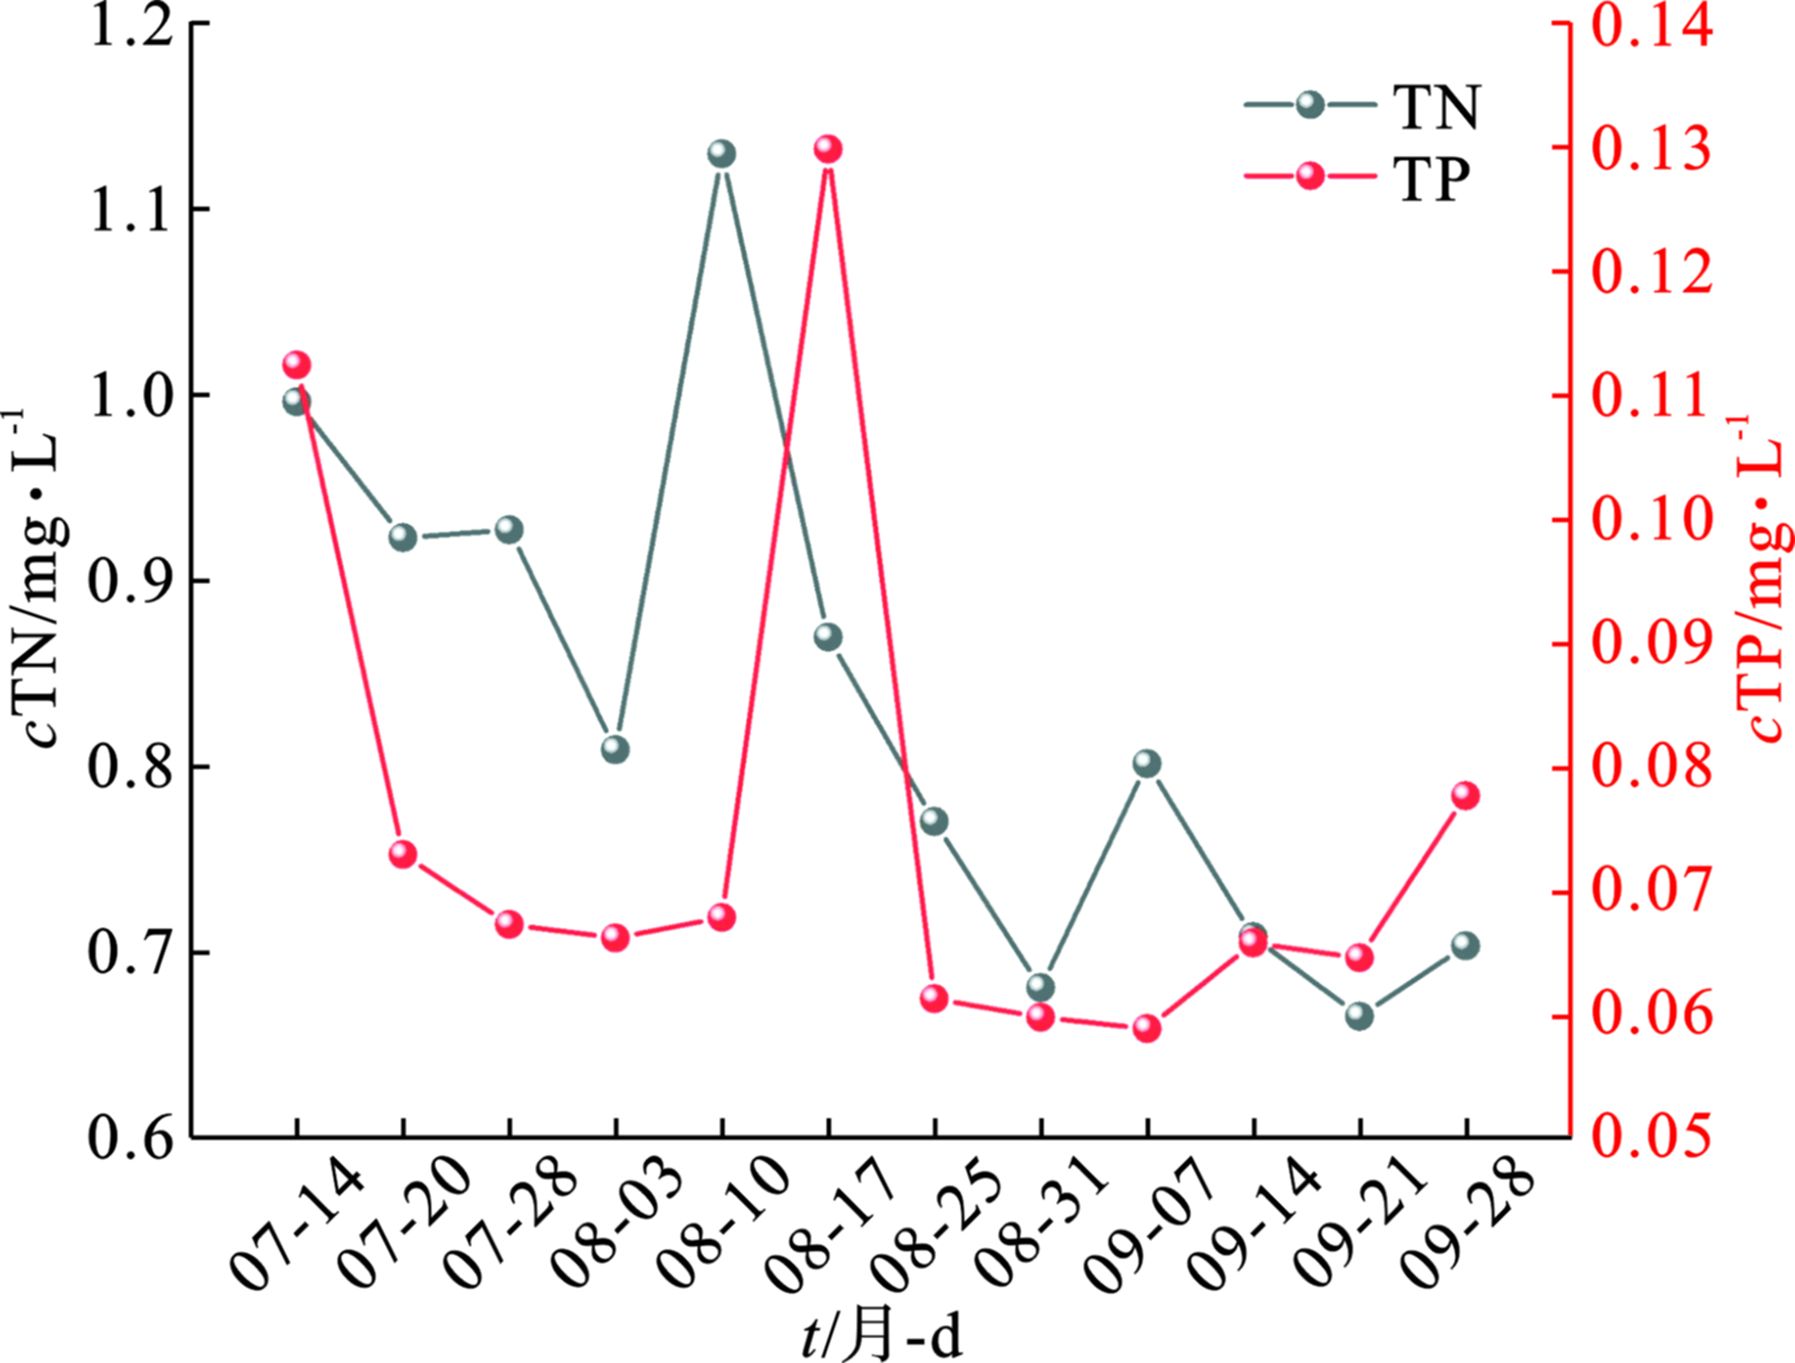
图2可知,与国内外一致认可的水体发生富营养化的TN、TP浓度相比(0.2 mg/L、0.02 mg/L),即使是最上游的义东桥断面的TN浓度(2.06 mg/L)、TP浓度(0.06 mg/L)也均大幅超出富营养化阈值。其中,TN污染最为严重,已超出地表V类水标准,水体富营养化风险较高。由2020年夏季岩口水库TN、TP浓度的变化情况,见图3。
图3可知,TN、TP浓度分别在0.66~1.13 mg/L、0.018~0.089 mg/L之间,N/P约为15。不同的N/P不仅会对藻细胞的生长产生影响,甚至影响到藻细胞内物质的合成与积累,P元素还可以抵御紫外线对其产生的抑制作用[8]。通常浮游生物中N/P约为16,因此,库内水环境比较适合藻细胞的生长繁殖。
-
在调研期间,岩口水库表层水体pH在8.88~9.93之间,见表2。这也就导致表层水体中CO2含量较高,从而促进藻类生长[9]。相比于表层水体的pH来说,底层水体pH较低(6.85~8.68),现场的浮游植物生物量也较少。值得注意的是,在温度和pH相差不大的情况下,TN、TP浓度较高的义乌江藻华较少,而TN、TP浓度较低的水库和坑塘却极易暴发藻华。这可能是因为,库和塘的水动力作用较弱,水体混合深度较浅,水力滞留时间较长,增加了藻类繁殖的时长,进而加剧了藻华的暴发[10]。
综上所述,岩口水库农业面源污染和底泥释放提供的TN、TP浓度为藻华暴发提供了必要的营养物质;夏季水面温度和pH的升高为藻细胞提供了适宜的生长环境,可诱导藻华的暴发;水体自身的水力滞留时间长短也影响了藻华暴发的程度。每年6~9月,岩口水库降雨多、营养足、温度高、水动力作用弱,适宜藻类大量生长繁殖,从而导致藻华暴发频次增多。
-
鉴于义乌市水体藻华暴发频率增多,藻类监测显得尤为迫切,开发有效的监测方法是防治藻华的关键,选用适当的监测方法不仅可以监测藻类的时空变化[11],还可以预测藻华暴发的时间节点[12],方便水务部门制定有针对性的防治策略,从而达到理想的控藻效果。本研究根据目前义乌市水体出现藻华问题的原因筛选了适合义乌市的藻类监测方法。
-
现场监测是最常用也是最直观的监测方法之一。现场巡视可以观测到富营养化水体的视觉特征、嗅觉特征、理化指标和生物指标等[9]。视觉特征包括藻类颜色、聚集形态和颗粒大小等,可初步判断藻密度和藻龄大小;嗅觉特征主要是通过闻水体有无腥臭味来判断藻类生理周期;而理化指标和生物指标需要借助便携式水质多参数检测仪测定水温、透明度、pH、DO、NTU和Chl-a等理化指标[13]。因此,现场巡视可以有效的监测预警藻华动态,相关部门可定期前往义乌市的不同水体,现场监测这5大指标,以便对藻华暴发做出预警。
-
显微镜鉴定、细胞计数和色素分析一直是富营养化水体监测的常用方法。通过这些方法获得的数据与世界卫生组织设定的阈值进行比较,可以建立藻华预警监测系统[14]。显微镜镜检是通过肉眼观察藻类细胞个体大小和群体形态特征来判断藻细胞所处生长阶段,通过细胞计数估算藻密度。色素分析是使用有机溶剂(如乙醇或丙酮)从目标生物中提取Chl-a,采用分光光度法和荧光分析来估算浮游植物总量。在实际采样时,可以适当增大采样体积,以提高监测精度。通常TN、TP浓度的增加可导致水体富营养化,而两者之间的作用往往是相互影响的[15]。义乌市水务部门可以利用同一水体往年营养盐数据的月度变化和藻类密度之间的相关性,建立模型进行藻华预警[16]。通常实验室分析的优势在于监测指标值的准确度较高,因此,对义乌市富营养化水体进行实验室分析也是必不可少的。
-
在藻华预警监测中,可以利用遥感数据建立遥感监测预警系统[17],监测藻华的起始时间、暴发面积、暴发频次和迁移方向等信息[18]。通常不同卫星携带着不同性能的传感器,大型浅水湖泊多采用MODIS、MERIS等高光谱数据来建立特征波段与遥感数据间的经验、半经验模型,而小型浅水水库则适宜选用高空间分辨率的OLI遥感数据来构建预警监测模型。与卫星遥感相比,无人机遥感能以较高的时间频率(每天数次)和相对较低的经济成本捕获具有较高空间分辨率的图像,从而建立可靠的定量预测模型[19]。对于藻华暴发的中高度风险水体可将卫星遥感监测作为藻类监测预警手段,但该方法不仅会因气象因素干扰监测结果,而且为特定水体选择合适的模型仍是一大难题。相比于我国太湖、巢湖和滇池等大型富营养化湖泊,义乌市富营养化水体较小且程度较轻[20],不太适合选用卫星遥感监测。无人机遥感经济方便,可同步采集图像和水样,更适合于义乌市水体藻华监测。
-
在线监测系统是一种操作简便、稳定性高、适用范围广的自动化监测藻华的方法。现场实测气象条件和在线监测的水温、NTU、pH 、DO、TP、TN和Chl-a等指标是预测藻华暴发的影响因子。例如,Chl-a浓度与水温、pH和DO等呈显著的正相关关系,若这些理化指标迅速上升,则表明藻类可能在生长繁殖[21],故可达到预警效果。通过自动在线监测系统与预测模型相结合,可以提供一种实时藻类监测和预警的新方法,方便对水库支流的浮游植物动态进行短期预报。对于义乌市的富营养化水体而言,采用在线监测设备长期监测水质并建立预测模型是一种经济可行的监测方案。
-
岩口水库是义乌市最大的饮用水源地,其内部的营养状态较低,但夏季较易暴发低密度藻华;义乌江为义乌市的主要河流,其营养盐浓度较高,是引发藻华暴发的影响因素之一。这两处水源肩负着百余万义乌人的健康使命和经济重担,均应及时监测水质变化并预警藻华暴发,以便水务部门可以第一时间采取应对措施。对比几种监测方法,见表3,义乌市未来水体富营养化监测技术手段可以考虑以操作便捷且成本较低的在线监测为主体,辅之以现场巡视和实验室分析以提高数据准确度,同时定期对监测数据进行校核。
综上所述,本文根据义乌市典型水库和河流(岩口水库和义乌江)藻华的问题现状和根源,结合现有的监测技术,对义乌市未来富营养化水体的长期监测方案提出以下建议。
(1)在各类水体的适当位置安装数台在线监测设备以动态收集相应水体的水质常规理化指标,同时结合气象数据进行分析。
(2)在每年4~10月(藻华暴发前后),每隔一周去现场调研5大观测指标,并依据水体状况进行布点采样。
(3)将样品带回实验室分析理化指标并进行显微镜镜检,观察水体中藻的种类和藻细胞密度。
综上所述,未来义乌市的监测布局可以利用在线监测操作便捷且成本较低的优势对水体进行长期监测,定期通过现场监测和实验室分析来验证在线监测的准确性,以便构建较为准确的预测模型,管理人员也可提前采取相关措施来防控藻华进一步暴发。
义乌市水体富营养化藻华问题分析和监测方案建议
Analysis and monitoring scheme of algal blooms of water body in Yiwu City
-
摘要: 为探究适用于义乌市富营养化水体的藻华监测方案,调研了义乌市具有代表性的岩口水库和义乌江的常规水质指标,分析了义乌市水体藻华暴发的问题现状和影响因素,并结合现有的藻华监测方法,筛选了适合义乌市的藻华监测方法。结果表明:水温、营养盐和水动力等因素均可显著影响富营养化水体的藻华暴发;现场监测、实验室分析、遥感监测和在线监测均可适用于义乌市不同类型富营养化水体的藻华监测。总体监测方案建议是以在线监测作为主体,辅之以现场巡视和实验室分析,并定期对监测数据进行校核。Abstract: To explore the monitoring scheme of algal blooms suitable for eutrophication water bodies in Yiwu City, the problem status and influencing factors of algal blooms were analyzed by monitoring the water quality indicators of the representative water bodies (Yankou Reservoir and Yiwu River). Considering the existing algal blooms monitoring methods, the algal blooms monitoring methods suitable for Yiwu City were proposed. The results showed that water temperature, nutrient salt and hydrodynamics could significantly affect the growth of algal blooms in eutrophic water body. In-site monitoring, laboratory analysis, remote sensing and online monitoring could be performed for the algal bloom monitoring of different types of eutrophic water bodies in Yiwu. The overall monitoring scheme was proposed that the online monitoring was the main method with additional site inspections and laboratory analysis, and the monitoring data should be regularly checked.
-
Key words:
- Yiwu River /
- Yankou Reservoir /
- eutrophication /
- alga monitoring /
- chlorophyll a
-
义乌市地处浙江省中部,有多个中小型水库和河流,主要代表为岩口水库和义乌江。岩口水库位于义乌市上溪镇岩口村(119°54′11″~119°55′13″ E,29°17′25″~29°18′49″ N),是义乌市最大的饮用水水库,总库容为3 590万m3,平均水深26.4 m,集供水、灌溉、防洪和发电为一体的中型丘陵水库。饮用水源地的水库富营养化和藻华暴发已成为当前生态环境的重要威胁[1],岩口水库也不例外。原居林等[2]评价岩口水库底泥肥力处于较高水平,且随着时间的推移,上游营养盐持续汇入水库,导致水体和底泥污染加剧,极易诱发藻华暴发。义乌江系东阳江下游的一段,位于义乌市境内,是义乌市最主要的河流,共有17条支流,其中航慈溪于后矮村流入岩口水库,合乔里何溪、溪华溪、斯何溪出水库往南,于月潭东入义乌江。义乌江全长39.75 km,有多个排污口,是污水厂出水的受纳水体。因此,义乌江的营养盐含量易受排污口排水的影响,水质基本处于Ⅴ类水和劣Ⅴ类水水平[3]。
2020年夏季岩口水库藻华暴发,导致水库周围的生态环境进一步恶化,干扰水产养殖的正常运行,一定程度上阻碍了周边旅游业的发展[4]。部分蓝藻(如微囊藻、颤藻等)会释放藻毒素,长期暴露于有毒藻华的空气中会对附近居民的身体健康构成潜在威胁[5]。本研究主要以义乌市典型水体——岩口水库水体和义乌江的富营养化现状为例,分析水体藻华暴发的原因;并将现有监测手段与该地区的水体藻华问题结合,确定可以采用的监测手段;最后,对未来义乌市水体富营养化监测技术的合理布局提出建议。
1. 义乌市水体藻华问题现状及原因
1.1 义乌市水体藻华问题现状
随着义乌市小商品经济的快速发展,较为密集的人类活动严重污染了当地水环境,加剧了水体富营养化程度。在典型的富营养化水体中,岩口水库水体属于中度富营养化,易在夏季暴发藻华;而义乌江属于贫营养化,较少出现藻华[6]。本研究按表1布点进行了采样并测定了Chl-a浓度,结果表明,岩口水库上游4条溪流(溪华溪、黄山溪、斯何溪和金傅宅溪)大部分时间处于中营养状态,而水库内部的营养状态较低。在每年5~9月,岩口水库都将暴发不同程度的藻华。其中,上游4条入库溪流中斯何溪和黄山溪的藻华最为严重。美国环境保护局(US EPA)采用叶绿素a(Chl-a) 作为水体营养化等级标准:ρ(Chl-a)> 10 mg/m3,富营养化;4 mg/m3 <ρ(Chl-a)< 10 mg/m3,中营养化;ρ(Chl-a)< 4 mg/m3,贫营养化。因此,夏季岩口水库多为富营养化状态,极易暴发藻华。
表 1 2020年6~9月岩口水库及上游入库溪流的Chl-a浓度变化mg·m−3 t/月-d 库尾 119°54'43.53" E, 29°18'32.40"N 库西北 119°54'33.07" E, 29°18'20.25"N 库东 119°55'13.28" E, 29°17'54.73"N 库西 119°54'34.01" E, 29°17'49.00"N 库中 119°54'58.60" E, 29°17'54.68"N 库坝 119°55'01.15" E, 29°17'27.31"N 黄山溪入口 119°54'45.31" E, 29°19'01.09"N 金傅宅溪入口 119°54'25.95" E, 29°18'54.45"N 溪华溪入口 119°54'12.26" E, 29°18'37.29"N 斯何溪入口 119°54'08.02" E, 29°18'01.83"N 6月15日 3.60 0.11 0.90 3.70 1.00 2.35 35.00 15.00 20.00 30.00 7月20日 20.93 21.62 14.65 17.09 18.83 15.69 40.00 20.23 24.41 35.57 7月28日 11.15 12.90 15.70 11.50 10.45 12.90 3.15 6.65 1.40 14.65 8月3日 4.55 5.95 4.20 6.30 3.50 7.00 11.85 24.75 1.40 9.75 8月10日 14.65 12.90 12.20 12.20 6.65 9.05 3.15 4.55 19.90 1.05 8月17日 9.42 10.46 10.81 8.72 6.28 9.42 19.88 3.14 1.74 16.74 8月25日 17.10 18.50 16.40 16.05 12.55 15.70 19.20 8.35 2.10 32.55 9月7日 10.80 14.65 8.35 11.15 16.05 14.65 26.85 10.80 0.70 21.95 9月14日 11.50 8.35 11.85 15.00 8.35 11.85 7.30 1.75 1.75 9.75 9月21日 3.14 10.46 5.23 4.88 5.93 10.81 7.32 0.70 2.09 27.20 1.2 义乌市水体藻华暴发原因
1.2.1 水面温度的影响
在2020年5~9月调研期间,岩口水库光照充足、热分层现象明显,底层水温低至13.1~25.1 ℃,而表层水温在24.05~31.87 ℃之间,正是藻类生长繁殖的最适温度。2020年岩口水库水温和Chl-a变化情况,见图1。
图1可知,随着水温的升高,衡量浮游植物生物量的Chl-a浓度也在升高;在8月期间,水温达到31 ℃以上,Chl a浓度随着水温的升高也在逐渐增大,随后岩口水库达到富营养化水平(ρ(Chl a)> 10 mg/m3),藻华暴发的风险极高。一般而言,温度会通过影响细胞内酶的活性来影响藻类的光合作用和生长代谢活动[7],因而湖面水温与藻华暴发息息相关,水温升高会导致藻类生长活性增强,本次调研结果也证实了这点。并且义乌市属于亚热带季风气候,加之全球变暖的趋势愈演愈烈,因此,一般夏季水体藻华问题较为严重,控制难度有所增加。
1.2.2 营养盐的影响
2019年3月对义乌江6个县控断面进行的水质监测结果表明,上游义东桥断面TN、TP浓度较低,水质相对较好;而下游低田断面TN、TP浓度较高,水质较差,见图2。
图2可知,与国内外一致认可的水体发生富营养化的TN、TP浓度相比(0.2 mg/L、0.02 mg/L),即使是最上游的义东桥断面的TN浓度(2.06 mg/L)、TP浓度(0.06 mg/L)也均大幅超出富营养化阈值。其中,TN污染最为严重,已超出地表V类水标准,水体富营养化风险较高。由2020年夏季岩口水库TN、TP浓度的变化情况,见图3。
图3可知,TN、TP浓度分别在0.66~1.13 mg/L、0.018~0.089 mg/L之间,N/P约为15。不同的N/P不仅会对藻细胞的生长产生影响,甚至影响到藻细胞内物质的合成与积累,P元素还可以抵御紫外线对其产生的抑制作用[8]。通常浮游生物中N/P约为16,因此,库内水环境比较适合藻细胞的生长繁殖。
1.2.3 其他因素的影响
在调研期间,岩口水库表层水体pH在8.88~9.93之间,见表2。这也就导致表层水体中CO2含量较高,从而促进藻类生长[9]。相比于表层水体的pH来说,底层水体pH较低(6.85~8.68),现场的浮游植物生物量也较少。值得注意的是,在温度和pH相差不大的情况下,TN、TP浓度较高的义乌江藻华较少,而TN、TP浓度较低的水库和坑塘却极易暴发藻华。这可能是因为,库和塘的水动力作用较弱,水体混合深度较浅,水力滞留时间较长,增加了藻类繁殖的时长,进而加剧了藻华的暴发[10]。
表 2 2020年调研期间岩口水库pH变化t/月-d 表层 中层 底层 05-07 9.68 9.57 − 05-11 9.63 9.29 − 05-14 9.60 9.06 − 05-19 9.45 9.08 − 05-29 9.38 8.44 7.91 06-01 9.44 8.36 7.63 06-04 9.26 7.20 7.09 06-08 9.93 8.04 7.21 07-14 9.81 8.14 7.25 07-20 9.85 7.87 7.17 07-28 9.45 7.28 6.85 08-03 9.17 8.43 7.66 08-17 9.24 8.21 8.53 08-25 9.32 7.96 7.61 08-31 9.30 8.59 8.68 09-07 8.88 8.60 8.62 注:“−”表数据缺失。 综上所述,岩口水库农业面源污染和底泥释放提供的TN、TP浓度为藻华暴发提供了必要的营养物质;夏季水面温度和pH的升高为藻细胞提供了适宜的生长环境,可诱导藻华的暴发;水体自身的水力滞留时间长短也影响了藻华暴发的程度。每年6~9月,岩口水库降雨多、营养足、温度高、水动力作用弱,适宜藻类大量生长繁殖,从而导致藻华暴发频次增多。
2. 基于义乌市水体藻华问题的监测方法筛选
鉴于义乌市水体藻华暴发频率增多,藻类监测显得尤为迫切,开发有效的监测方法是防治藻华的关键,选用适当的监测方法不仅可以监测藻类的时空变化[11],还可以预测藻华暴发的时间节点[12],方便水务部门制定有针对性的防治策略,从而达到理想的控藻效果。本研究根据目前义乌市水体出现藻华问题的原因筛选了适合义乌市的藻类监测方法。
2.1 现场监测
现场监测是最常用也是最直观的监测方法之一。现场巡视可以观测到富营养化水体的视觉特征、嗅觉特征、理化指标和生物指标等[9]。视觉特征包括藻类颜色、聚集形态和颗粒大小等,可初步判断藻密度和藻龄大小;嗅觉特征主要是通过闻水体有无腥臭味来判断藻类生理周期;而理化指标和生物指标需要借助便携式水质多参数检测仪测定水温、透明度、pH、DO、NTU和Chl-a等理化指标[13]。因此,现场巡视可以有效的监测预警藻华动态,相关部门可定期前往义乌市的不同水体,现场监测这5大指标,以便对藻华暴发做出预警。
2.2 实验室分析
显微镜鉴定、细胞计数和色素分析一直是富营养化水体监测的常用方法。通过这些方法获得的数据与世界卫生组织设定的阈值进行比较,可以建立藻华预警监测系统[14]。显微镜镜检是通过肉眼观察藻类细胞个体大小和群体形态特征来判断藻细胞所处生长阶段,通过细胞计数估算藻密度。色素分析是使用有机溶剂(如乙醇或丙酮)从目标生物中提取Chl-a,采用分光光度法和荧光分析来估算浮游植物总量。在实际采样时,可以适当增大采样体积,以提高监测精度。通常TN、TP浓度的增加可导致水体富营养化,而两者之间的作用往往是相互影响的[15]。义乌市水务部门可以利用同一水体往年营养盐数据的月度变化和藻类密度之间的相关性,建立模型进行藻华预警[16]。通常实验室分析的优势在于监测指标值的准确度较高,因此,对义乌市富营养化水体进行实验室分析也是必不可少的。
2.3 遥感监测
在藻华预警监测中,可以利用遥感数据建立遥感监测预警系统[17],监测藻华的起始时间、暴发面积、暴发频次和迁移方向等信息[18]。通常不同卫星携带着不同性能的传感器,大型浅水湖泊多采用MODIS、MERIS等高光谱数据来建立特征波段与遥感数据间的经验、半经验模型,而小型浅水水库则适宜选用高空间分辨率的OLI遥感数据来构建预警监测模型。与卫星遥感相比,无人机遥感能以较高的时间频率(每天数次)和相对较低的经济成本捕获具有较高空间分辨率的图像,从而建立可靠的定量预测模型[19]。对于藻华暴发的中高度风险水体可将卫星遥感监测作为藻类监测预警手段,但该方法不仅会因气象因素干扰监测结果,而且为特定水体选择合适的模型仍是一大难题。相比于我国太湖、巢湖和滇池等大型富营养化湖泊,义乌市富营养化水体较小且程度较轻[20],不太适合选用卫星遥感监测。无人机遥感经济方便,可同步采集图像和水样,更适合于义乌市水体藻华监测。
2.4 在线监测
在线监测系统是一种操作简便、稳定性高、适用范围广的自动化监测藻华的方法。现场实测气象条件和在线监测的水温、NTU、pH 、DO、TP、TN和Chl-a等指标是预测藻华暴发的影响因子。例如,Chl-a浓度与水温、pH和DO等呈显著的正相关关系,若这些理化指标迅速上升,则表明藻类可能在生长繁殖[21],故可达到预警效果。通过自动在线监测系统与预测模型相结合,可以提供一种实时藻类监测和预警的新方法,方便对水库支流的浮游植物动态进行短期预报。对于义乌市的富营养化水体而言,采用在线监测设备长期监测水质并建立预测模型是一种经济可行的监测方案。
3. 义乌市富营养化水体监测方案
岩口水库是义乌市最大的饮用水源地,其内部的营养状态较低,但夏季较易暴发低密度藻华;义乌江为义乌市的主要河流,其营养盐浓度较高,是引发藻华暴发的影响因素之一。这两处水源肩负着百余万义乌人的健康使命和经济重担,均应及时监测水质变化并预警藻华暴发,以便水务部门可以第一时间采取应对措施。对比几种监测方法,见表3,义乌市未来水体富营养化监测技术手段可以考虑以操作便捷且成本较低的在线监测为主体,辅之以现场巡视和实验室分析以提高数据准确度,同时定期对监测数据进行校核。
表 3 藻类监测方法对比表监测方法 优点 缺点 适用场所 现场监测 最有效、最直观 成本高 中小型水体 实验室分析 成本低、精确度高 耗时费力且需要专业人员操作 监测各类水体和模型验证 遥感监测 可大范围监测藻类暴发强度和分布特征且成本低 受气象条件影响大 藻华严重的大型水体 在线监测 便捷、成本低 数据准确度低 湖泊、水库 综上所述,本文根据义乌市典型水库和河流(岩口水库和义乌江)藻华的问题现状和根源,结合现有的监测技术,对义乌市未来富营养化水体的长期监测方案提出以下建议。
(1)在各类水体的适当位置安装数台在线监测设备以动态收集相应水体的水质常规理化指标,同时结合气象数据进行分析。
(2)在每年4~10月(藻华暴发前后),每隔一周去现场调研5大观测指标,并依据水体状况进行布点采样。
(3)将样品带回实验室分析理化指标并进行显微镜镜检,观察水体中藻的种类和藻细胞密度。
综上所述,未来义乌市的监测布局可以利用在线监测操作便捷且成本较低的优势对水体进行长期监测,定期通过现场监测和实验室分析来验证在线监测的准确性,以便构建较为准确的预测模型,管理人员也可提前采取相关措施来防控藻华进一步暴发。
-
表 1 2020年6~9月岩口水库及上游入库溪流的Chl-a浓度变化
mg·m−3 t/月-d 库尾 119°54'43.53" E, 29°18'32.40"N 库西北 119°54'33.07" E, 29°18'20.25"N 库东 119°55'13.28" E, 29°17'54.73"N 库西 119°54'34.01" E, 29°17'49.00"N 库中 119°54'58.60" E, 29°17'54.68"N 库坝 119°55'01.15" E, 29°17'27.31"N 黄山溪入口 119°54'45.31" E, 29°19'01.09"N 金傅宅溪入口 119°54'25.95" E, 29°18'54.45"N 溪华溪入口 119°54'12.26" E, 29°18'37.29"N 斯何溪入口 119°54'08.02" E, 29°18'01.83"N 6月15日 3.60 0.11 0.90 3.70 1.00 2.35 35.00 15.00 20.00 30.00 7月20日 20.93 21.62 14.65 17.09 18.83 15.69 40.00 20.23 24.41 35.57 7月28日 11.15 12.90 15.70 11.50 10.45 12.90 3.15 6.65 1.40 14.65 8月3日 4.55 5.95 4.20 6.30 3.50 7.00 11.85 24.75 1.40 9.75 8月10日 14.65 12.90 12.20 12.20 6.65 9.05 3.15 4.55 19.90 1.05 8月17日 9.42 10.46 10.81 8.72 6.28 9.42 19.88 3.14 1.74 16.74 8月25日 17.10 18.50 16.40 16.05 12.55 15.70 19.20 8.35 2.10 32.55 9月7日 10.80 14.65 8.35 11.15 16.05 14.65 26.85 10.80 0.70 21.95 9月14日 11.50 8.35 11.85 15.00 8.35 11.85 7.30 1.75 1.75 9.75 9月21日 3.14 10.46 5.23 4.88 5.93 10.81 7.32 0.70 2.09 27.20 表 2 2020年调研期间岩口水库pH变化
t/月-d 表层 中层 底层 05-07 9.68 9.57 − 05-11 9.63 9.29 − 05-14 9.60 9.06 − 05-19 9.45 9.08 − 05-29 9.38 8.44 7.91 06-01 9.44 8.36 7.63 06-04 9.26 7.20 7.09 06-08 9.93 8.04 7.21 07-14 9.81 8.14 7.25 07-20 9.85 7.87 7.17 07-28 9.45 7.28 6.85 08-03 9.17 8.43 7.66 08-17 9.24 8.21 8.53 08-25 9.32 7.96 7.61 08-31 9.30 8.59 8.68 09-07 8.88 8.60 8.62 注:“−”表数据缺失。 表 3 藻类监测方法对比表
监测方法 优点 缺点 适用场所 现场监测 最有效、最直观 成本高 中小型水体 实验室分析 成本低、精确度高 耗时费力且需要专业人员操作 监测各类水体和模型验证 遥感监测 可大范围监测藻类暴发强度和分布特征且成本低 受气象条件影响大 藻华严重的大型水体 在线监测 便捷、成本低 数据准确度低 湖泊、水库 -
[1] BULLERJAHN G S, MCKAY R M, DAVIS T W, et al. Global solutions to regional problems: Collecting global expertise to address the problem of harmful cyanobacterial blooms. A Lake Erie case study[J]. Harmful Algae, 2016, 54: 223 − 238. doi: 10.1016/j.hal.2016.01.003 [2] 原居林, 李明, 杨元杰, 等. 义乌市岩口水库底泥特征、营养盐含量及污染现状分析[J]. 浙江海洋学院学报(自然科学版), 2015, 34(3): 255 − 262. [3] 王聪, 杨凡, 黄振华, 等. “五水共治”措施对义乌江流域水污染负荷削减的定量分析[J]. 环境工程学报, 2021, 15(4): 1157 − 1166. doi: 10.12030/j.cjee.202008128 [4] 邵志平, 徐圣君, 秦玉, 等. 基于水资源可持续发展与水生态文明建设的义乌“五水共治”新模式[J]. 环境工程学报, 2021, 15(4): 1149 − 1156. doi: 10.12030/j.cjee.202008096 [5] LANDSBERG J H, HENDRICKSON J, TABUCHI M, et al. A large-scale sustained fish kill in the St. Johns River, Florida: A complex consequence of cyanobacteria blooms[J]. Harmful Algae, 2020, 92: 101771. doi: 10.1016/j.hal.2020.101771 [6] 黄振华, 郑效旭, 王聪, 等. 义乌岩口水库汇水区水质时空变化及富营养化特征研究[J]. 环境保护科学, 2021, 47(2): 1 − 8. [7] 王晨旭, 黄廷林, 李楠, 等. 人工强制混合对金盆水库水体藻类群落结构时空演替的影响[J]. 环境科学, 2020, 41(5): 2166 − 2176. [8] REN L X, WANG P F, WANG C, et al. Effects of phosphorus availability and phosphorus utilization behavior of Microcystis aeruginosa on its adaptation capability to ultraviolet radiation[J]. Environmental Pollution, 2020, 256: 113441. doi: 10.1016/j.envpol.2019.113441 [9] 王寿兵, 徐紫然, 张洁. 大型湖库富营养化蓝藻水华防控技术发展述评[J]. 水资源保护, 2016, 32(4): 88 − 99. doi: 10.3880/j.issn.1004-6933.2016.04.015 [10] SCHAEFER A M, YRASTORZA L, STOCKLEY N, et al. Exposure to microcystin among coastal residents during a cyanobacteria bloom in Florida[J]. Harmful Algae, 2020, 92: 101769. doi: 10.1016/j.hal.2020.101769 [11] DUAN W, TAKARA K, HE B, et al. Spatial and temporal trends in estimates of nutrient and suspended sediment loads in the Ishikari River, Japan, 1985 to 2010[J]. Science of the Total Environment, 2013, 461-462: 499 − 508. doi: 10.1016/j.scitotenv.2013.05.022 [12] SHI K, ZHANG Y L, ZHANG Y B, et al. Phenology of phytoplankton blooms in a trophic lake observed from long-term MODIS data[J]. Environmental Science & Technology, 2019, 53(5): 2324 − 2331. [13] 黄君, 张虎军, 江岚, 等. 太湖蓝藻水华预警监测综合系统的构建[J]. 中国环境监测, 2015, 31(1): 139 − 145. doi: 10.3969/j.issn.1002-6002.2015.01.028 [14] SRIVASTAVA A, SINGH S, AHN C Y, et al. Monitoring approaches for a toxic cyanobacterial bloom[J]. Environmental Science & Technology, 2013, 47(16): 8999 − 9013. [15] ZOU W, ZHU G W, CAI Y J, et al. Quantifying the dependence of cyanobacterial growth to nutrient for the eutrophication management of temperate-subtropical shallow lakes[J]. Water Research, 2020, 177: 115806. doi: 10.1016/j.watres.2020.115806 [16] YUAN L L, JONES J R. Rethinking phosphorus–chlorophyll relationships in lakes[J]. Limnology and Oceanography, 2020, 9999: 1 − 11. [17] 王子为, 林佳宁, 张远, 等. 鄱阳湖入湖河流氮磷水质控制限值研究[J]. 环境科学研究, 2020, 33(5): 1163 − 1169. [18] OYAMA Y, FUKUSHIMA T, MATSUSHITA B, et al. Monitoring levels of cyanobacterial blooms using the visual cyanobacteria index (VCI) and floating algae index (FAI)[J]. International Journal of Applied Earth Observation and Geoinformation, 2015, 38: 335 − 348. doi: 10.1016/j.jag.2015.02.002 [19] WU D, LI R P, ZHANG F Y, et al. A review on drone-based harmful algae blooms monitoring[J]. Environment Monitoring and Assessment, 2019, 191: 211. doi: 10.1007/s10661-019-7365-8 [20] 郑效旭, 徐圣君, 王聪, 等. 岩口水库上游农村点源污染问题解析及解决策略[J]. 环境工程学报, 2021, 15(4): 1178 − 1187. [21] 韩新芹, 叶麟, 徐耀阳, 等. 香溪河库湾春季叶绿素a浓度动态及其影响因子分析[J]. 水生生物学报, 2006, 30(1): 89 − 94. doi: 10.3321/j.issn:1000-3207.2006.01.017 -


 DownLoad:


