-
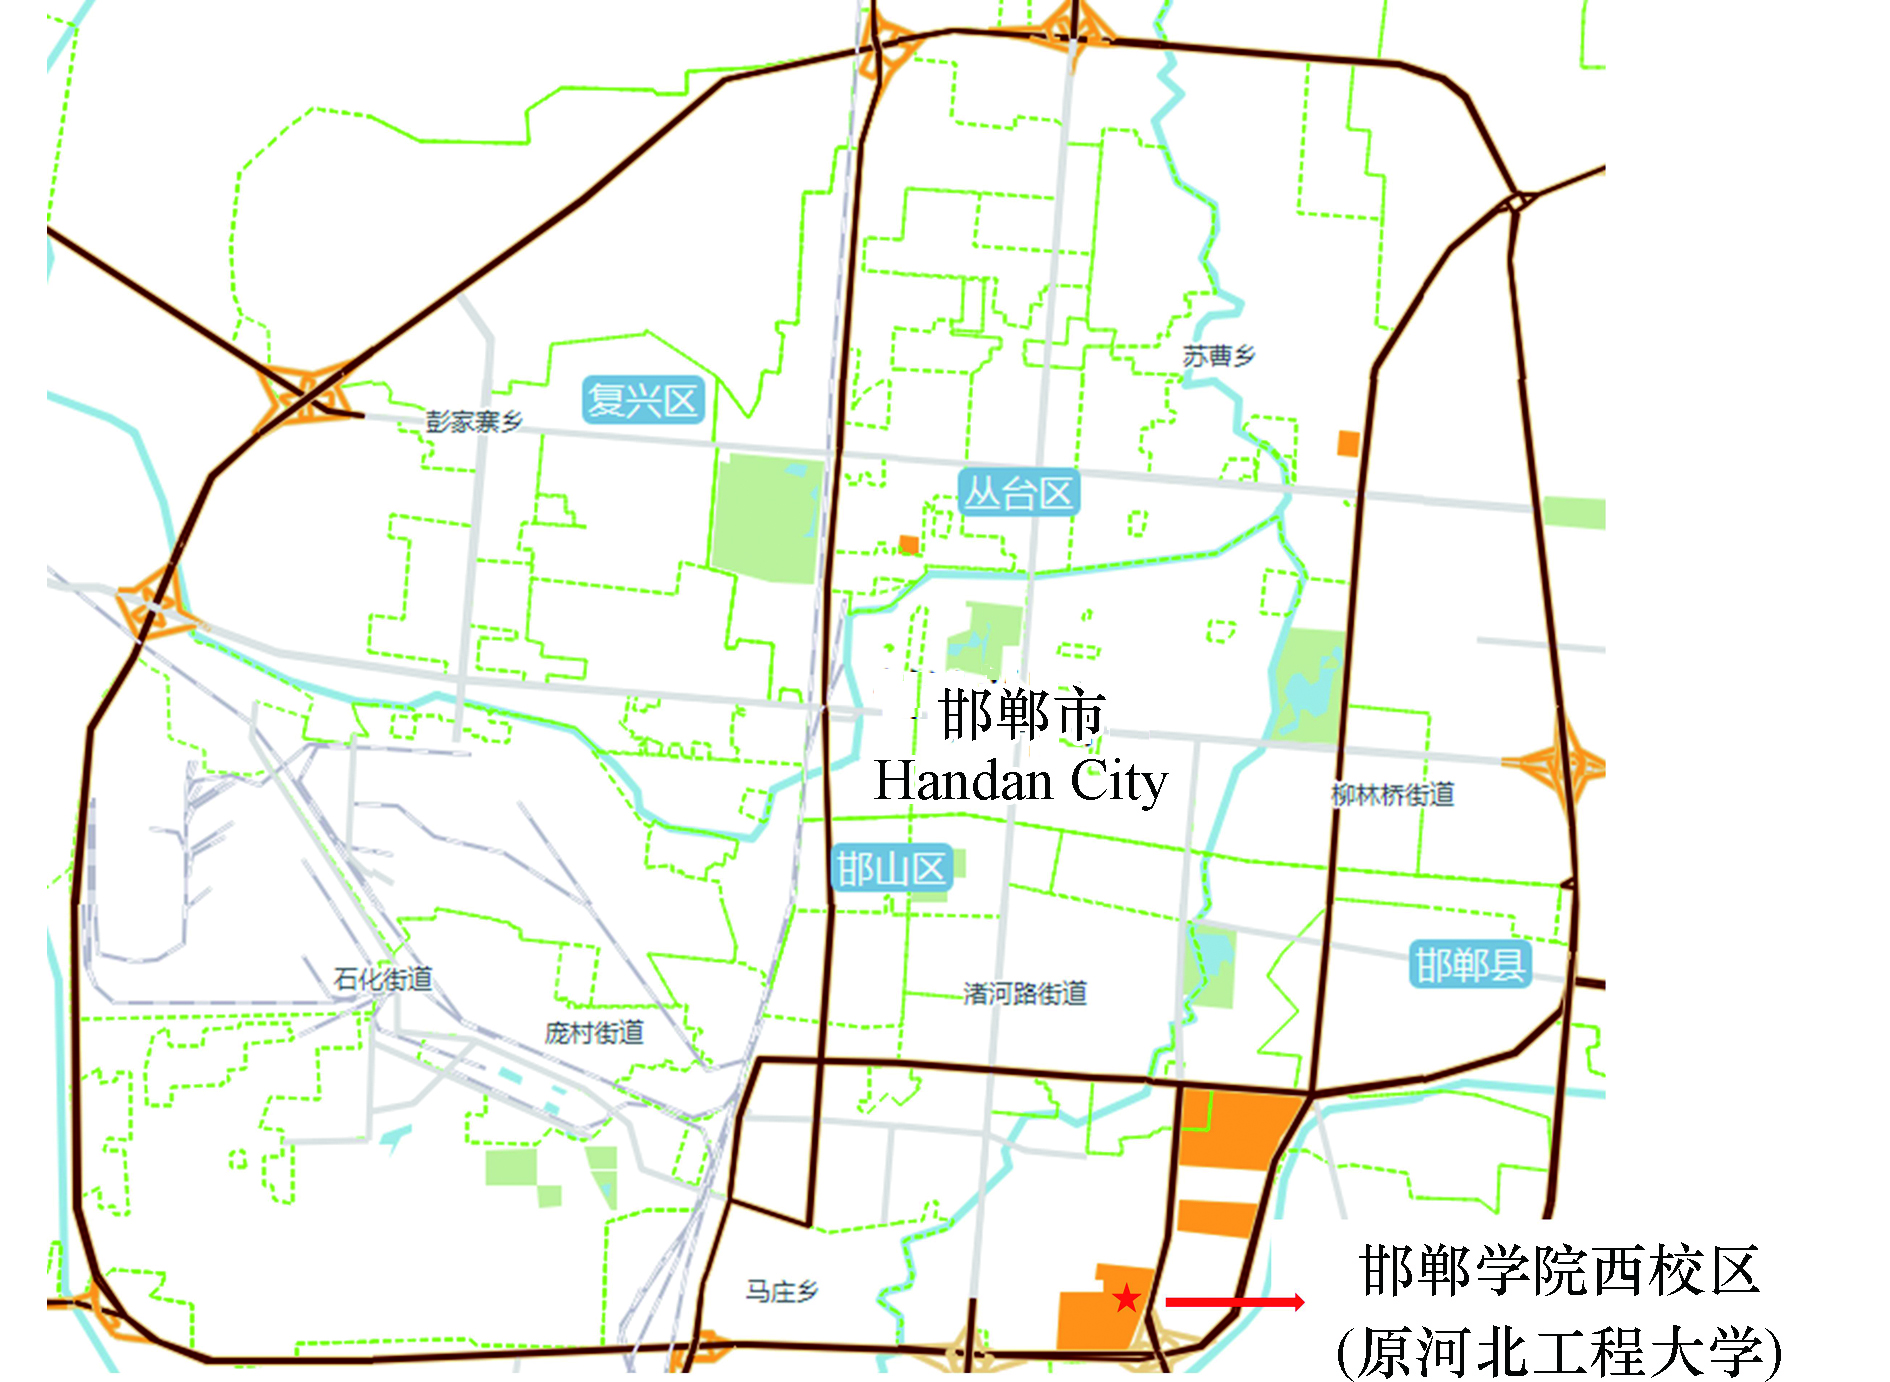
图 1 监测站示意图
Figure 1. location information of monitoring station
-
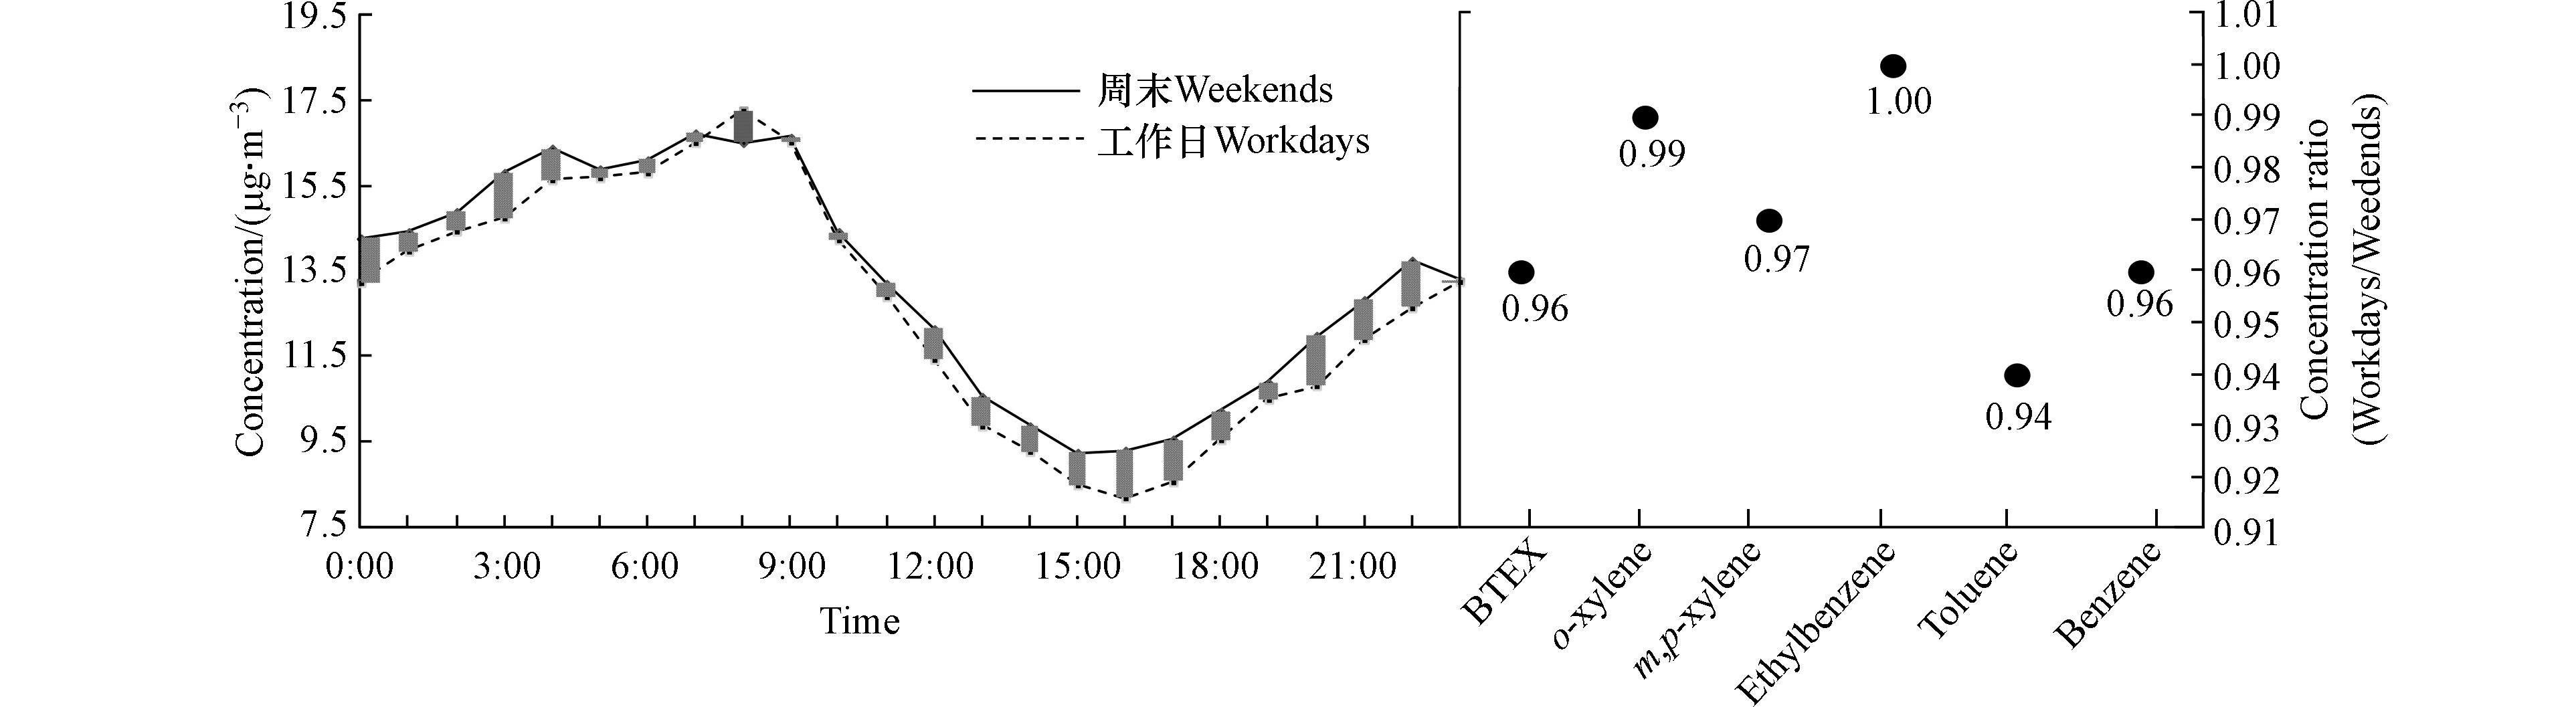
图 2 工作日和周末BTEX的小时平均浓度及浓度比值
Figure 2. Mean hourly concentration and ratios of BTEX on workdays and weekends
-
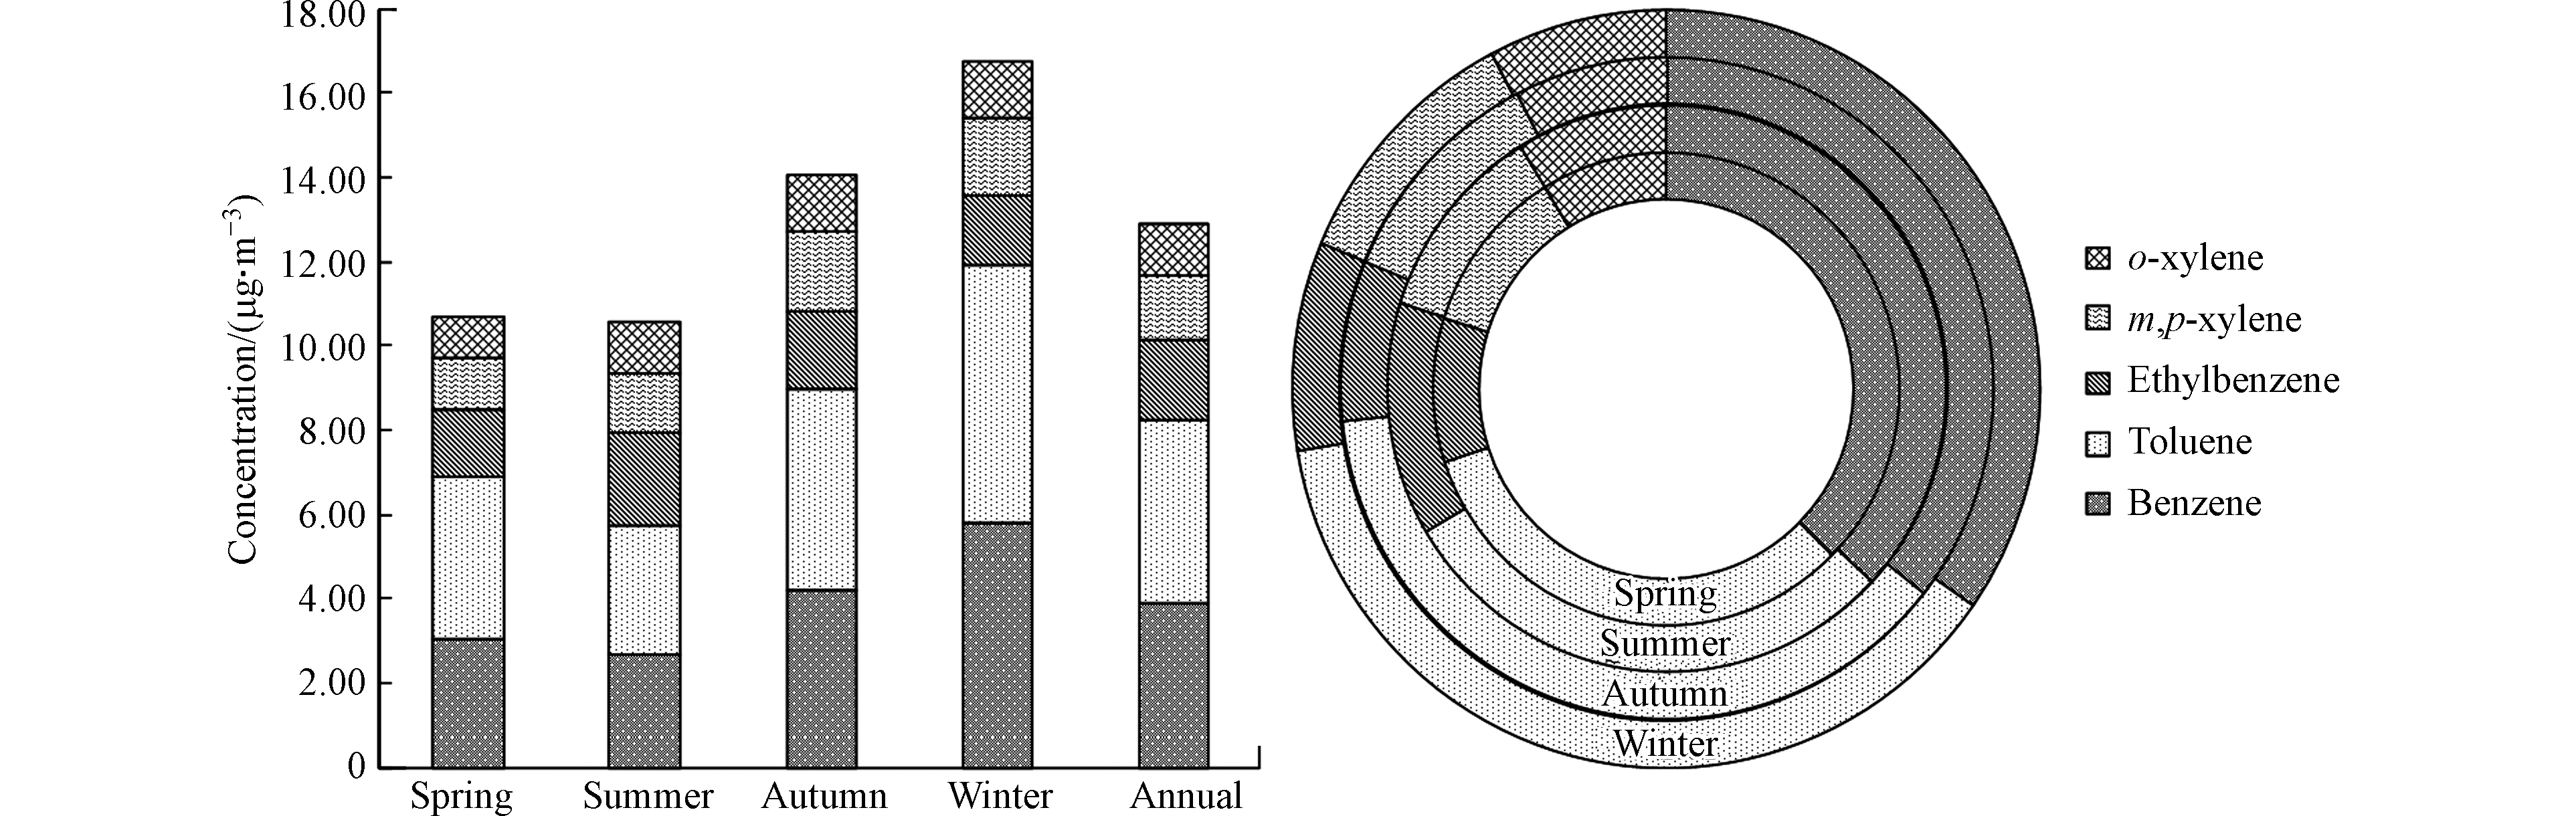
图 3 2018年各季节邯郸市高校区BTEX的浓度及组成
Figure 3. Concentration and composition of BTEX in University District of Handan in each season in 2018
-

图 4 (a)各组分的OFP及浓度值季节变化;(b)SOA贡献量的季节变化
Figure 4. (a) Seasonal variation of OFP and concentration; (b) Seasonal variation of SOA contributions
-
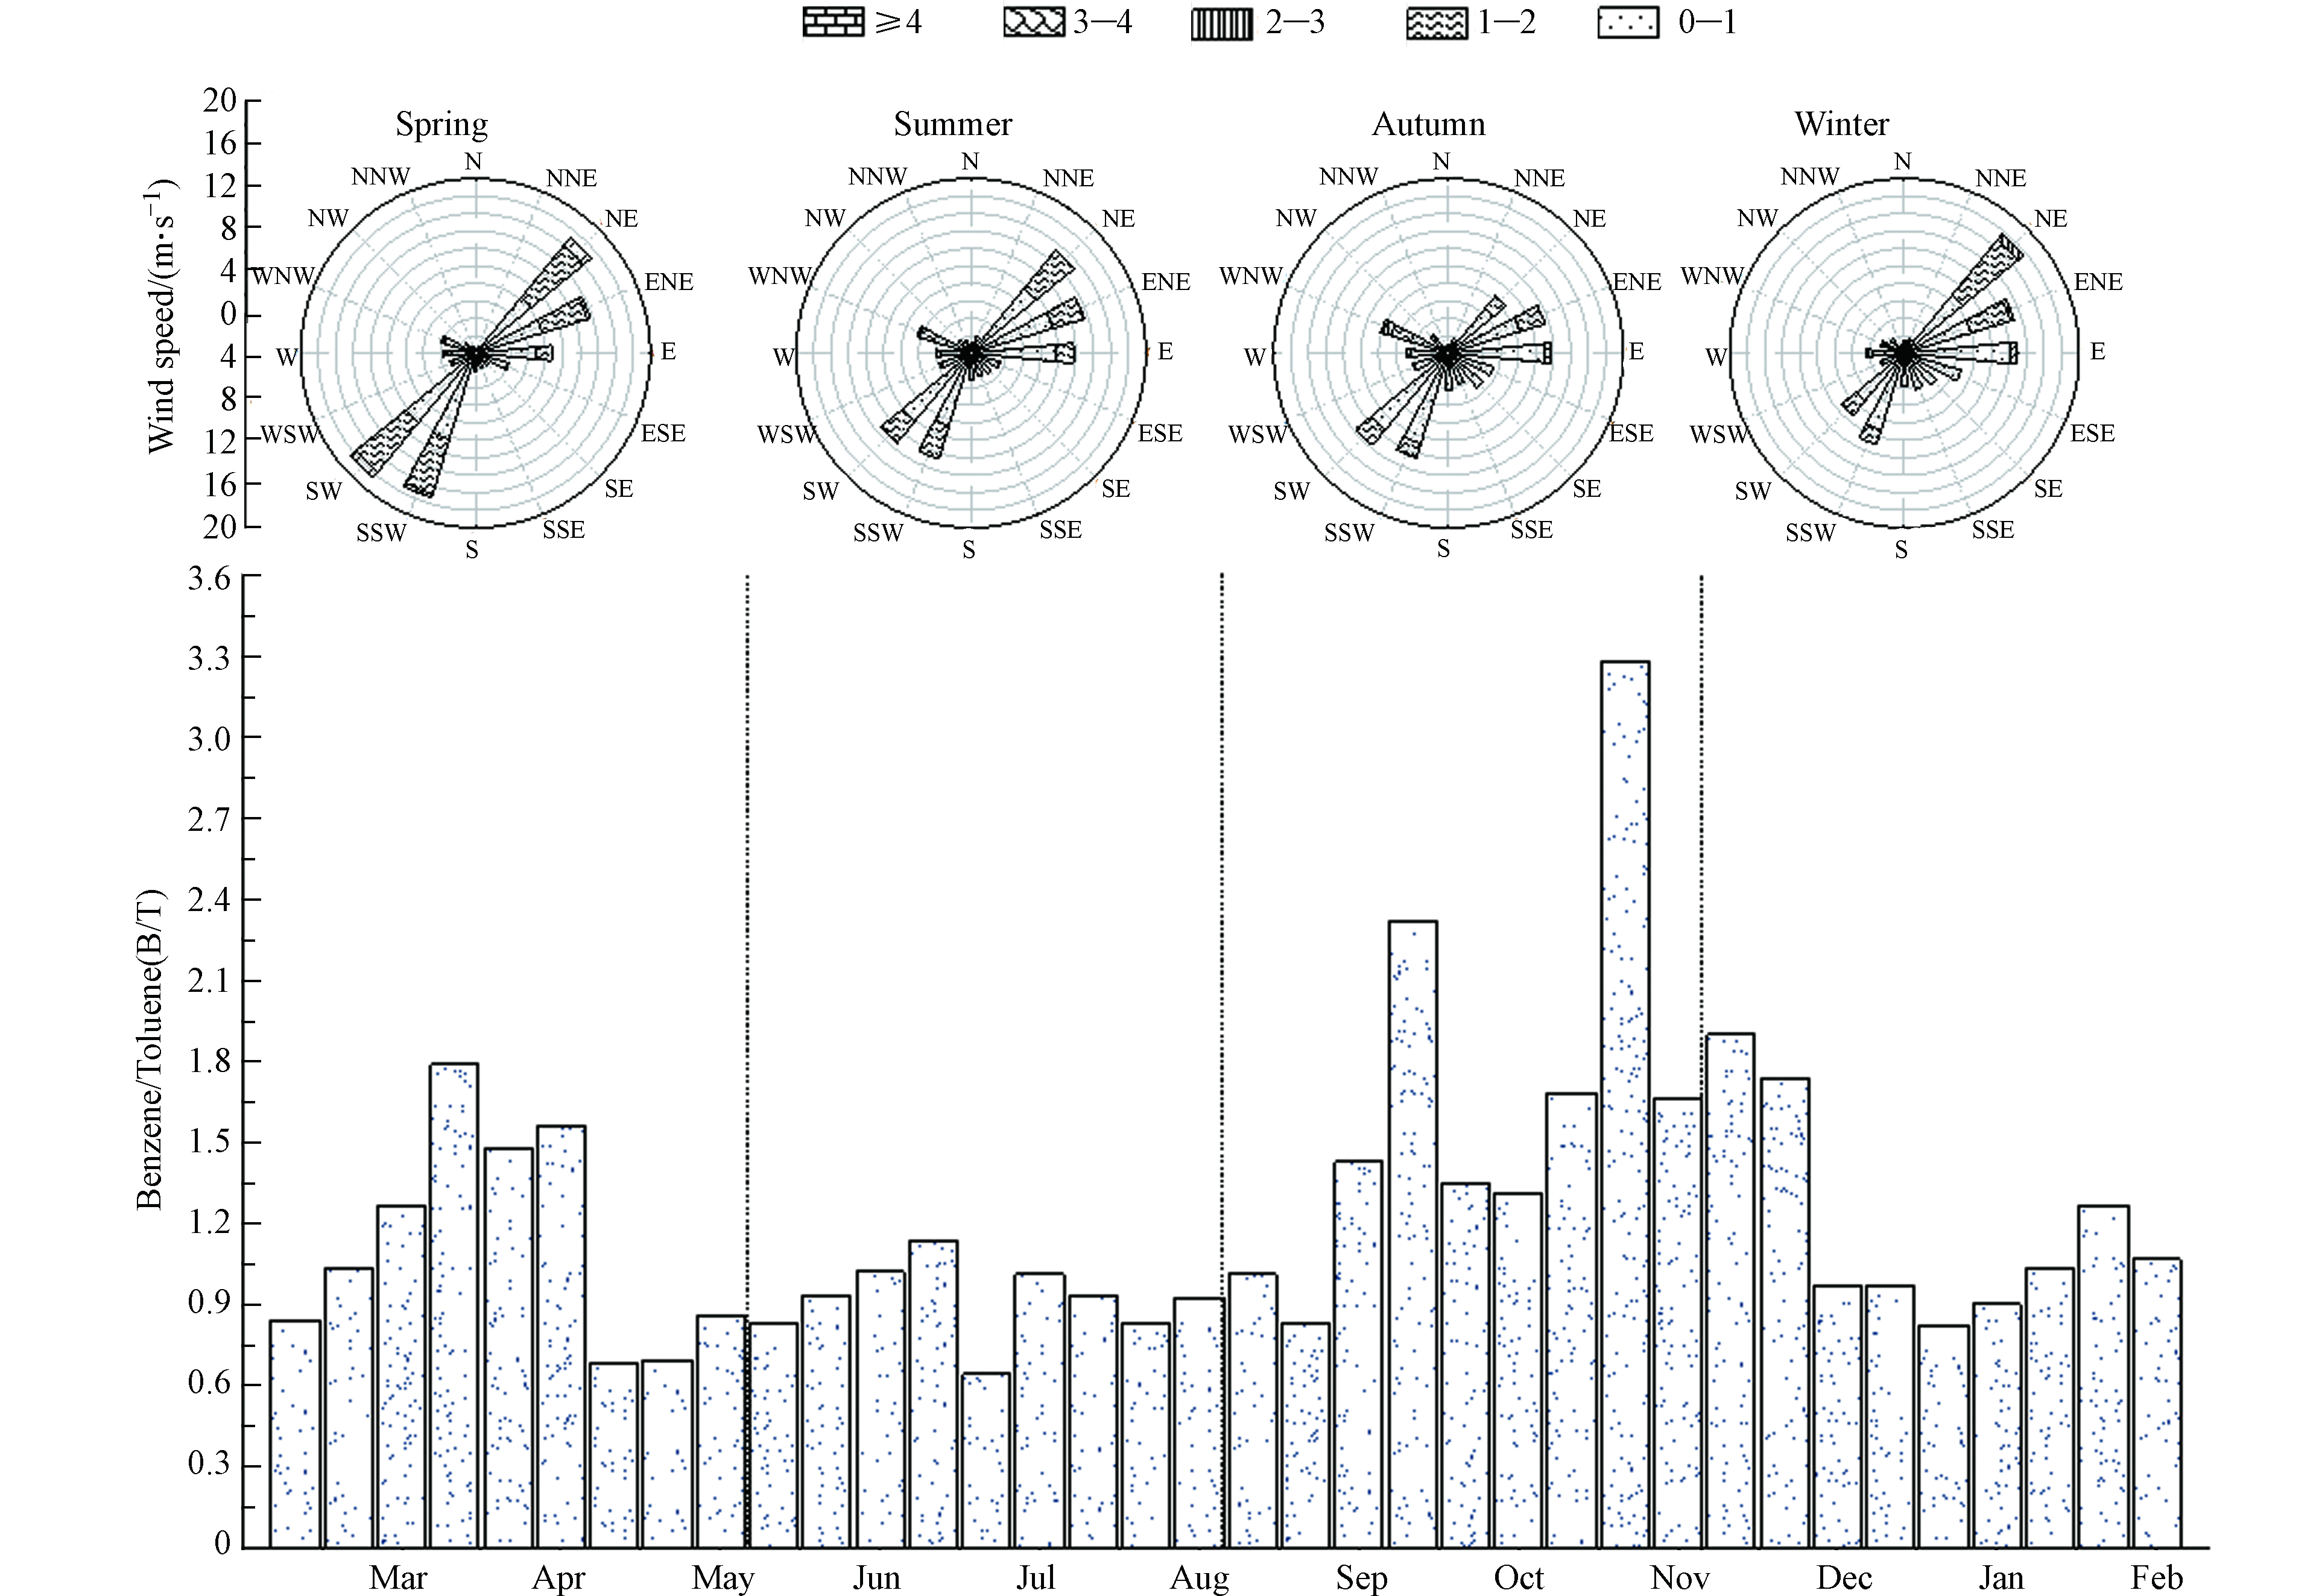
图 5 B/T月比值变化及各季节风速玫瑰图
Figure 5. Monthly ratio of B/T and rose chart of wind speed in each season
-
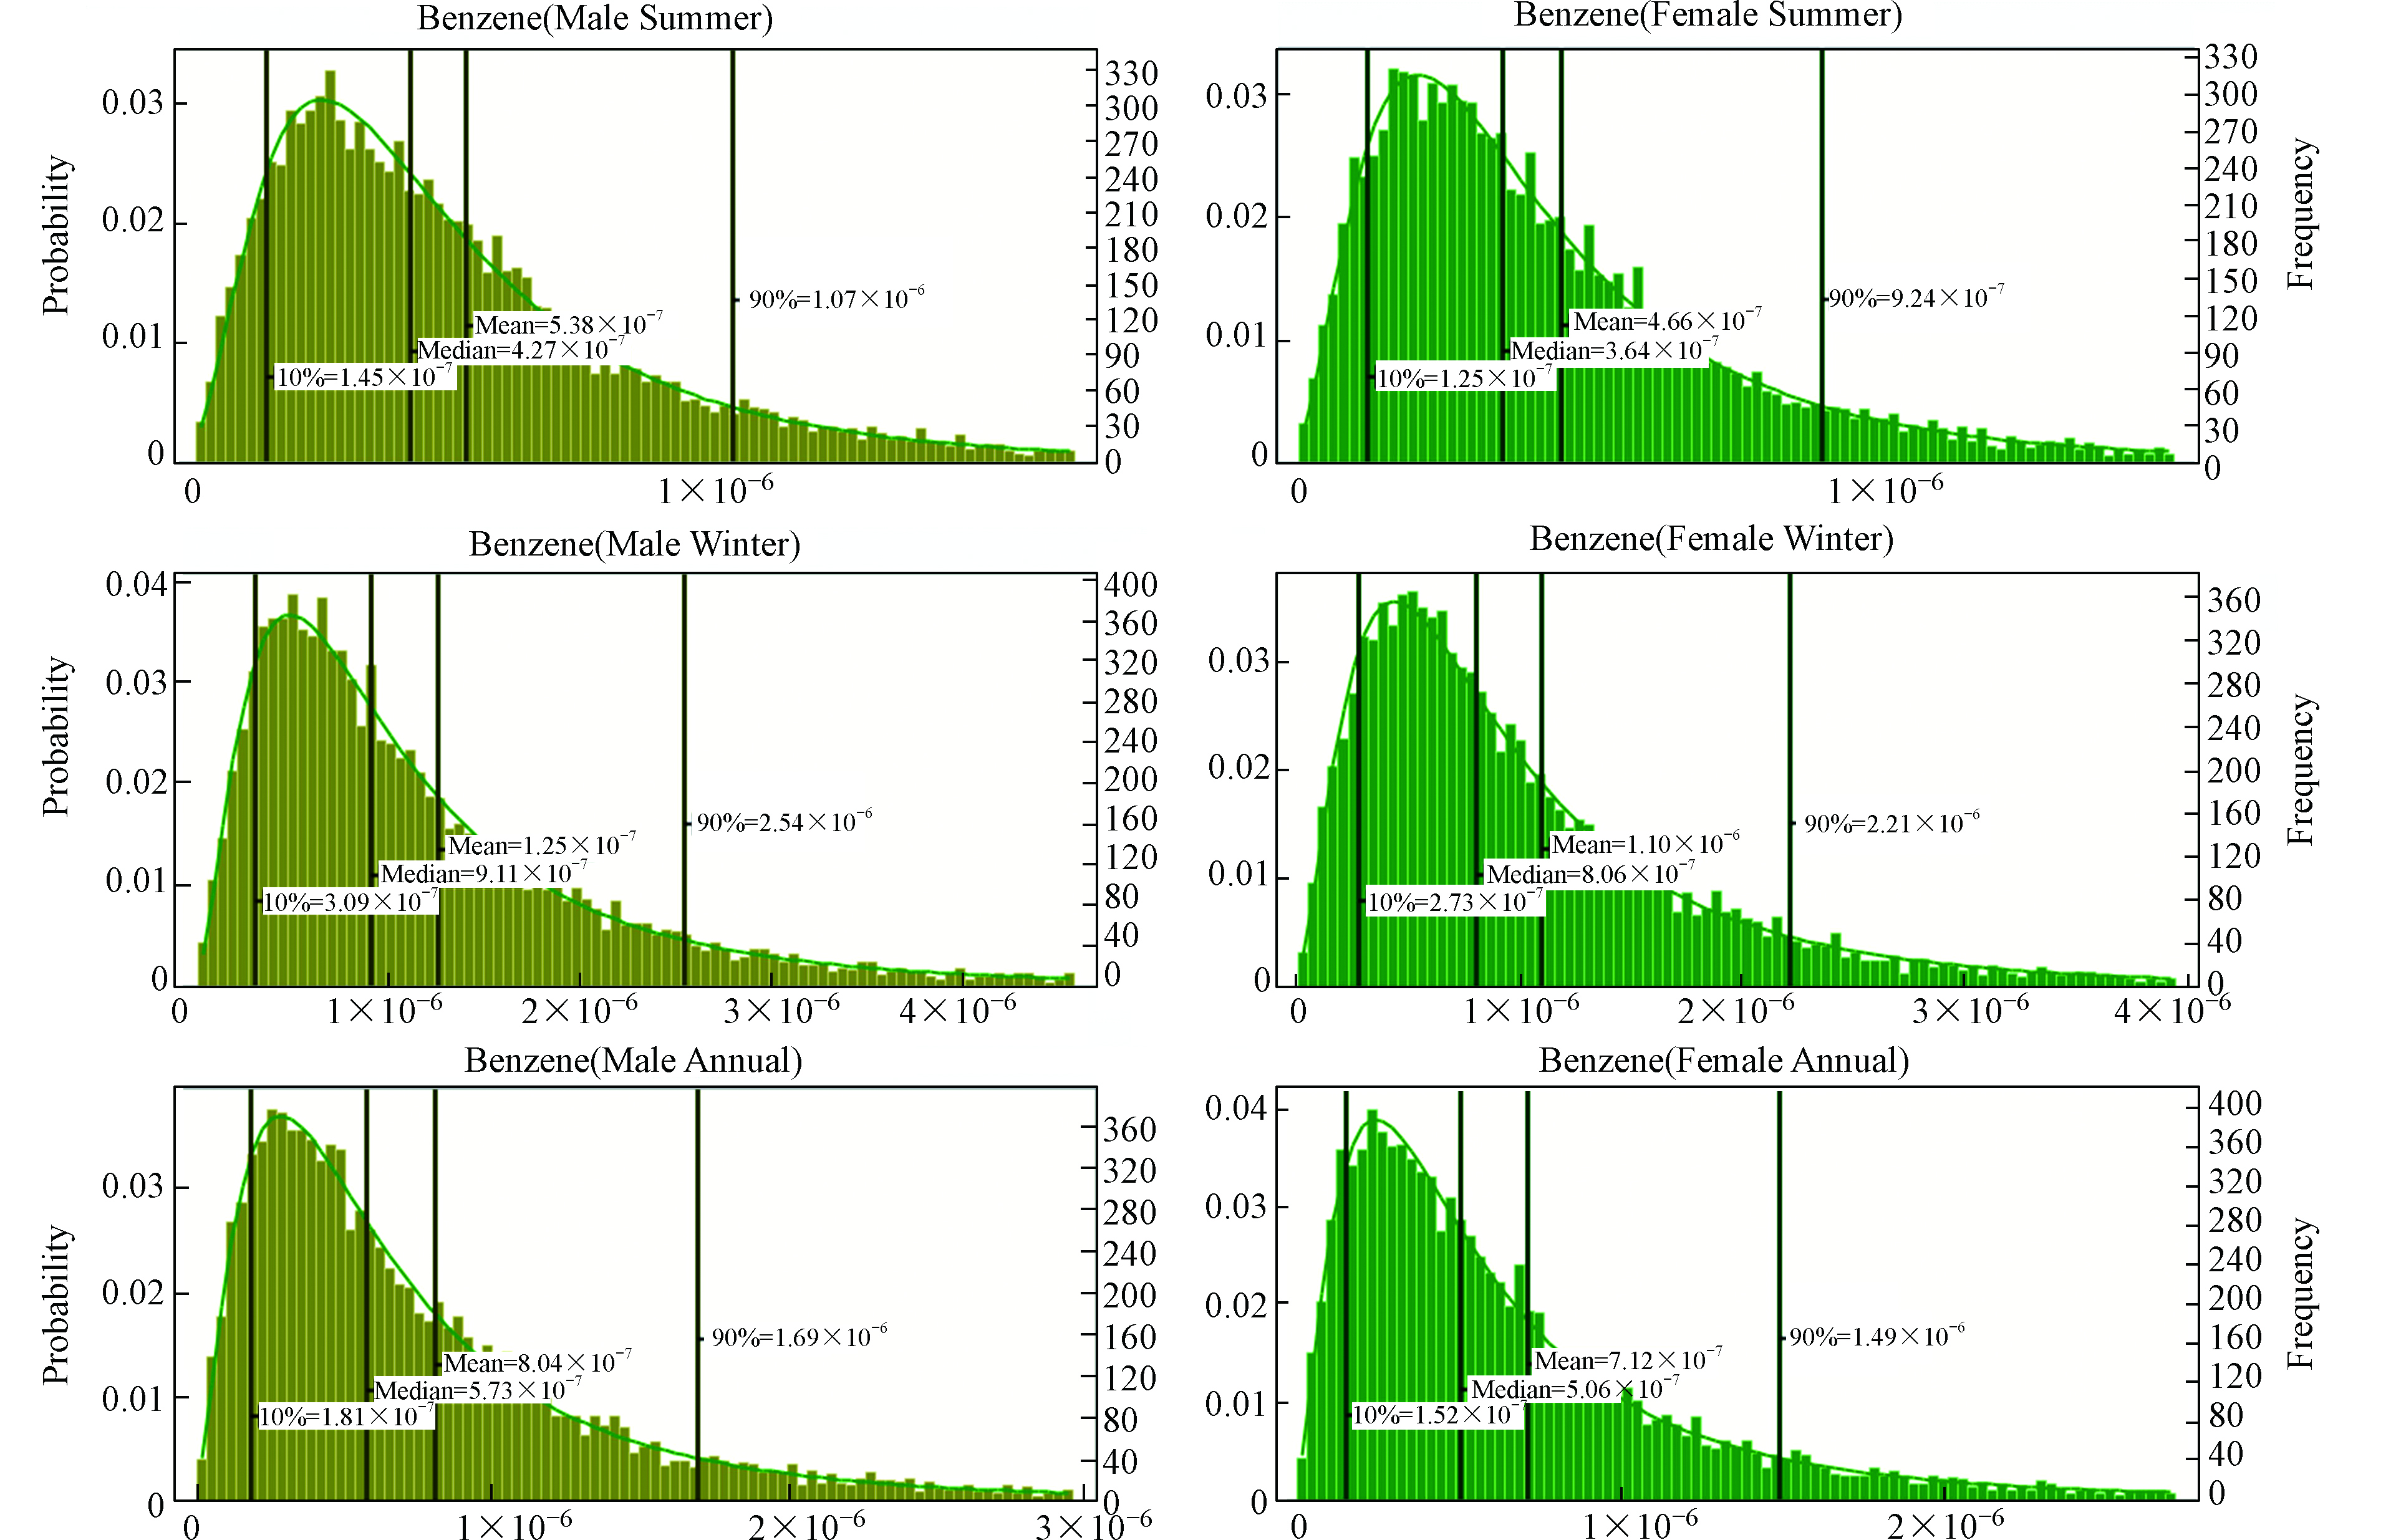
图 6 苯对在校男女大学生的致癌风险
Figure 6. The carcinogenic risk of benzene to college students
Figure
6 ,Table
2 个