-

图 1 采样位点图
Figure 1. Map of sampling sites
-

图 2 不同类型水样中EDCs浓度
Figure 2. Concentration of EDCs in different types of water samples
-
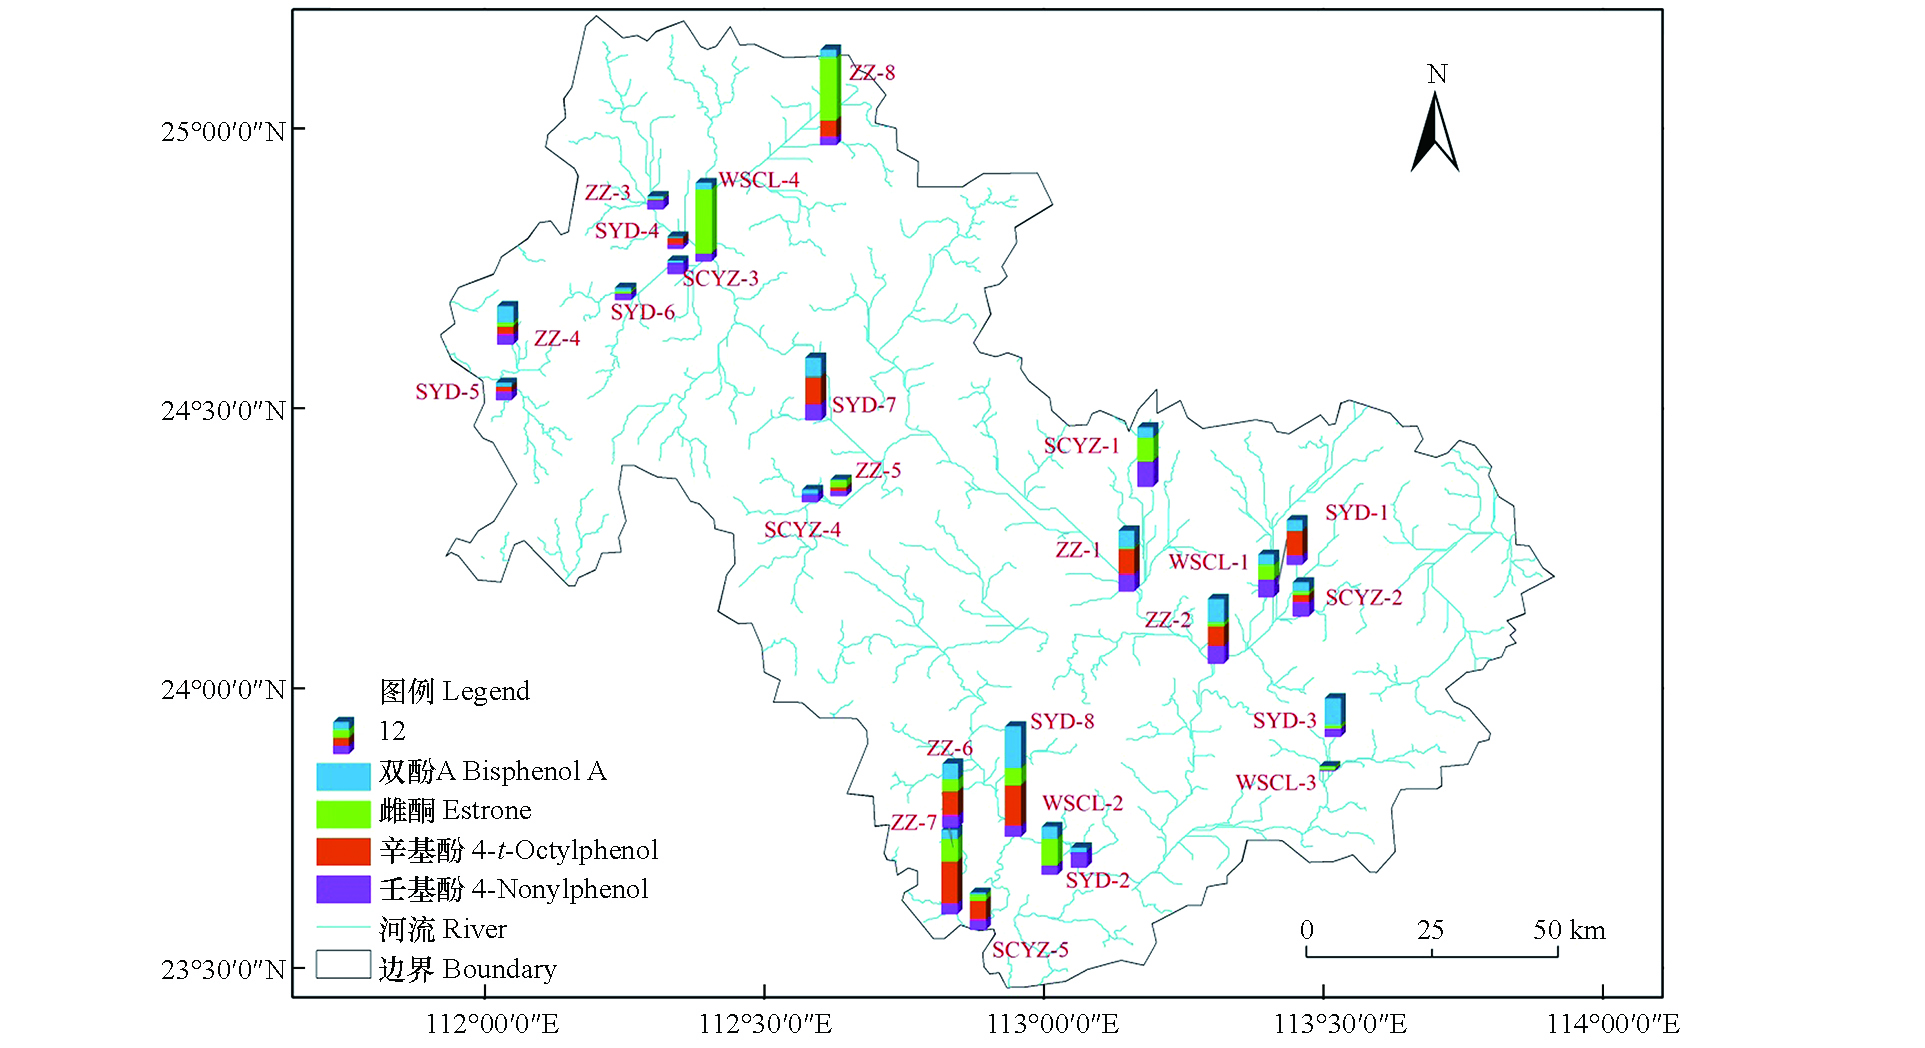
图 3 流域EDCs浓度占比(占自身总量)空间分布
Figure 3. The spatial distribution of endocrine disrupting chemicals concentration ratio (for their own gross)in Beijiang river
-
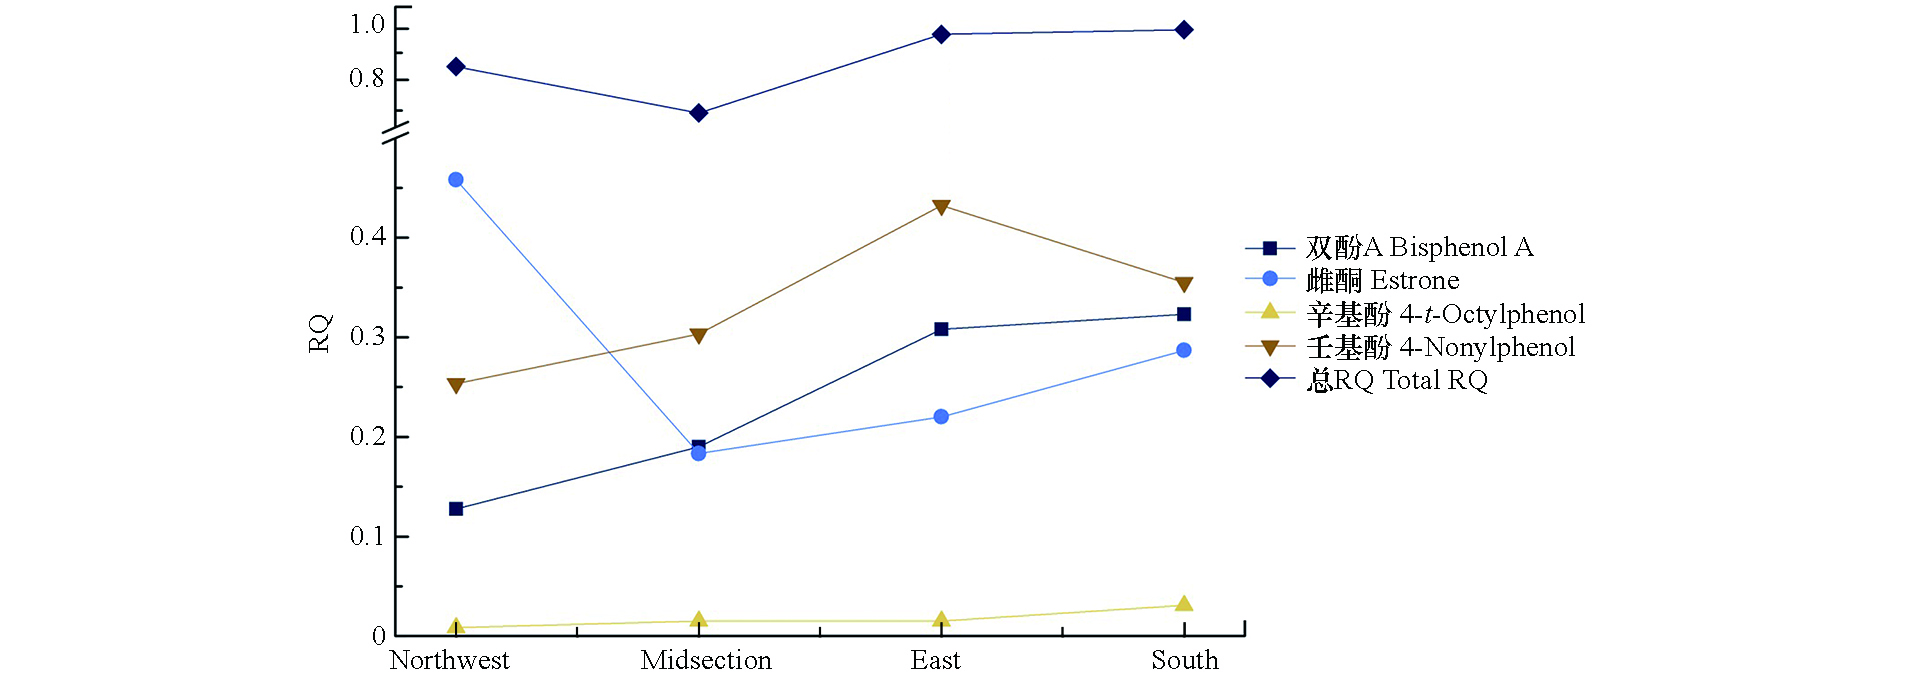
图 4 EDCs流域生态风险
Figure 4. Ecological risks of EDCs in Beijiang River
Figure
4 ,Table
6 个