-
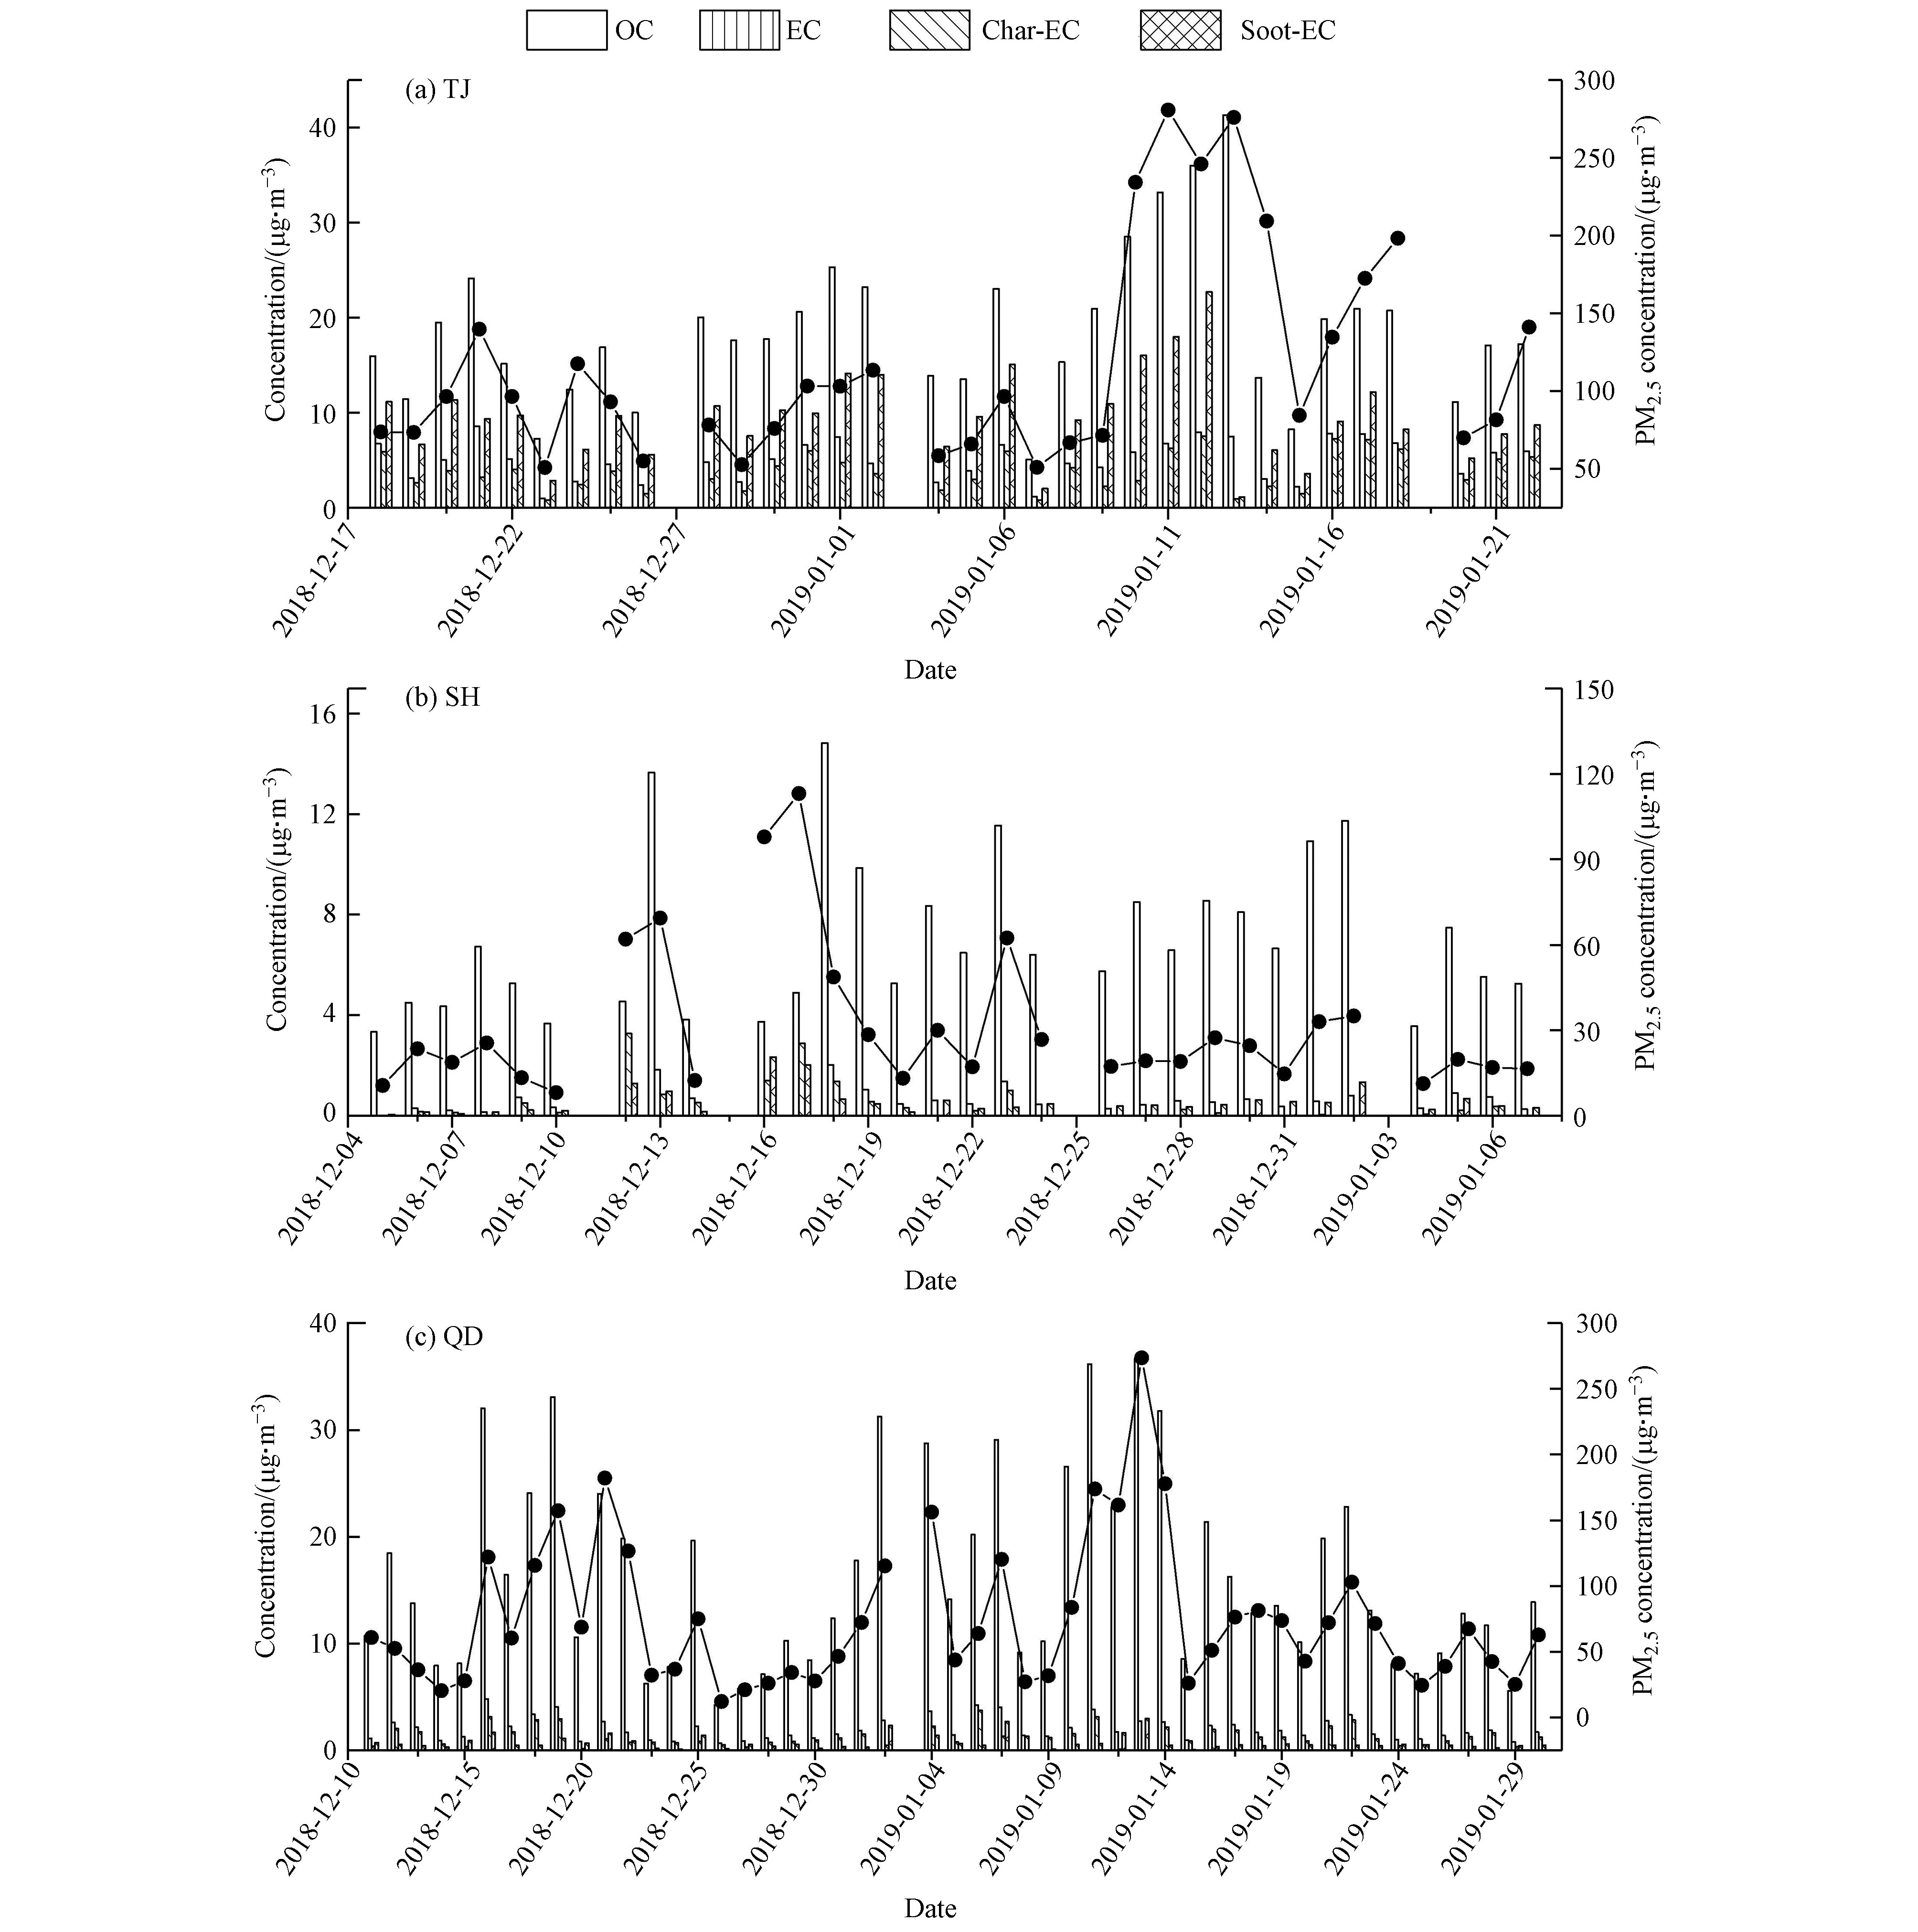
图 1 中国三个典型城市PM2.5及碳组分浓度逐日变化
Figure 1. Temporal variations of PM2.5, OC, EC, Char-EC and Soot-EC mass concentrations in three typical cities of China
-
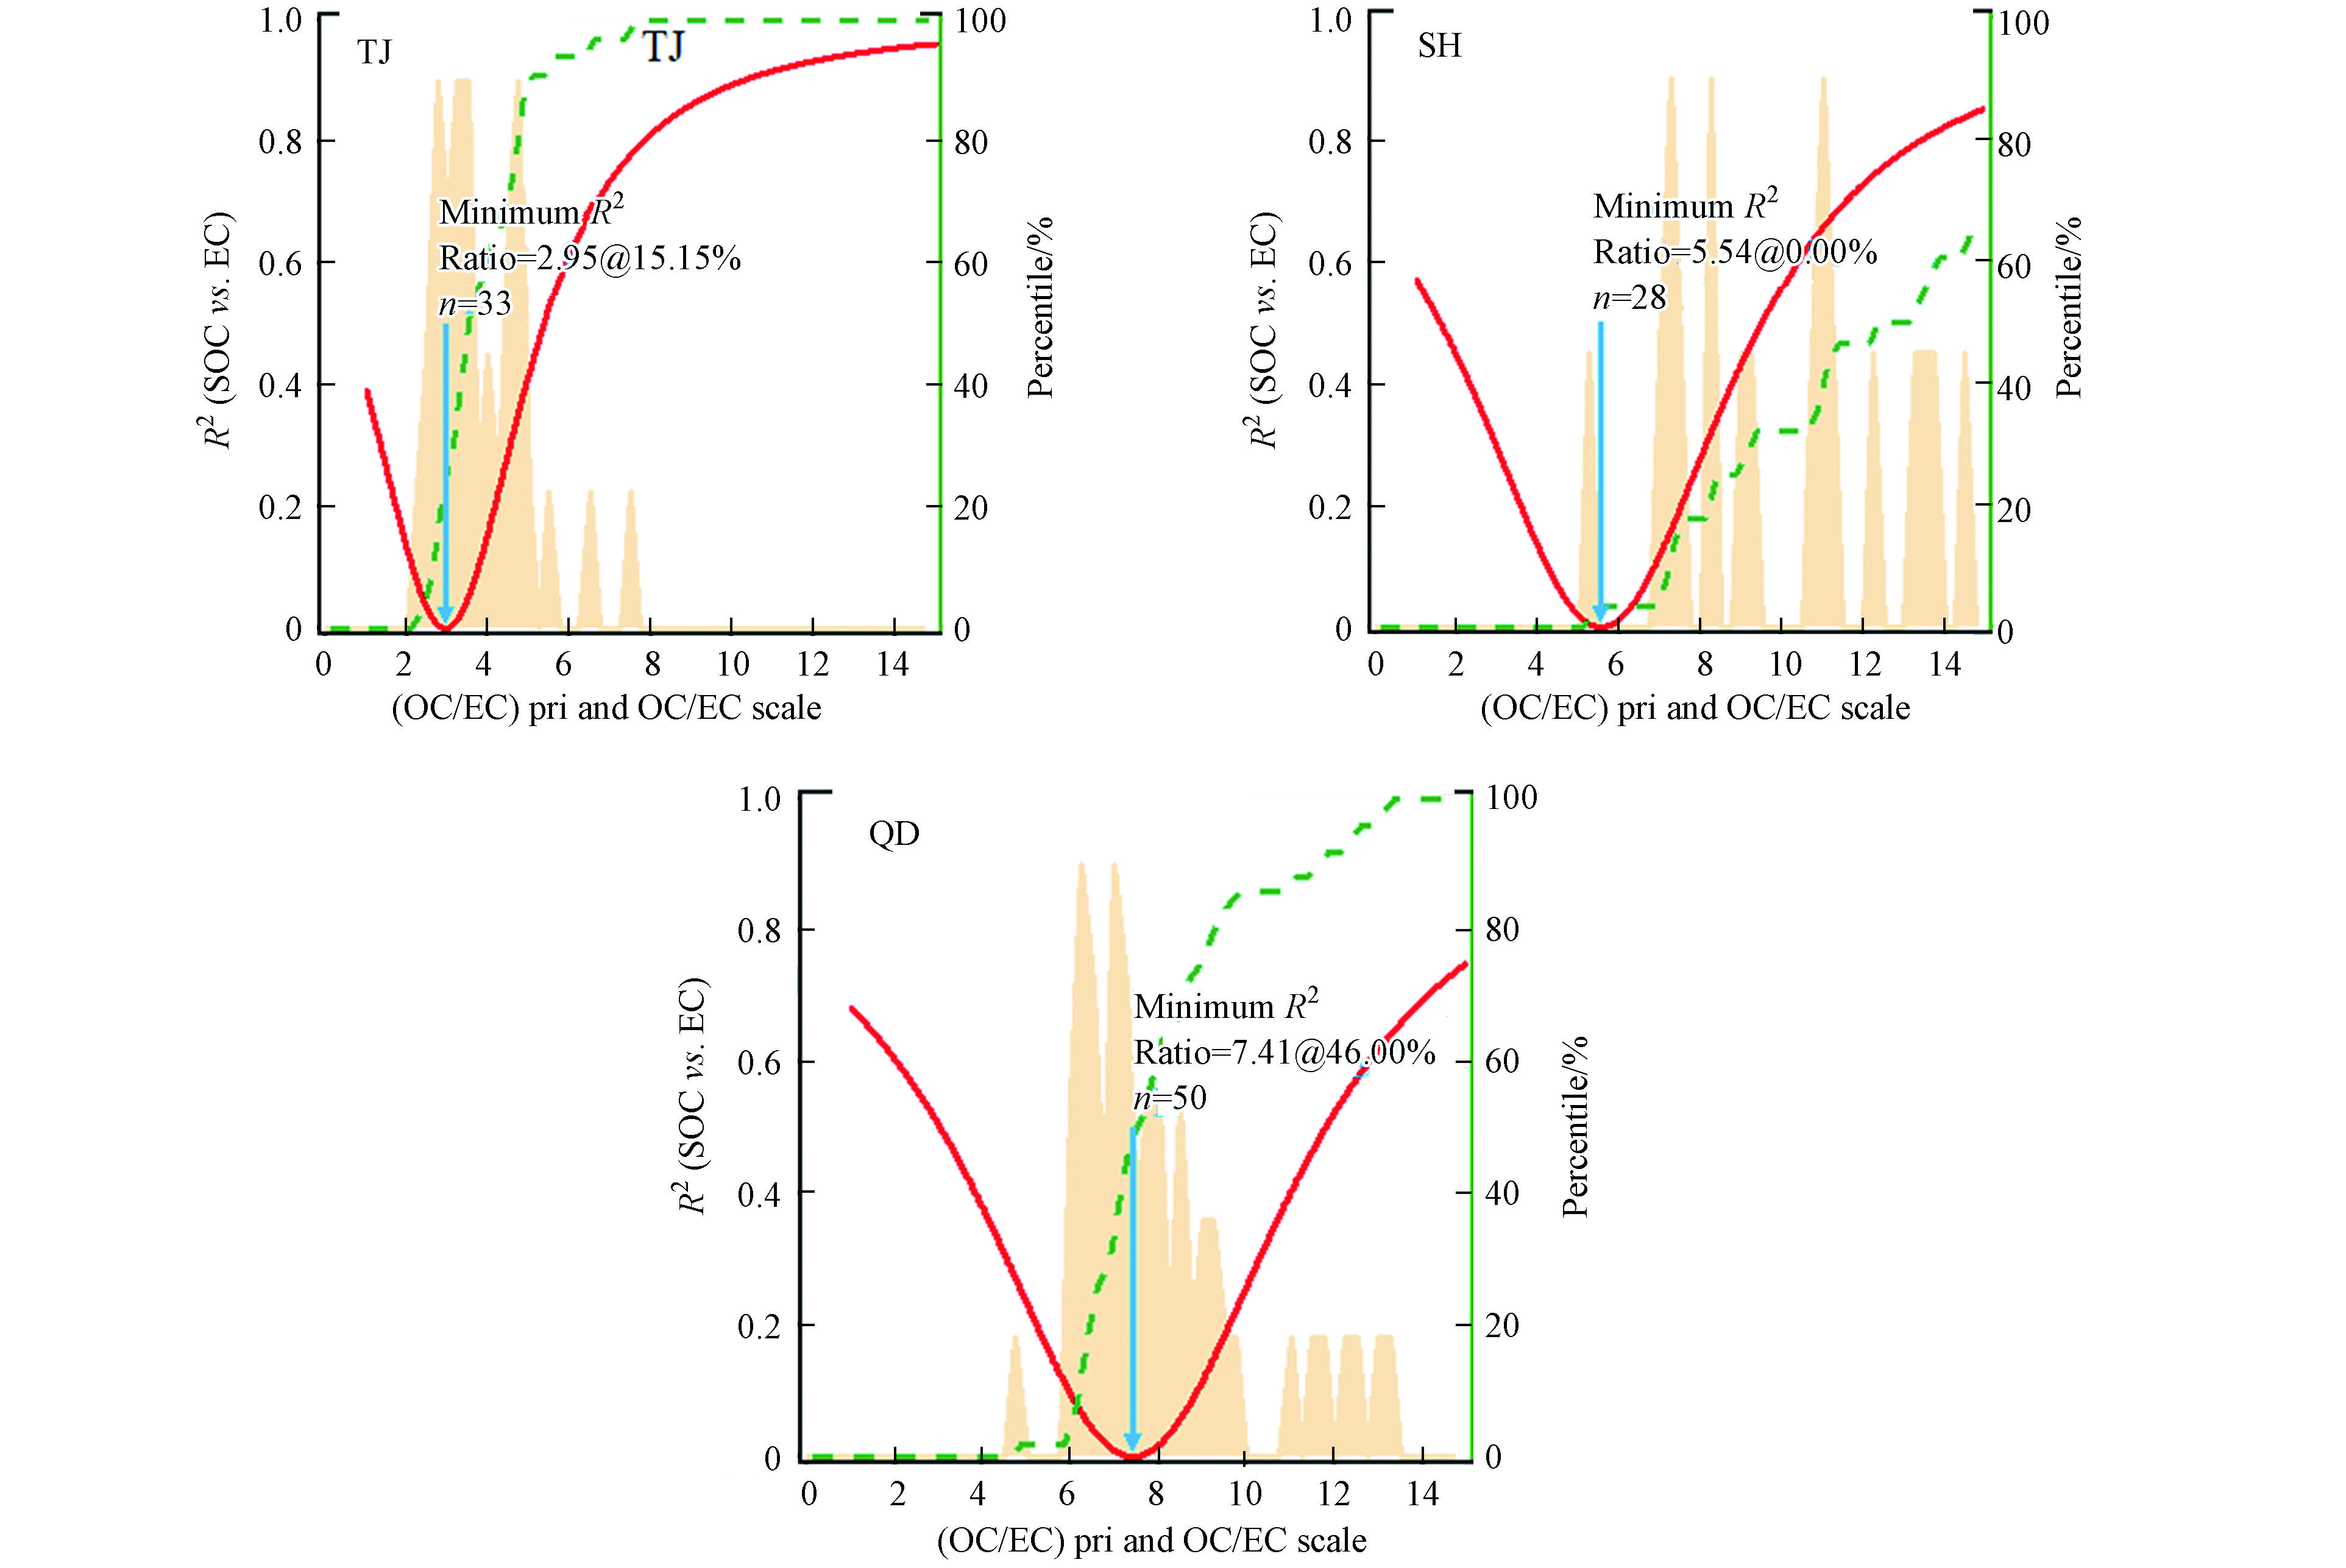
图 2 MRS方法计算 (OC/EC) pri
Figure 2. MRS method calculation (OC/EC) pri
-
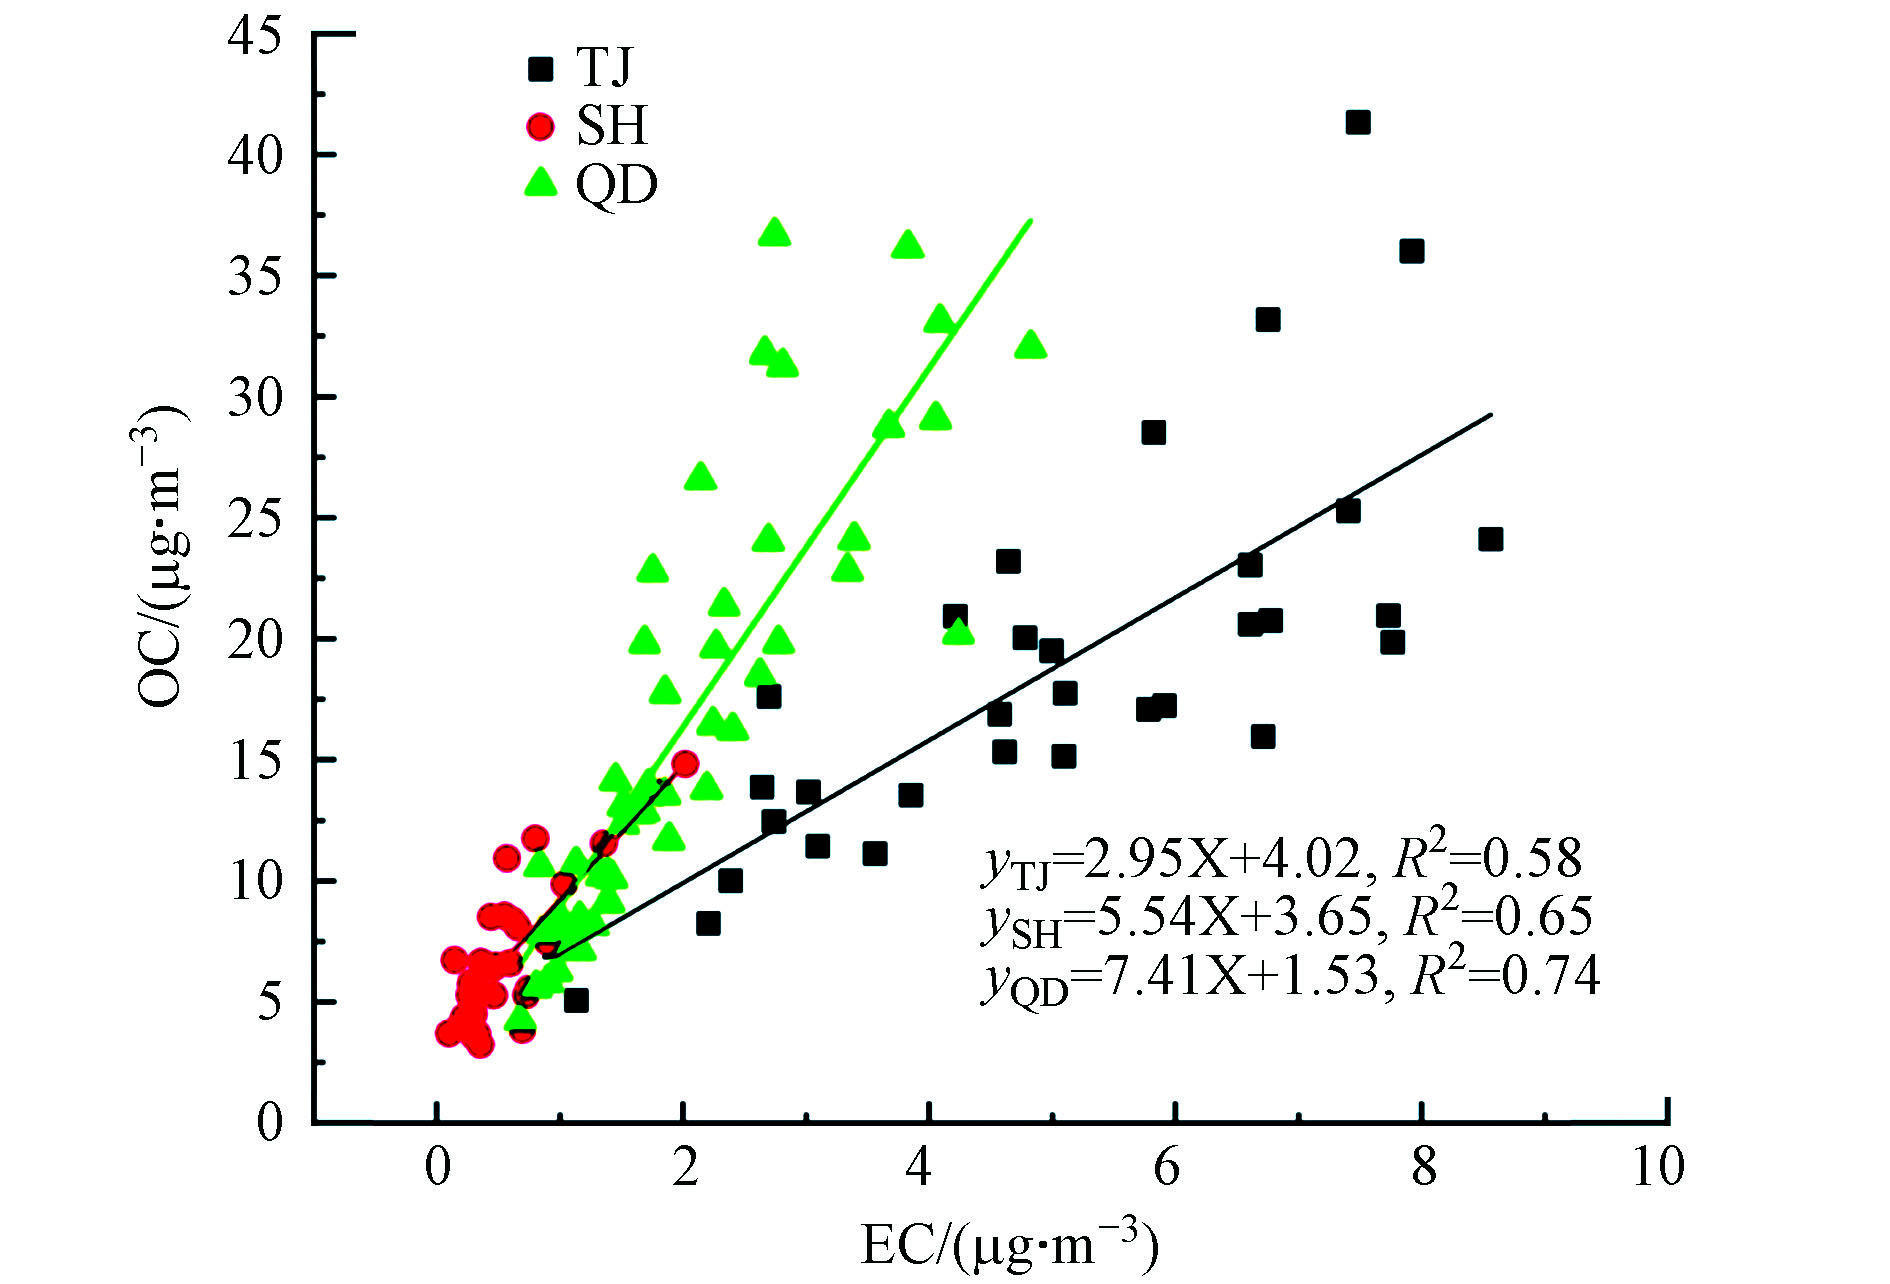
图 3 OC与EC相关性
Figure 3. Correlation between OC and EC
-
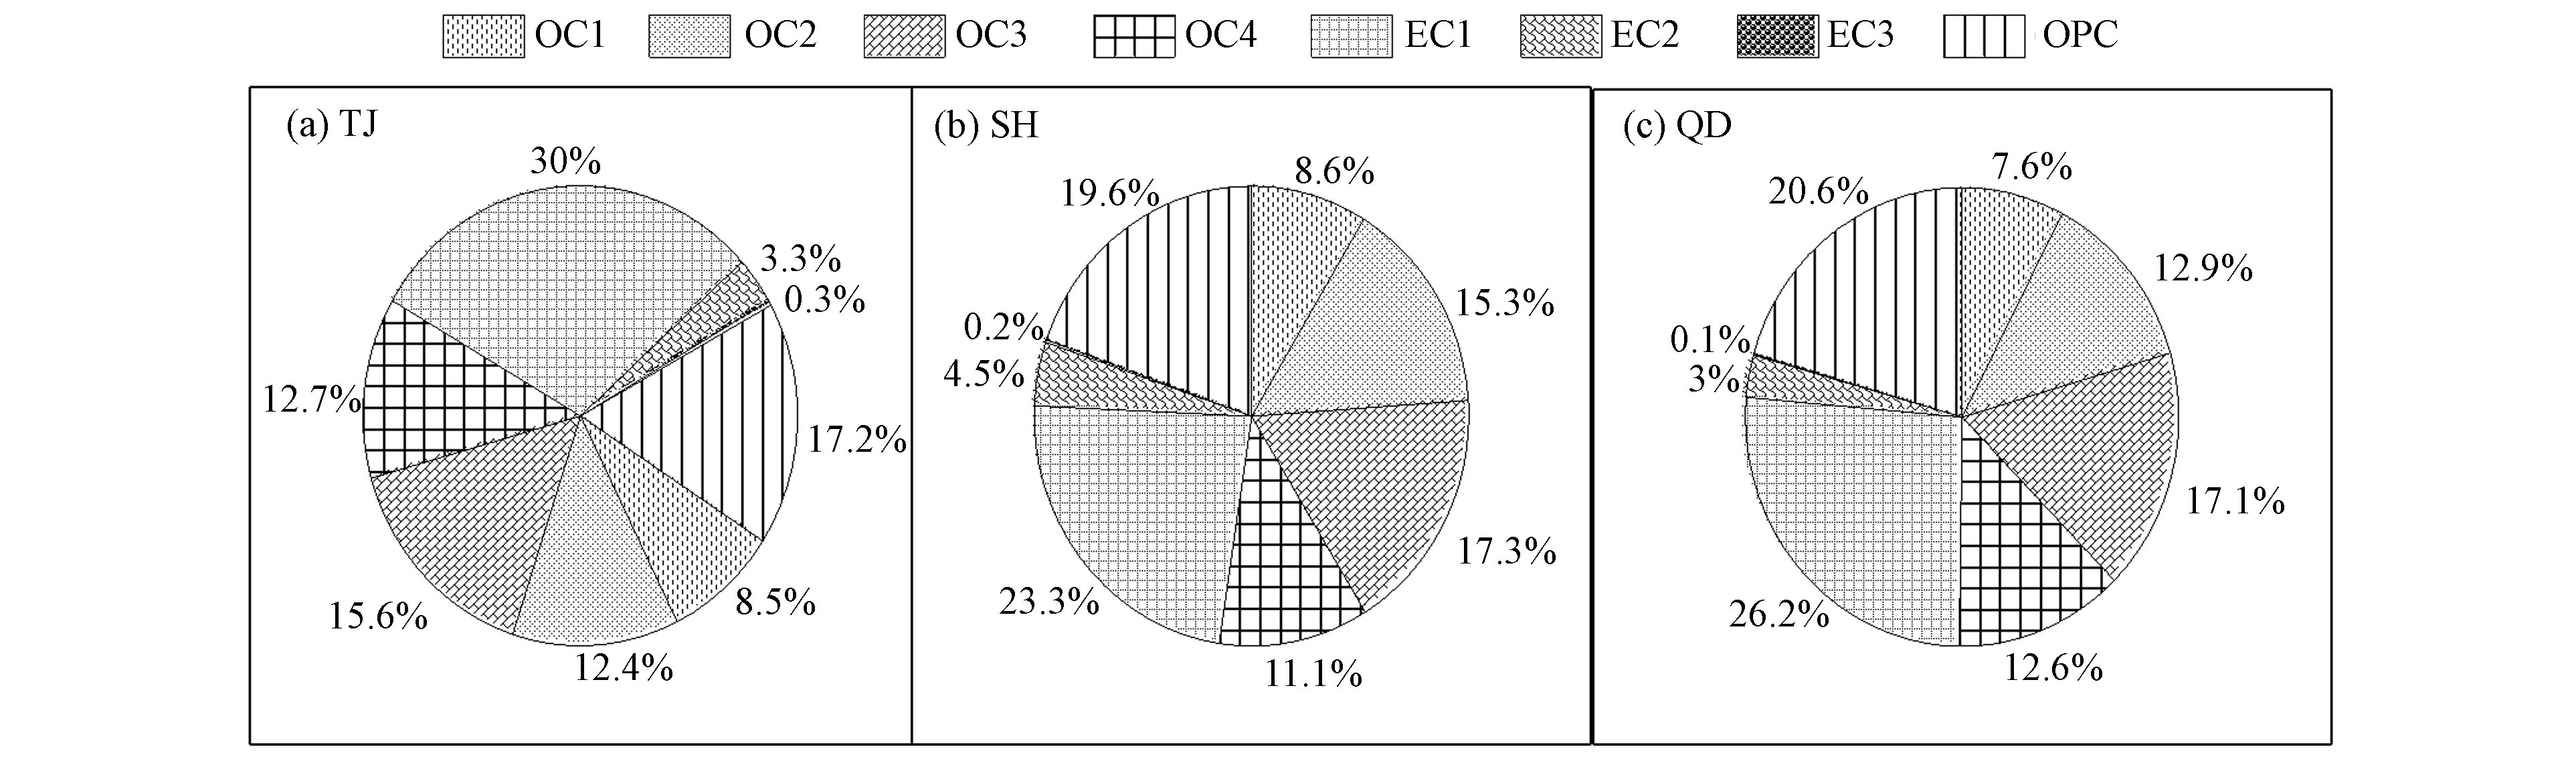
图 4 中国典型城市冬季PM2.5中8个碳组分的丰度
Figure 4. abundance of 8 carbon components in winter PM2.5 of typical Chinese cities
-
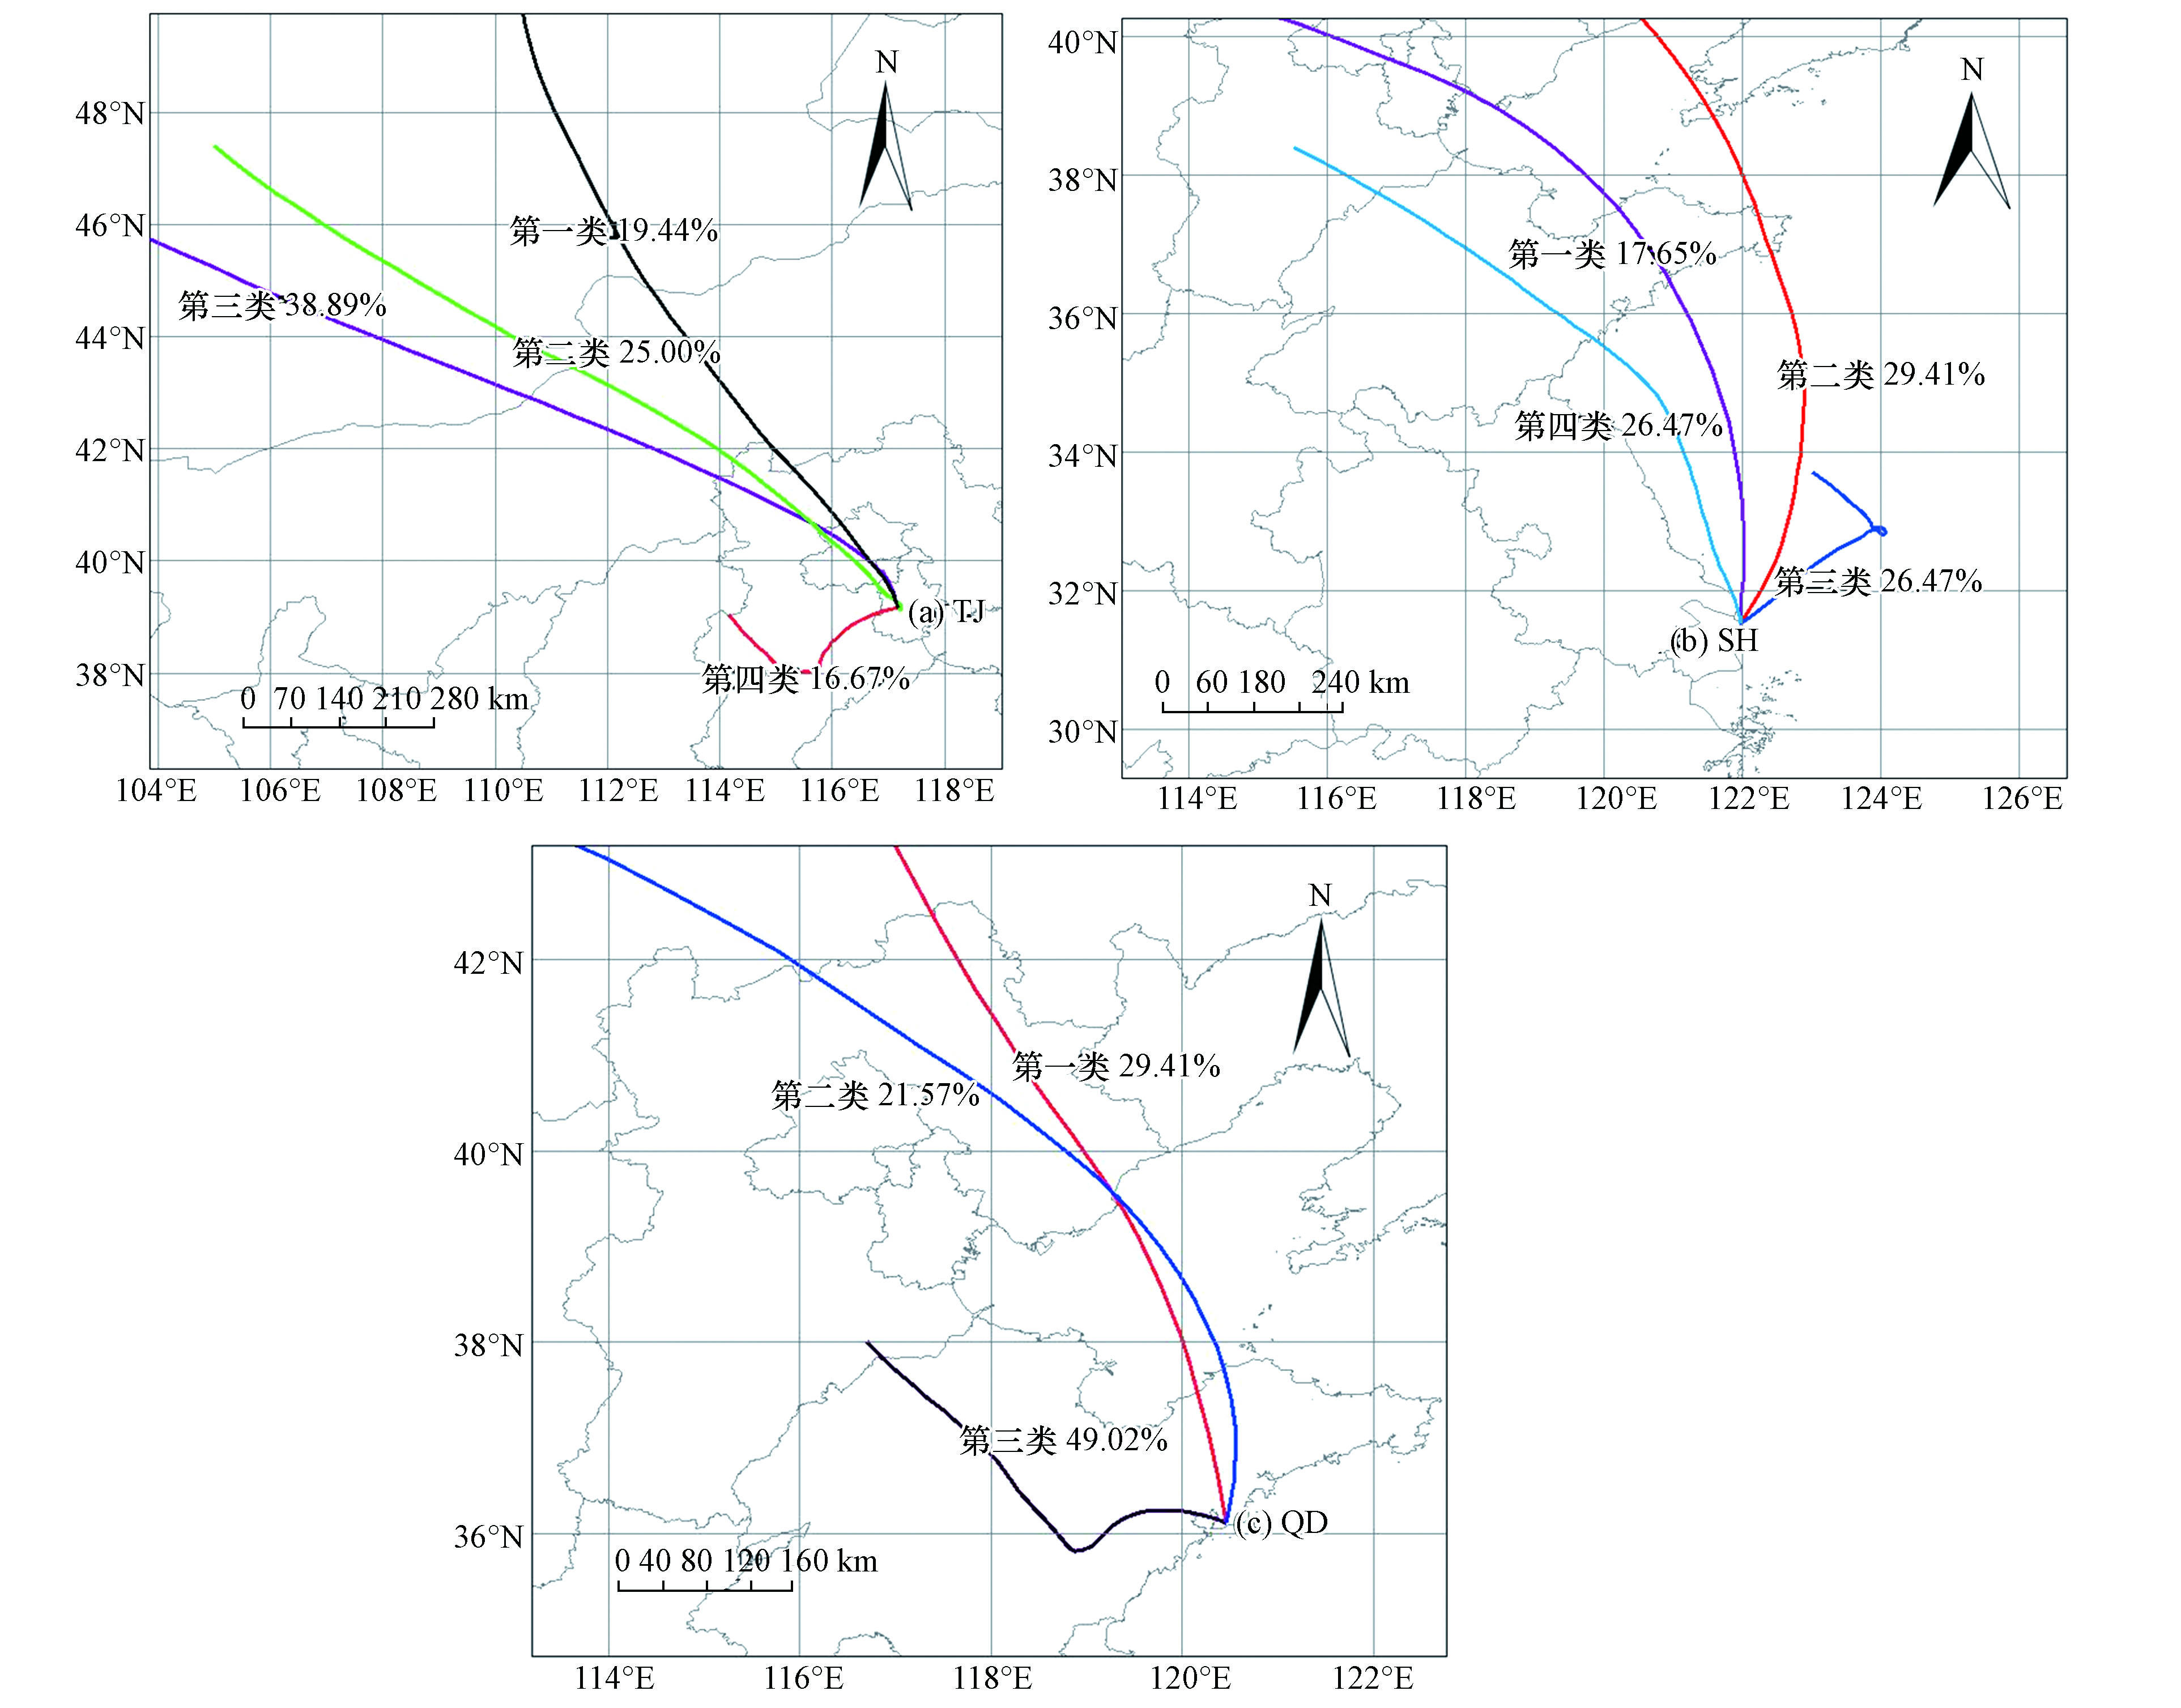
图 5 3个城市48 h后向轨迹图
Figure 5. 48 h backward trajectory map of typical coastal cities in China
Figure
5 ,Table
4 个