-
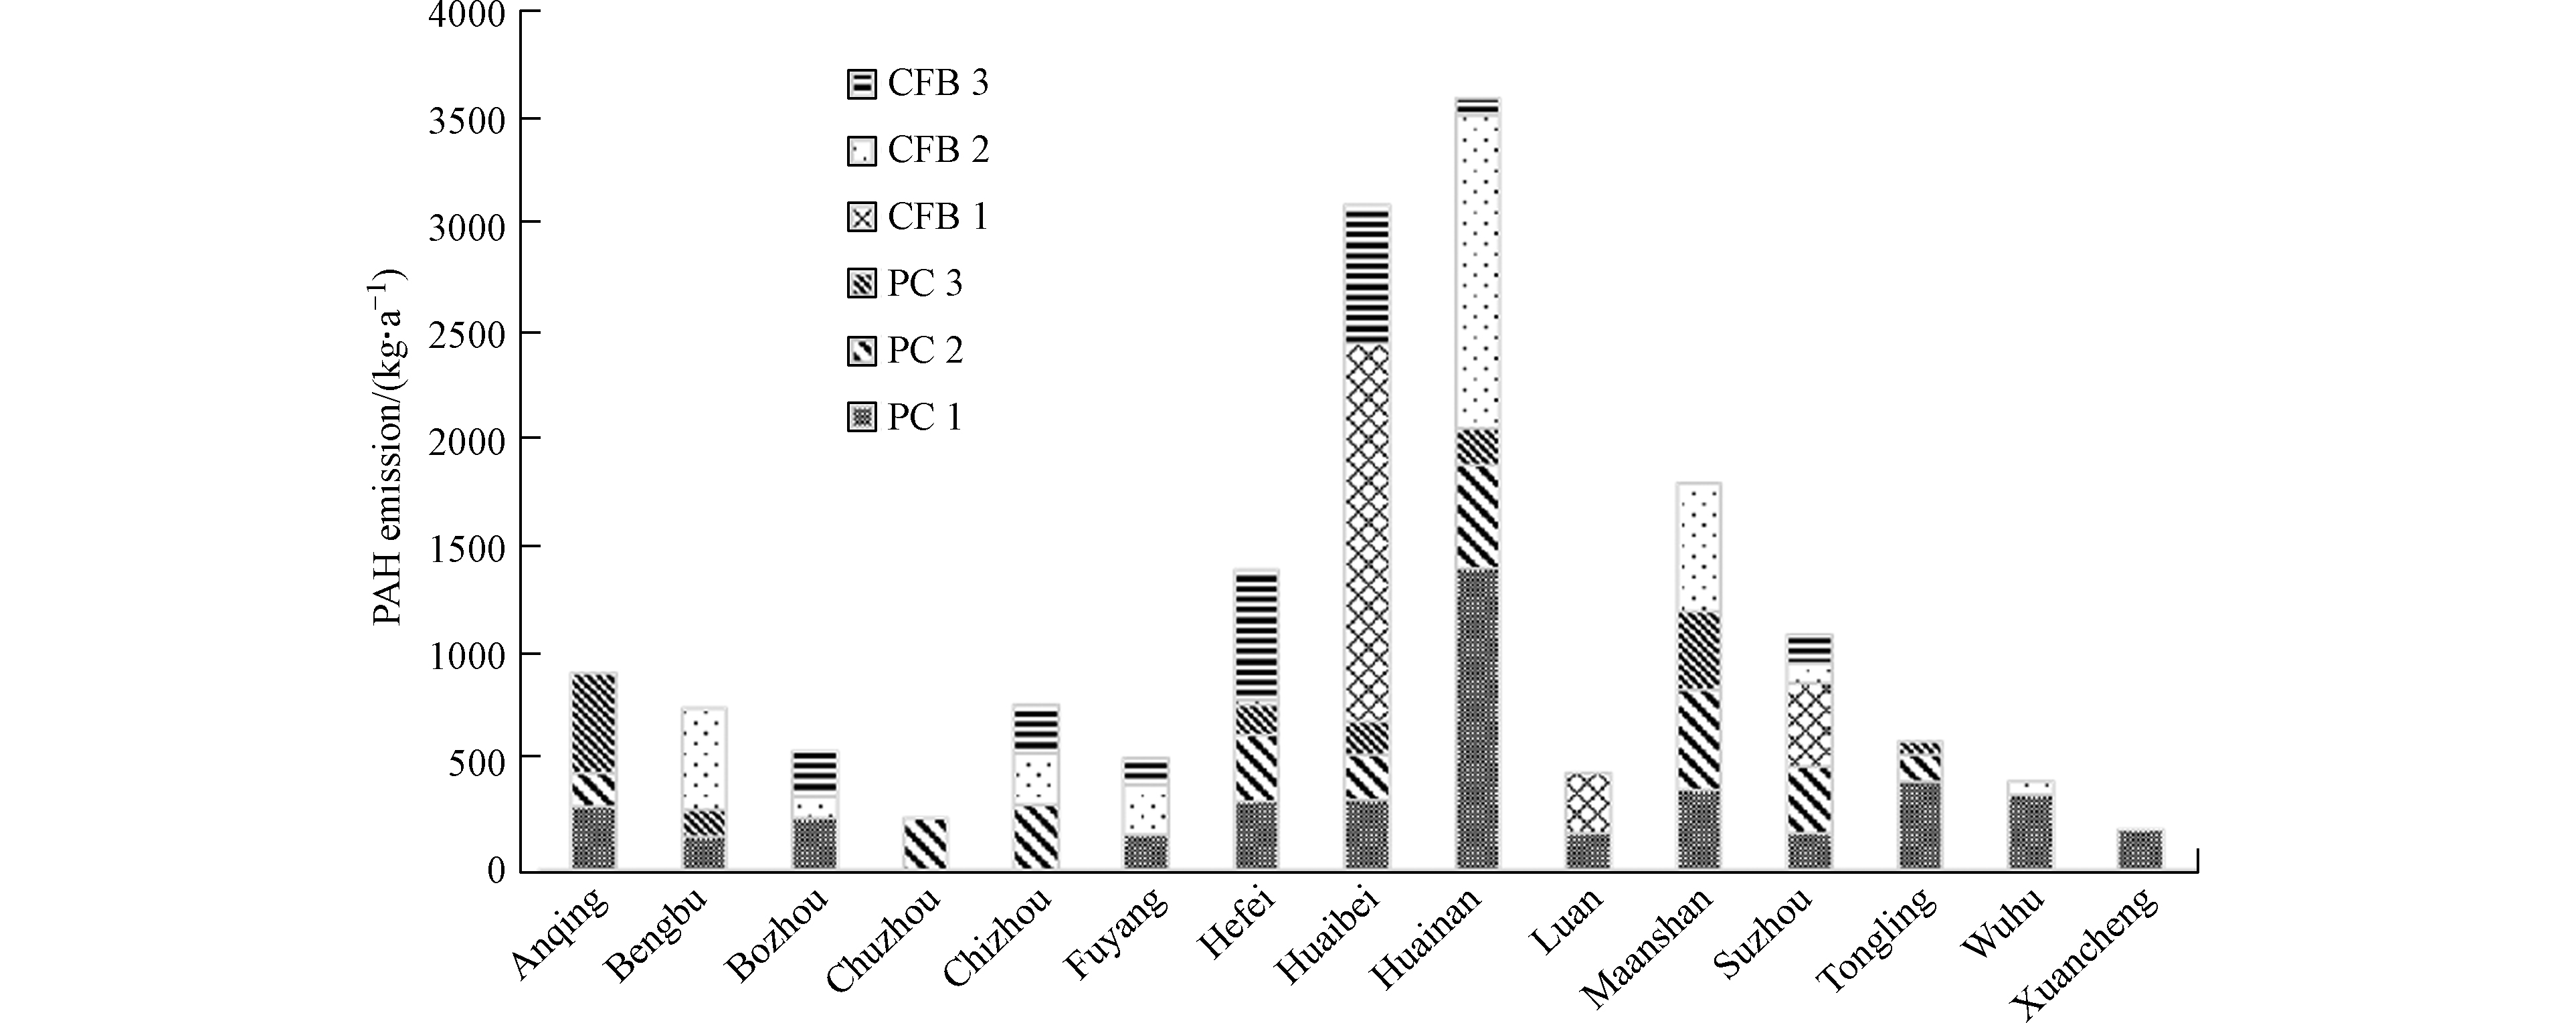
图 1 2017年安徽不同城市燃煤电厂PAHs的排放量
Figure 1. The PAH emission amounts from coal-fired power plants in different cities of Anhui province in 2017
-
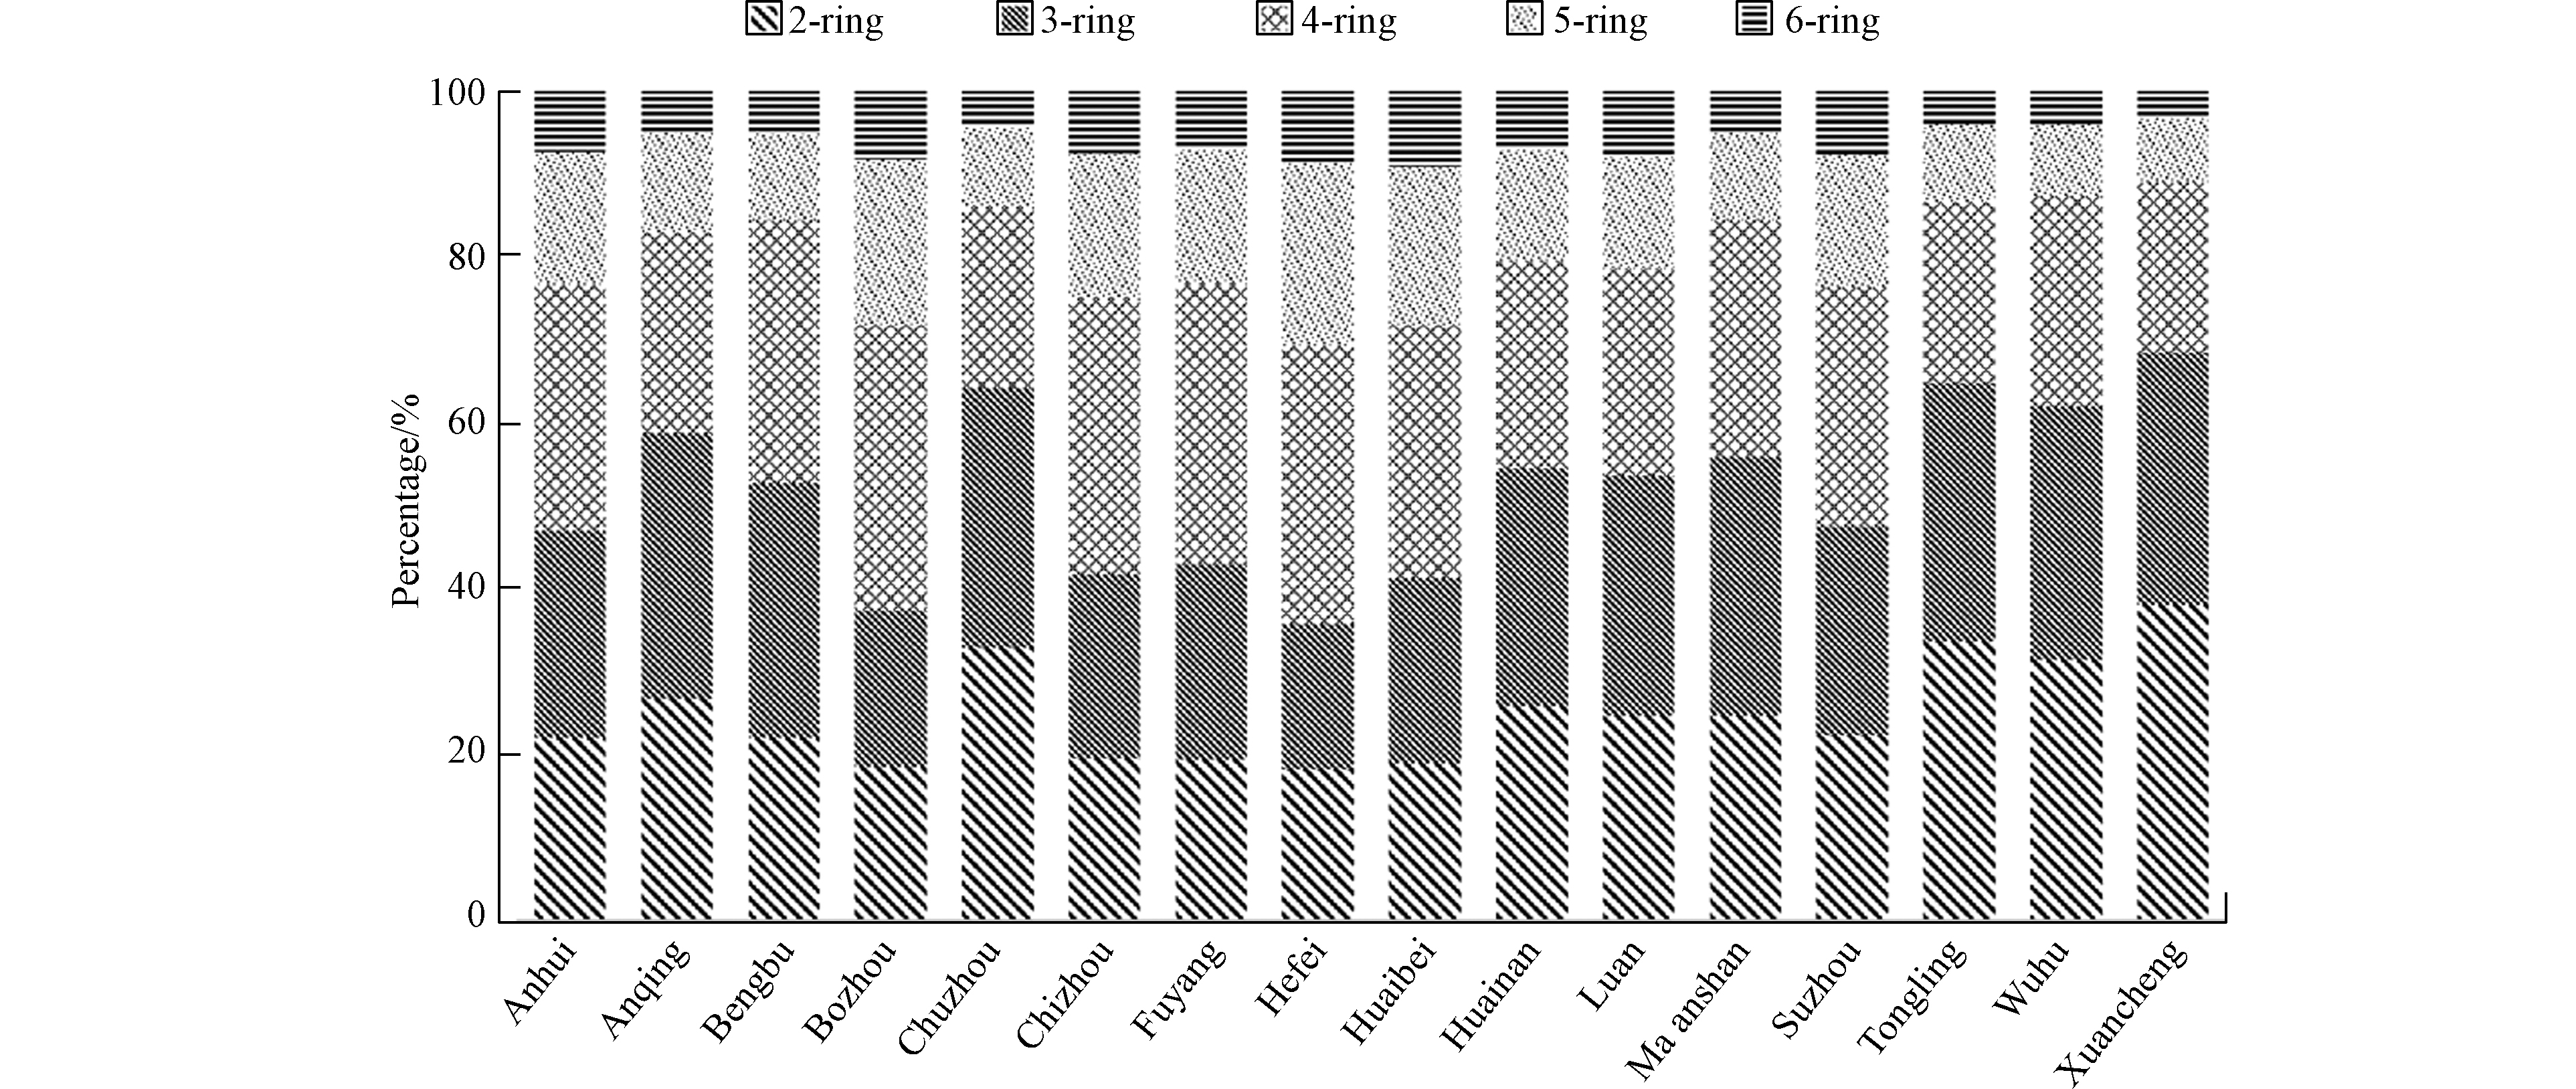
图 2 2017年安徽各城市燃煤电厂排放PAHs的组成特征
Figure 2. PAH compositions emitted from coal-fired power plants in different cities of Anhui
-
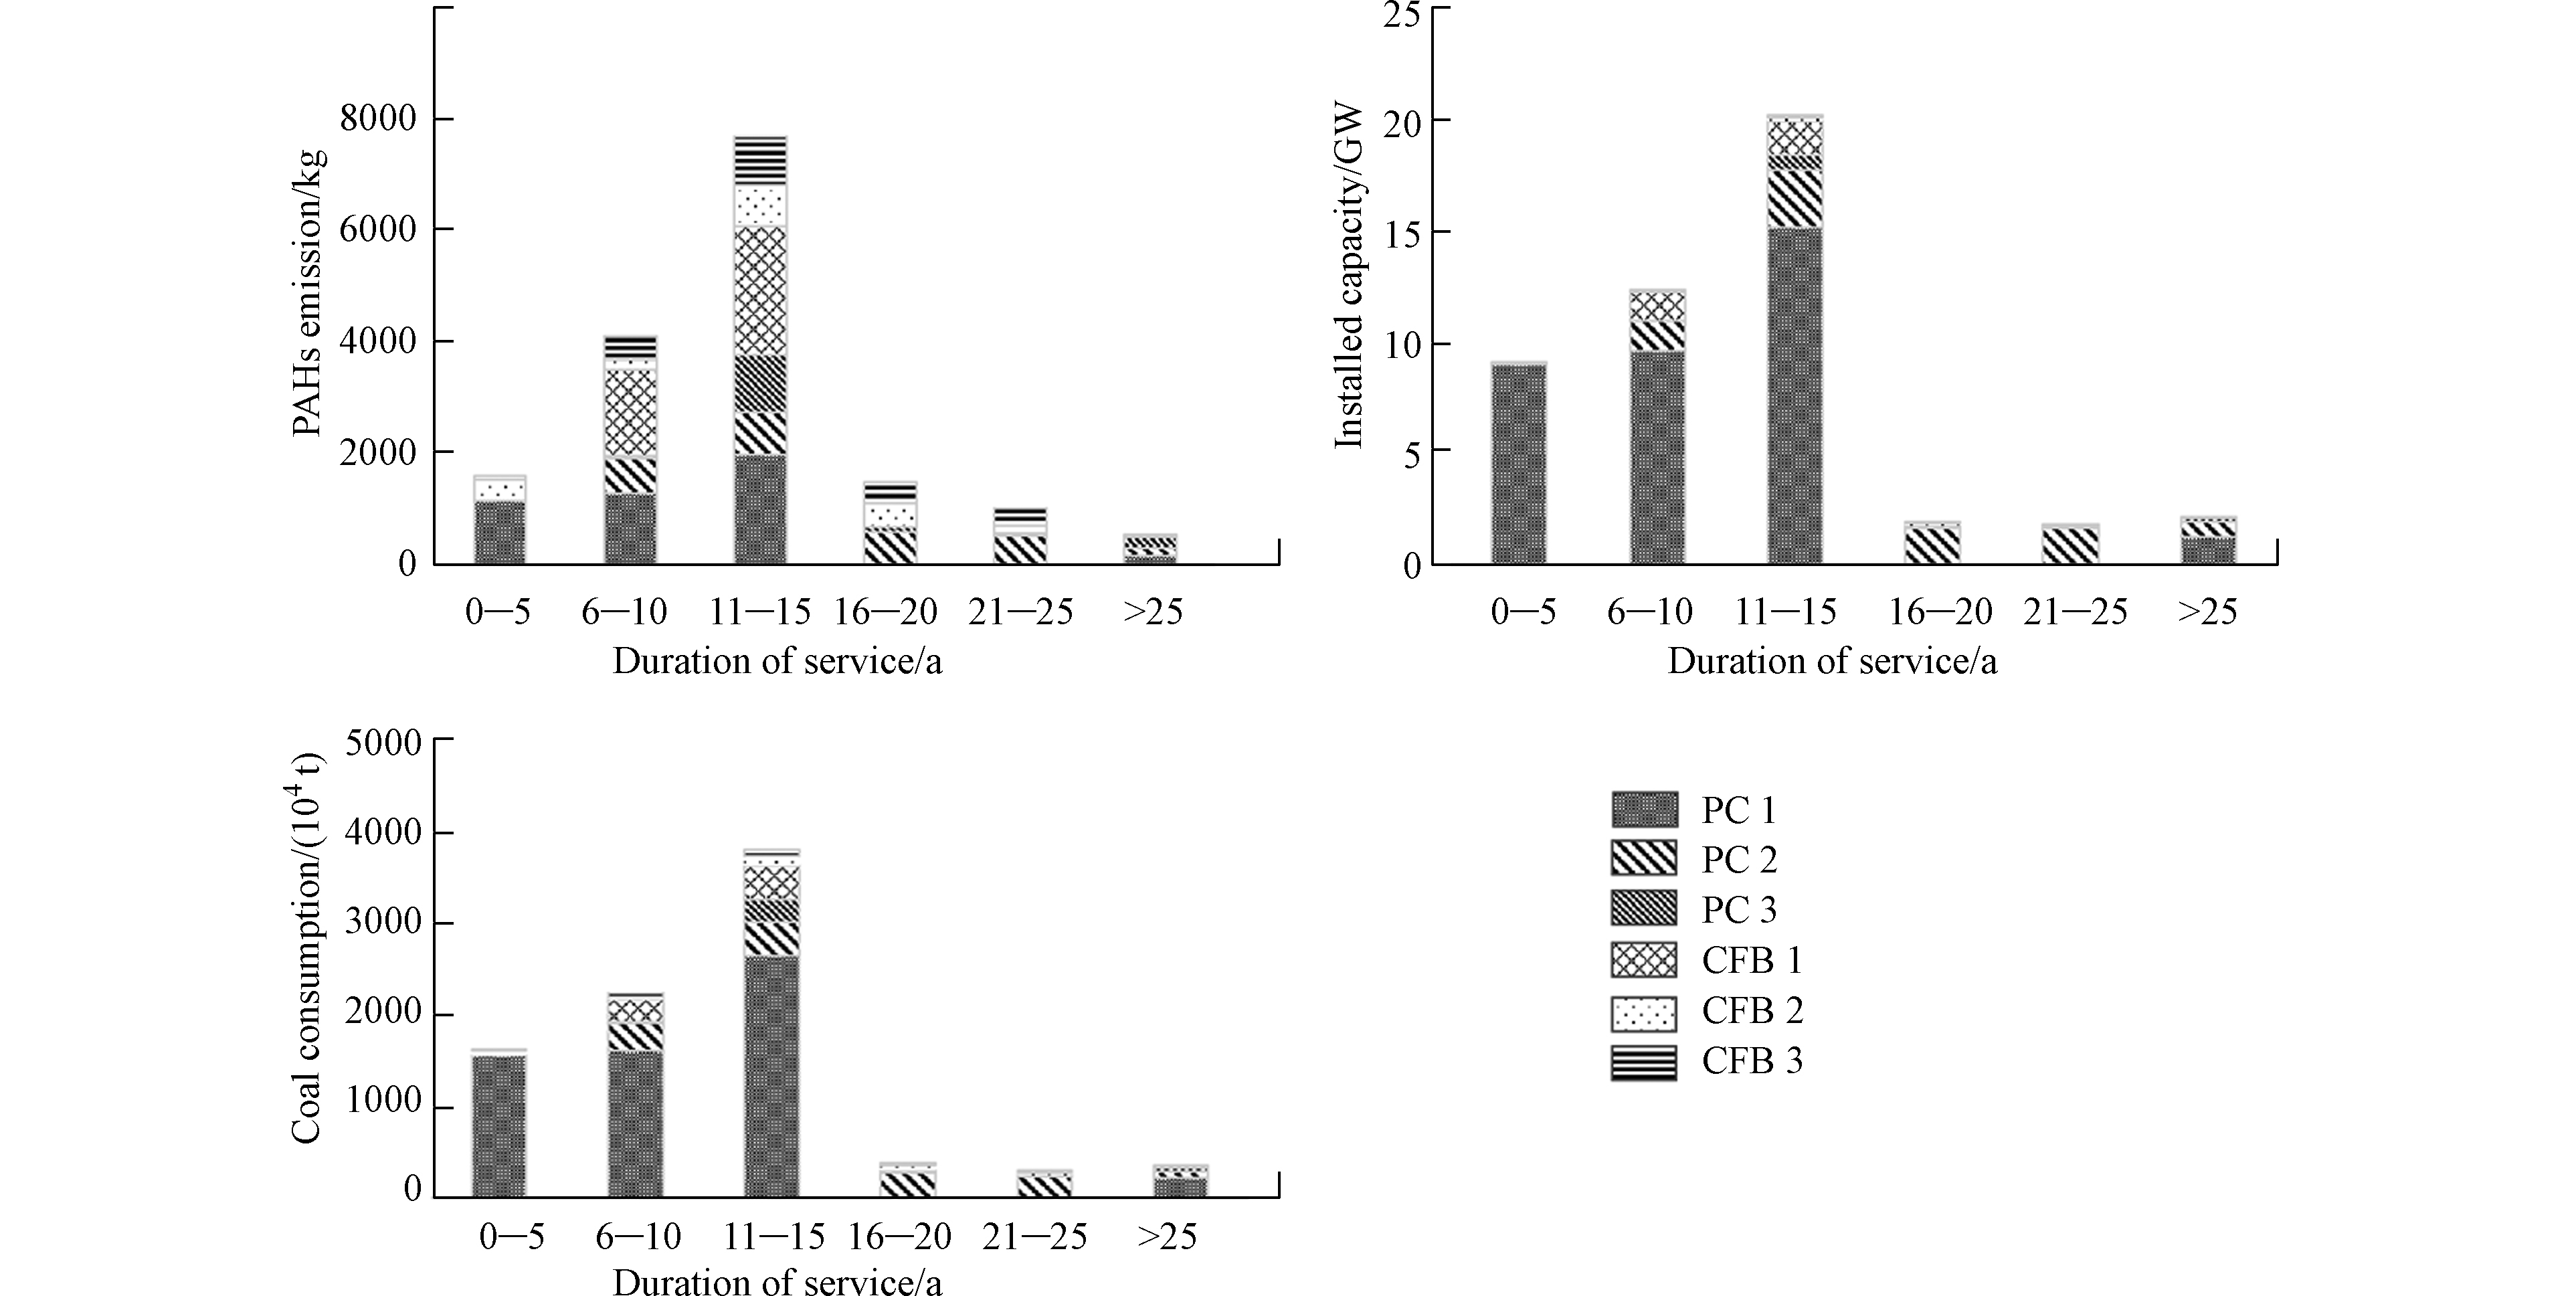
图 3 不同年龄的燃煤锅炉机组PAHs大气排放量、装机容量、煤炭消费量的相对比值
Figure 3. Percentages of PAH emissions, installed capacities, and coal consumptions among different age of coal-fired units
-
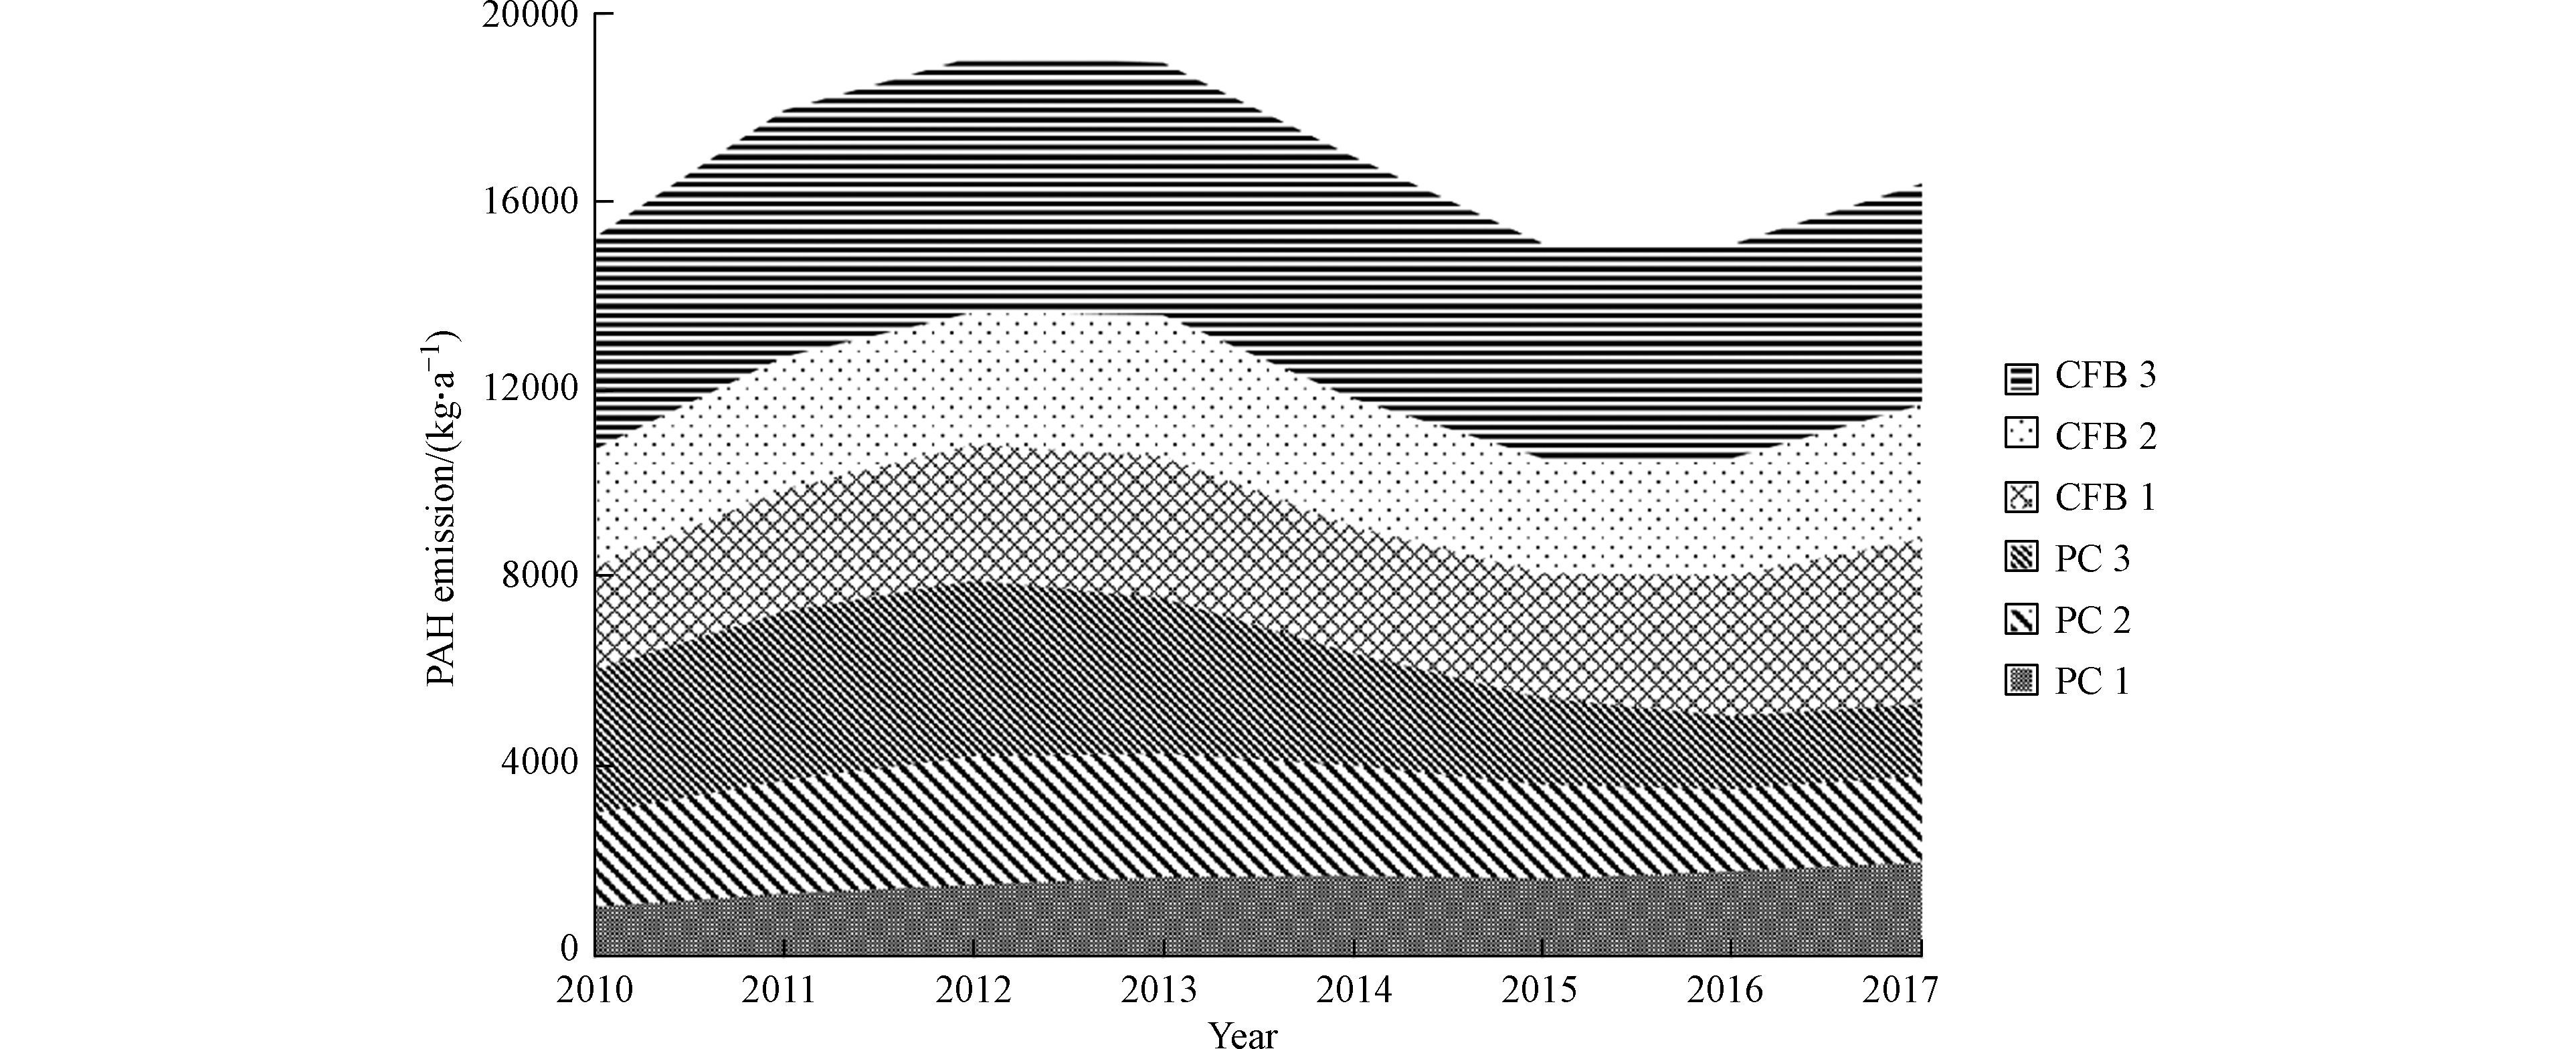
图 4 安徽燃煤电厂不同锅炉2010—2017年大气PAHs的历史排放通量
Figure 4. The historical PAH emission amounts from Anhui’s coal-fired power plants of different coal-fired units between 2010-2017
-
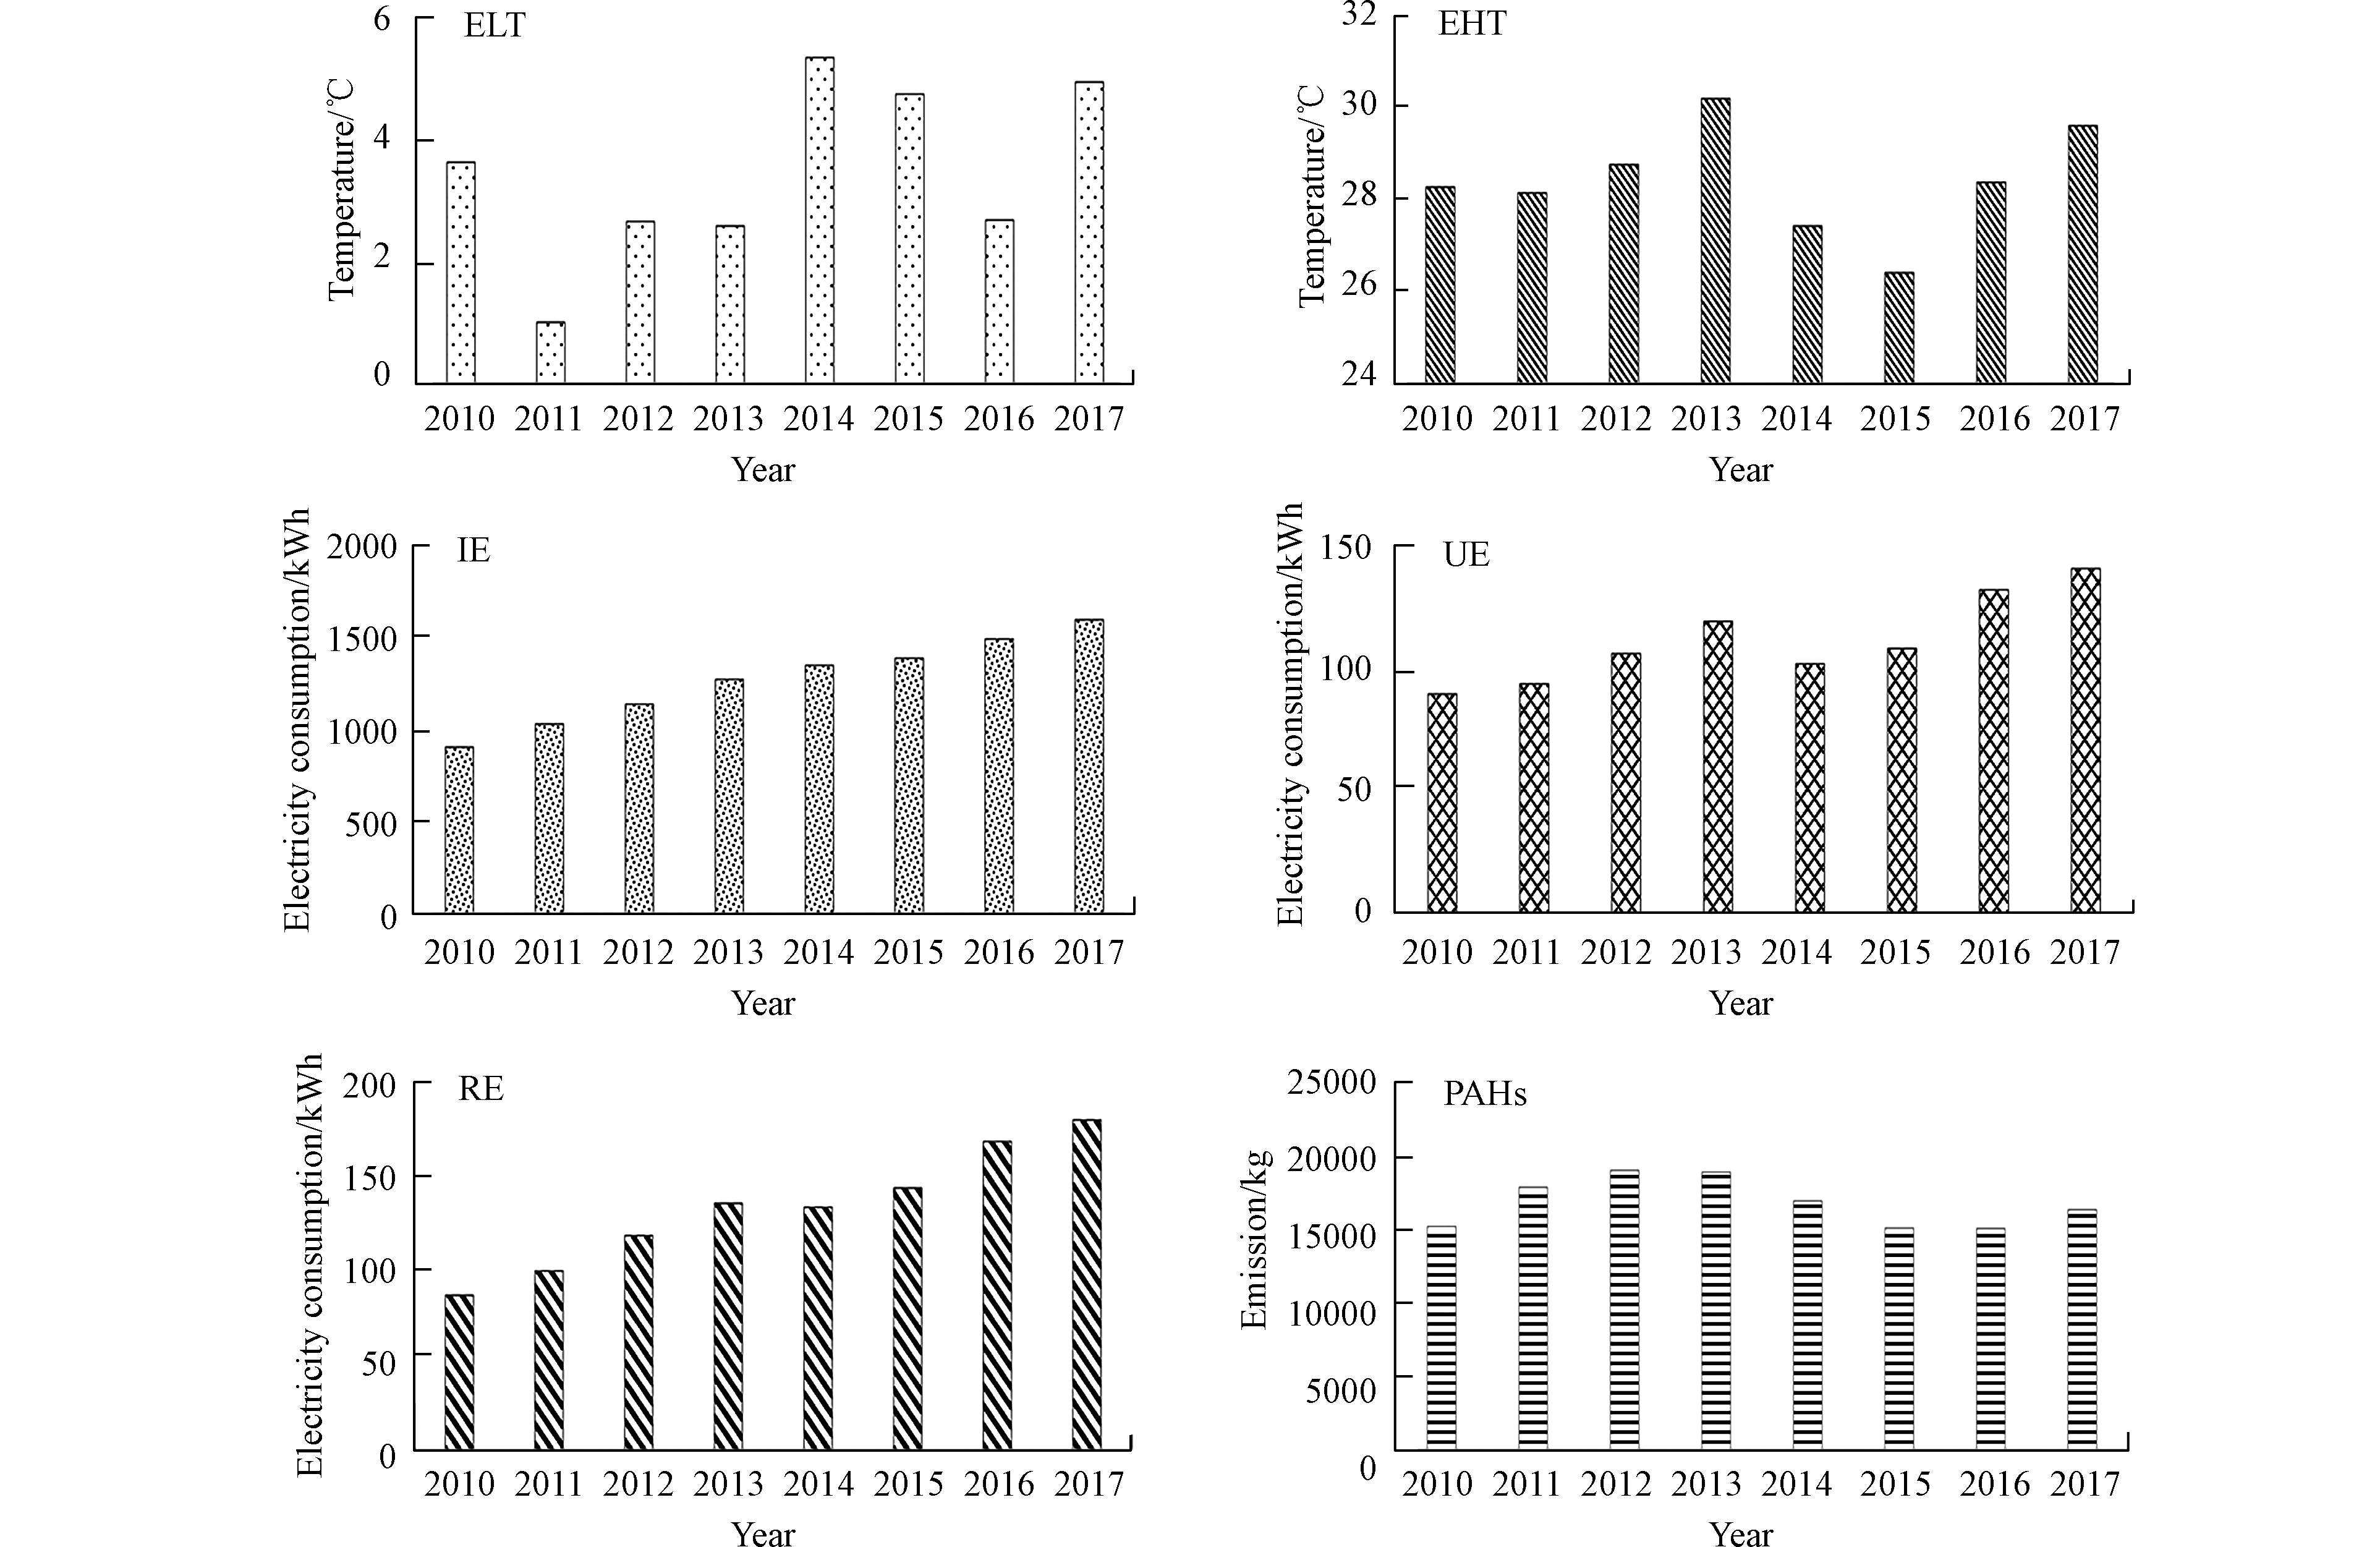
图 5 2010—2017年PAHs年排放量(PAHs)、居民用电量(RE)、城市用电量(UE)、工业用电量(IE)、高温值(EHT)、低温值(ELT)的lg值变化
Figure 5. The logarithmic values of PAH emissions (PAHs), resident electricity consumption (RE), urban electricity consumption (UE), industry-wide electricity consumption (IE), extreme high temperature (EHT), and extreme low temperature (ELT) from 2010 to 2017 in Anhui
Figure
5 ,Table
2 个