-
-
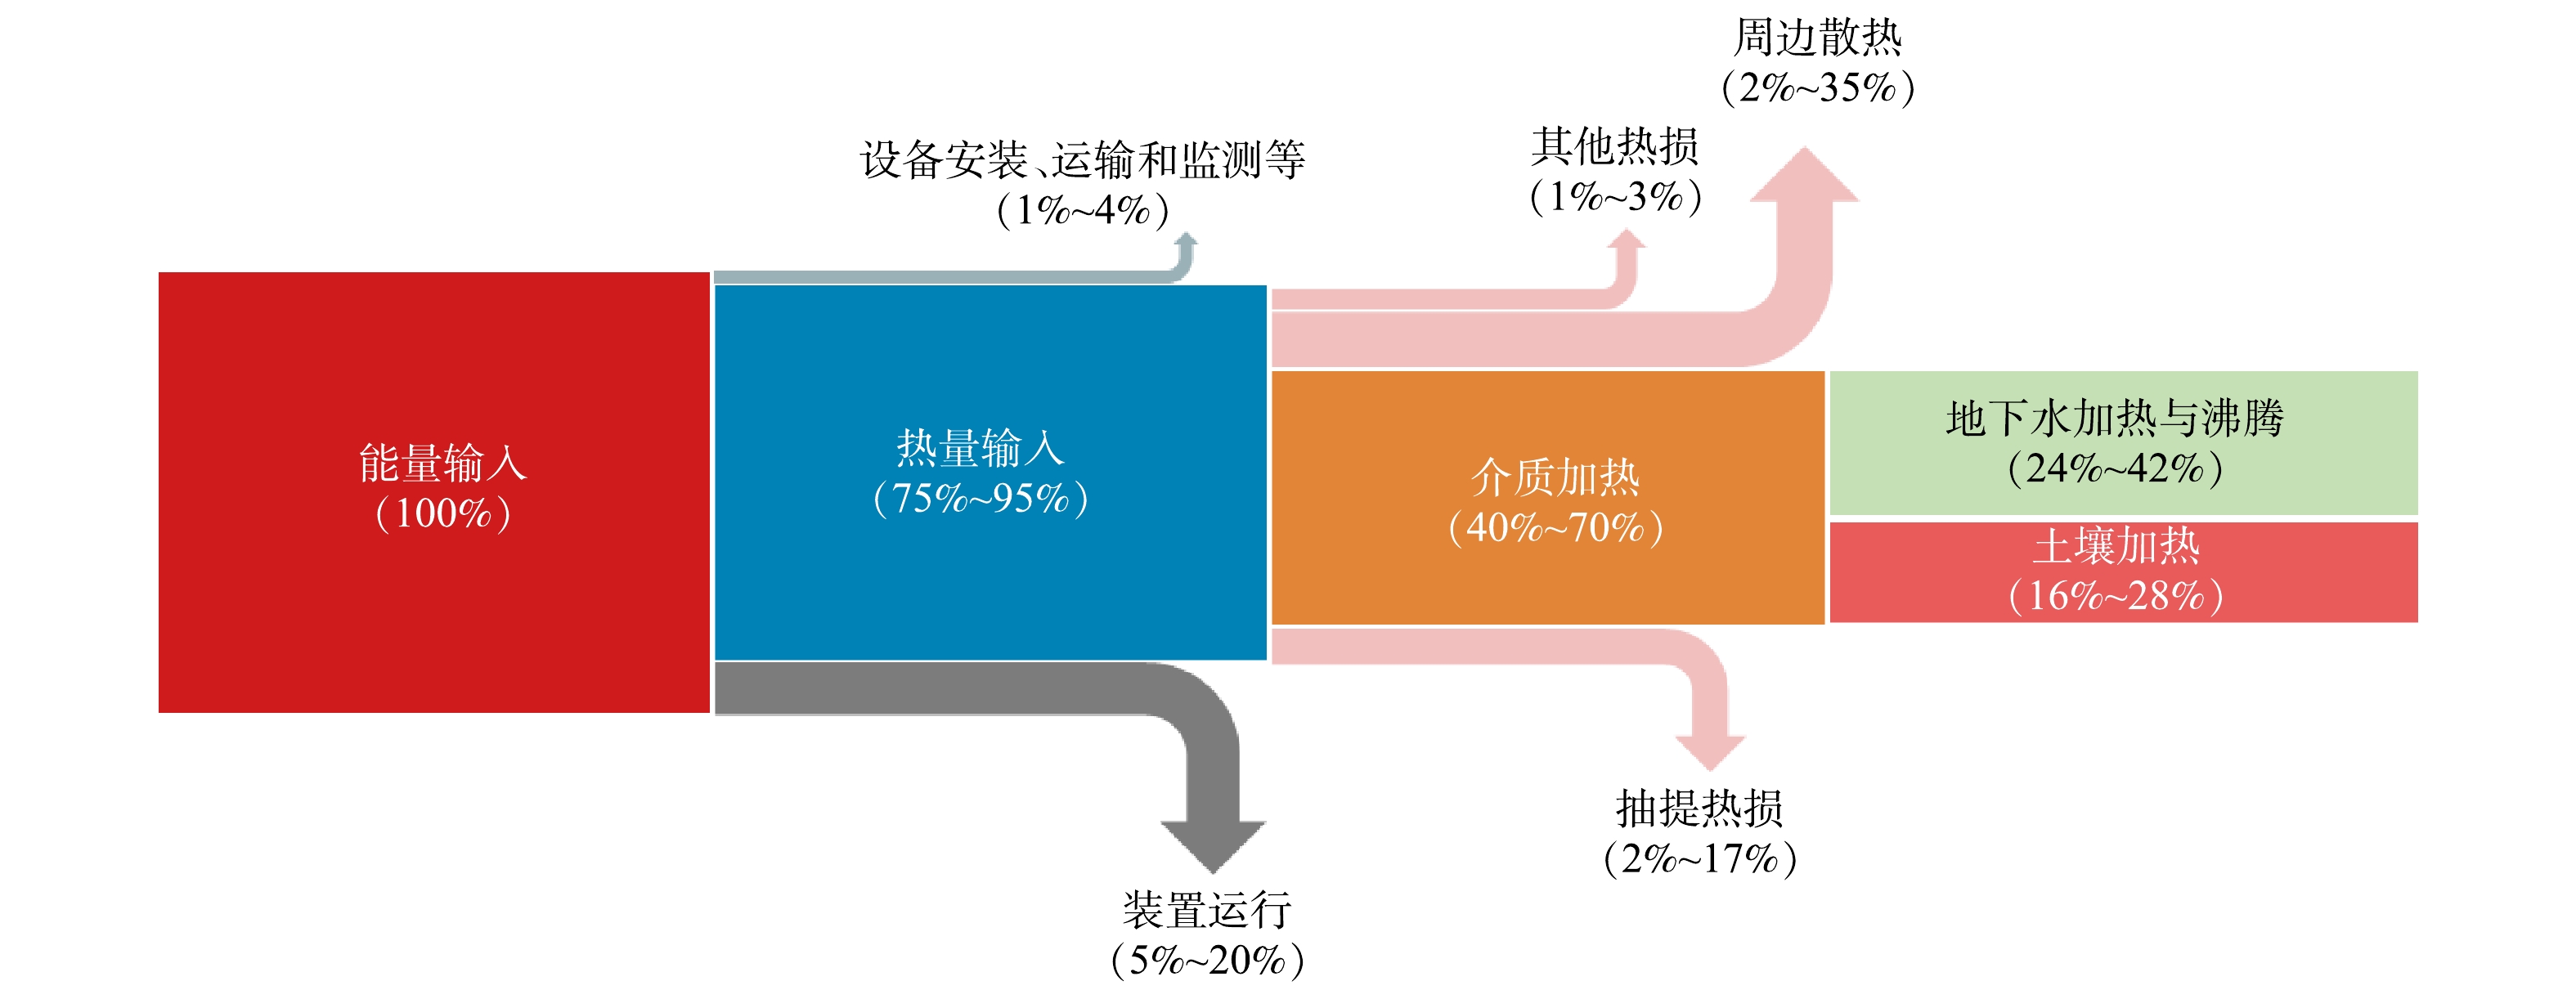
图 2 原位热处理过程的能流图
Figure 2. Energy flow during in-situ thermal treatment
-
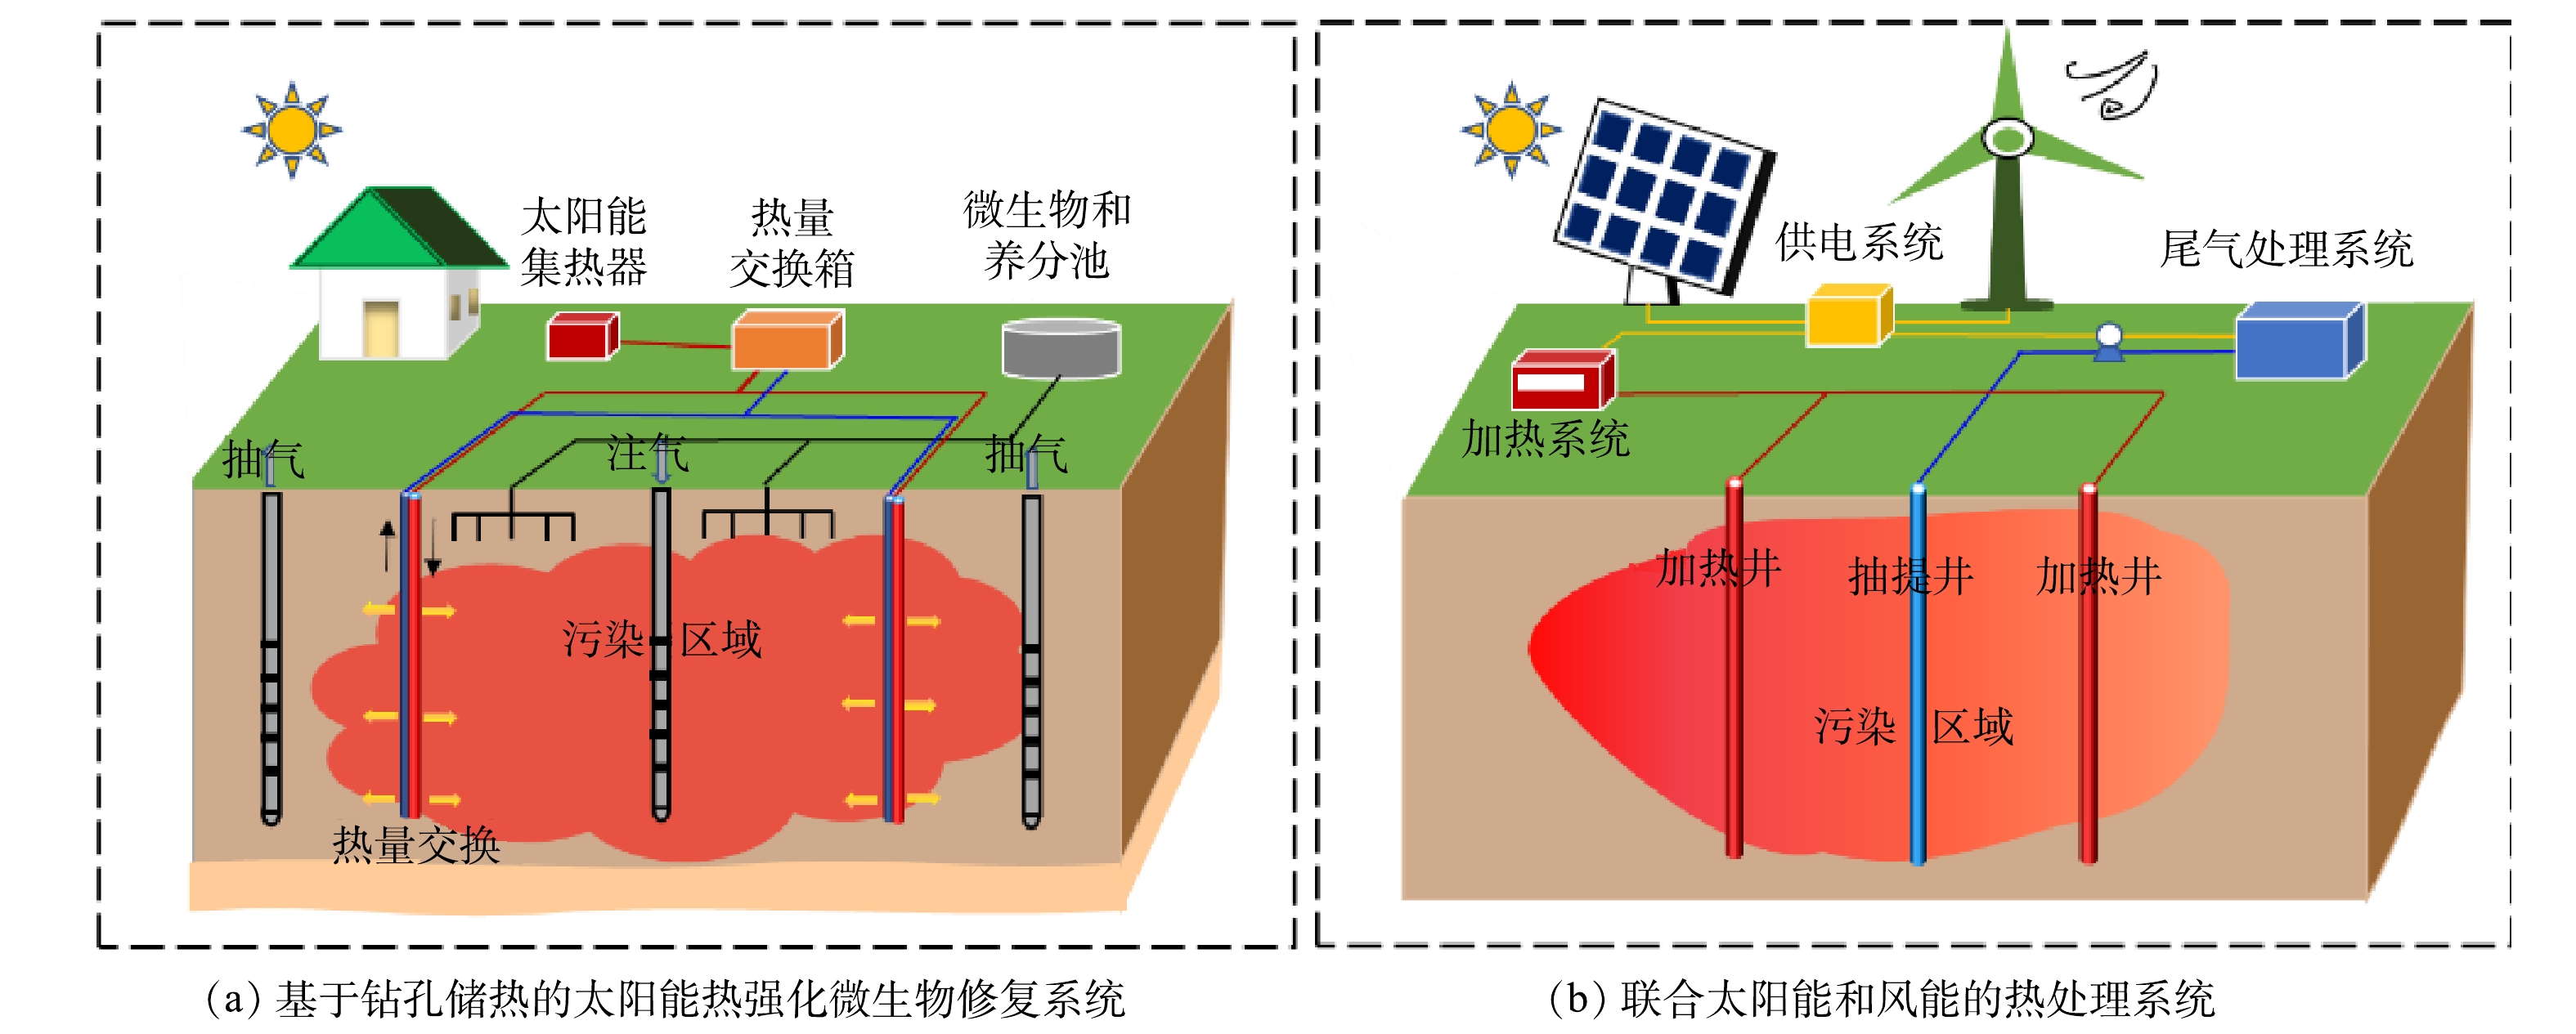
图 3 可再生能源在ISTT中应用的概念模型
Figure 3. Conceptual model for the application of renewable energy in ISTT
-
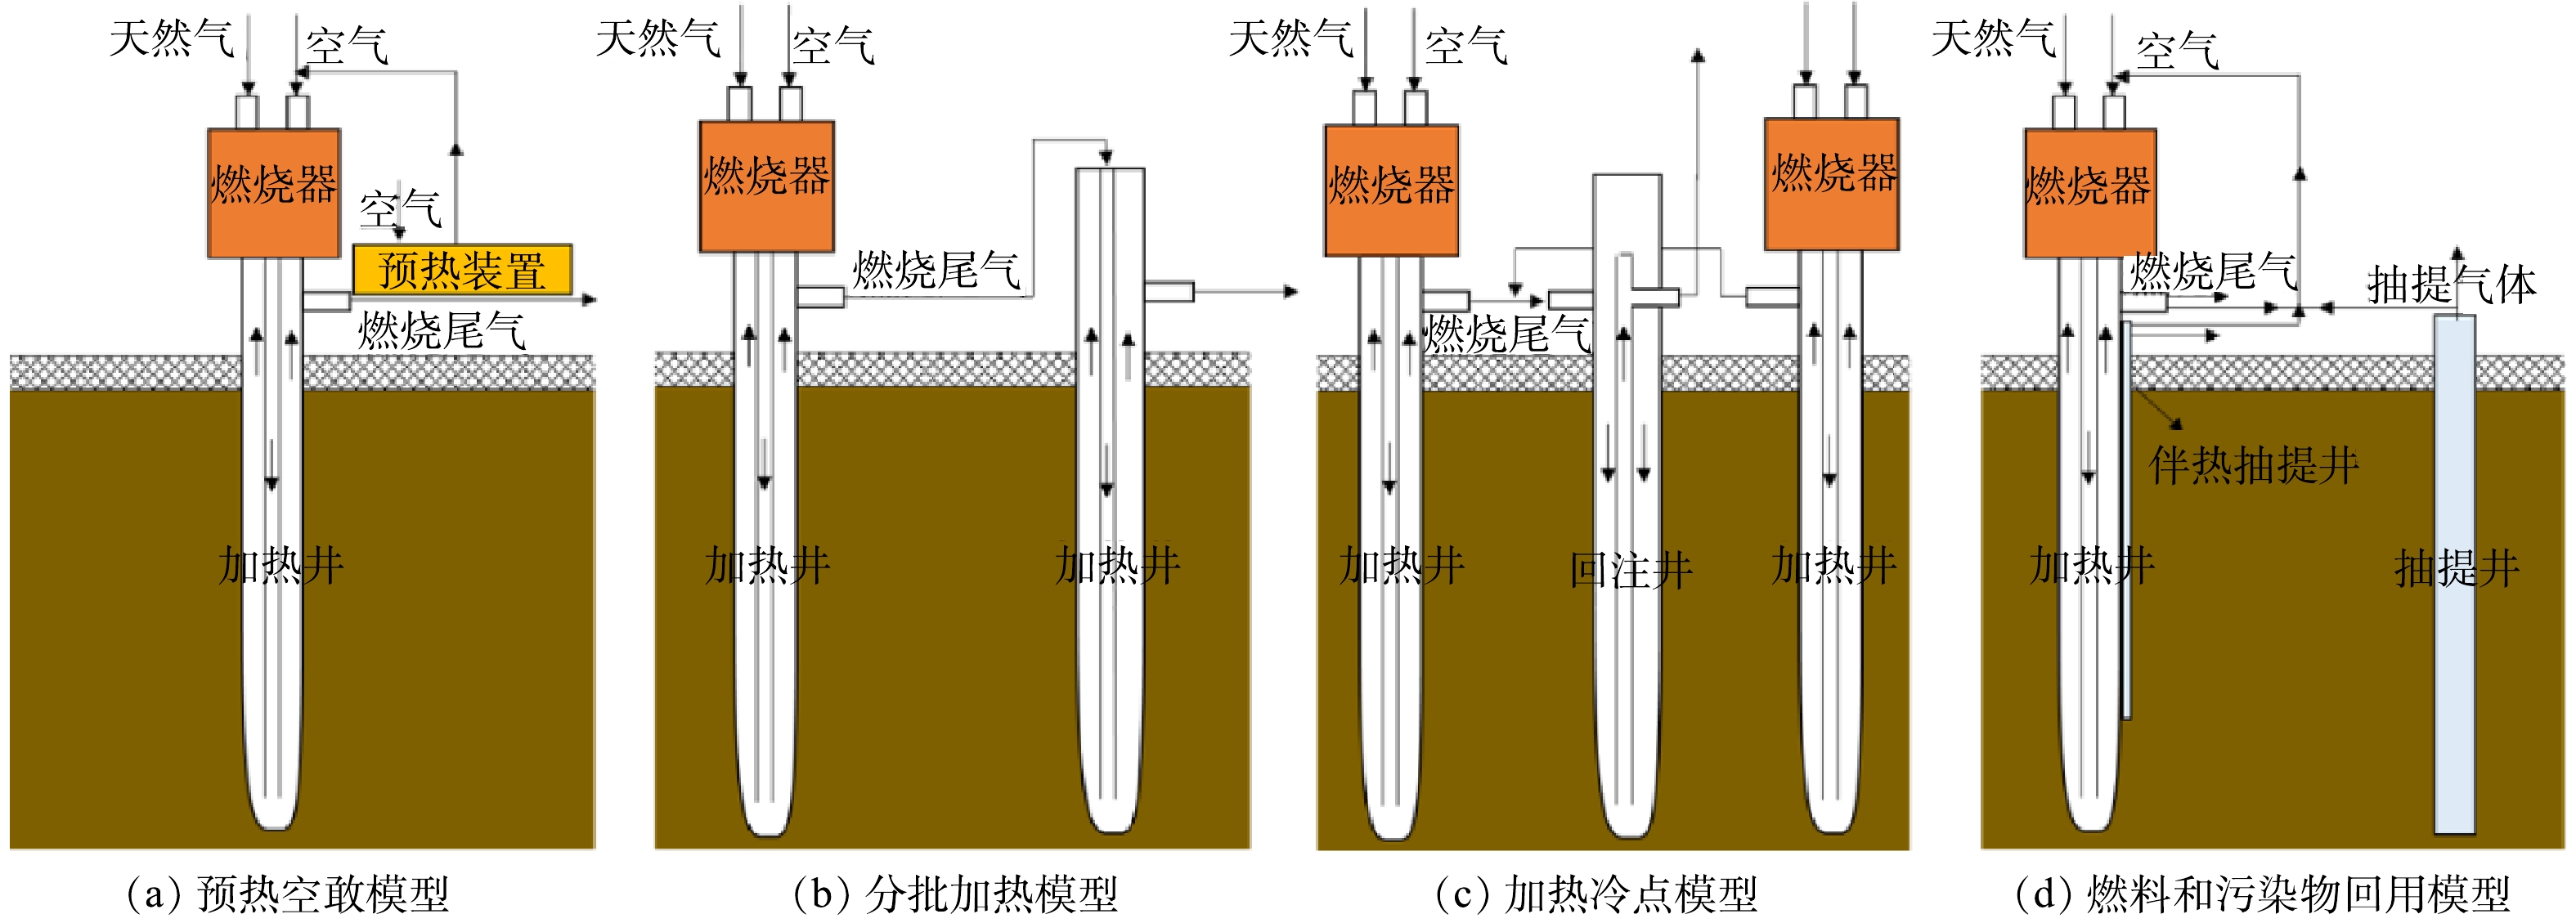
图 4 ISTT过程余热回用措施的概念模型
Figure 4. Conceptual model of waste heat recovery measures in ISTT process
Figure
4 ,Table
3 个