重金属在环境中难以降解,具有较长的半衰期,能够通过各种途径进入生物体与酶等蛋白质结合[1]。在浓度很低的情况下就可以产生毒性作用[2]。海洋是人类社会发展的宝贵财富,相关资料显示全球88%的生物生产力来自海洋[3]。越来越多的研究指出远洋生物已被重金属污染[3-5]。人类通过摄食海产品间接受到重金属的危害。进而产生潜在的致癌、致畸、致突变风险[6]。重金属导致的食用安全问题,已引起人们的高度关注。
鱿鱼在全世界大洋中的总资源量约4.20×10⁸~6.50×10⁸ t[7],是我国远洋渔业的两大主要品种(鱿鱼、金枪鱼)之一。鱿鱼生长迅速,富含蛋白质、牛磺酸、钙、磷和铁等营养物质,被广泛食用。不仅如此,鱿鱼在海洋食物网中起着承上启下的作用,对维系海洋生态系统平衡具有重要的作用。然而,近年来已有研究表明食用鱿鱼可能带来健康风险。如马来西亚Kedah-Perlis沿岸鱿鱼墨囊、头部及肌肉中已检出镉(Cd)和铅(Pb)超标[8]。在中国南海采集的鸢乌贼组织中同样检出Cd超标[9]。总体而言,目前研究缺少对全球海域鱿鱼体内重金属富集差异及健康风险的关注。
本研究在全球范围内鱿鱼生长较多的三大海区:西北太平洋、东南太平洋和印度洋采集了样品,分析鱿鱼不同组织中重金属元素铬(Cr)、砷(As)、Cd、Pb和汞(Hg)的富集程度,探讨元素间的相互关系以及在不同海域的分布特征。运用单因子污染指数(single factor index,SFI)、金属污染指数法(metal pollution index,MPI)评价鱿鱼重金属污染水平和食用质量水平。在此基础上利用目标危害系数法(target hazard quotients,THQ)评估人体摄入健康风险。并利用蒙特卡洛分析计算3片海域鱿鱼的最大摄入量。本研究为探明全球海域鱿鱼体内重金属富集特征及其健康风险评估提供了理论依据,为海产品质量标准制定提供理论基础数据。同时为沿岸居民鱿鱼摄食提供了参考依据。
1 材料与方法(Materials and methods)
1.1 样品采集
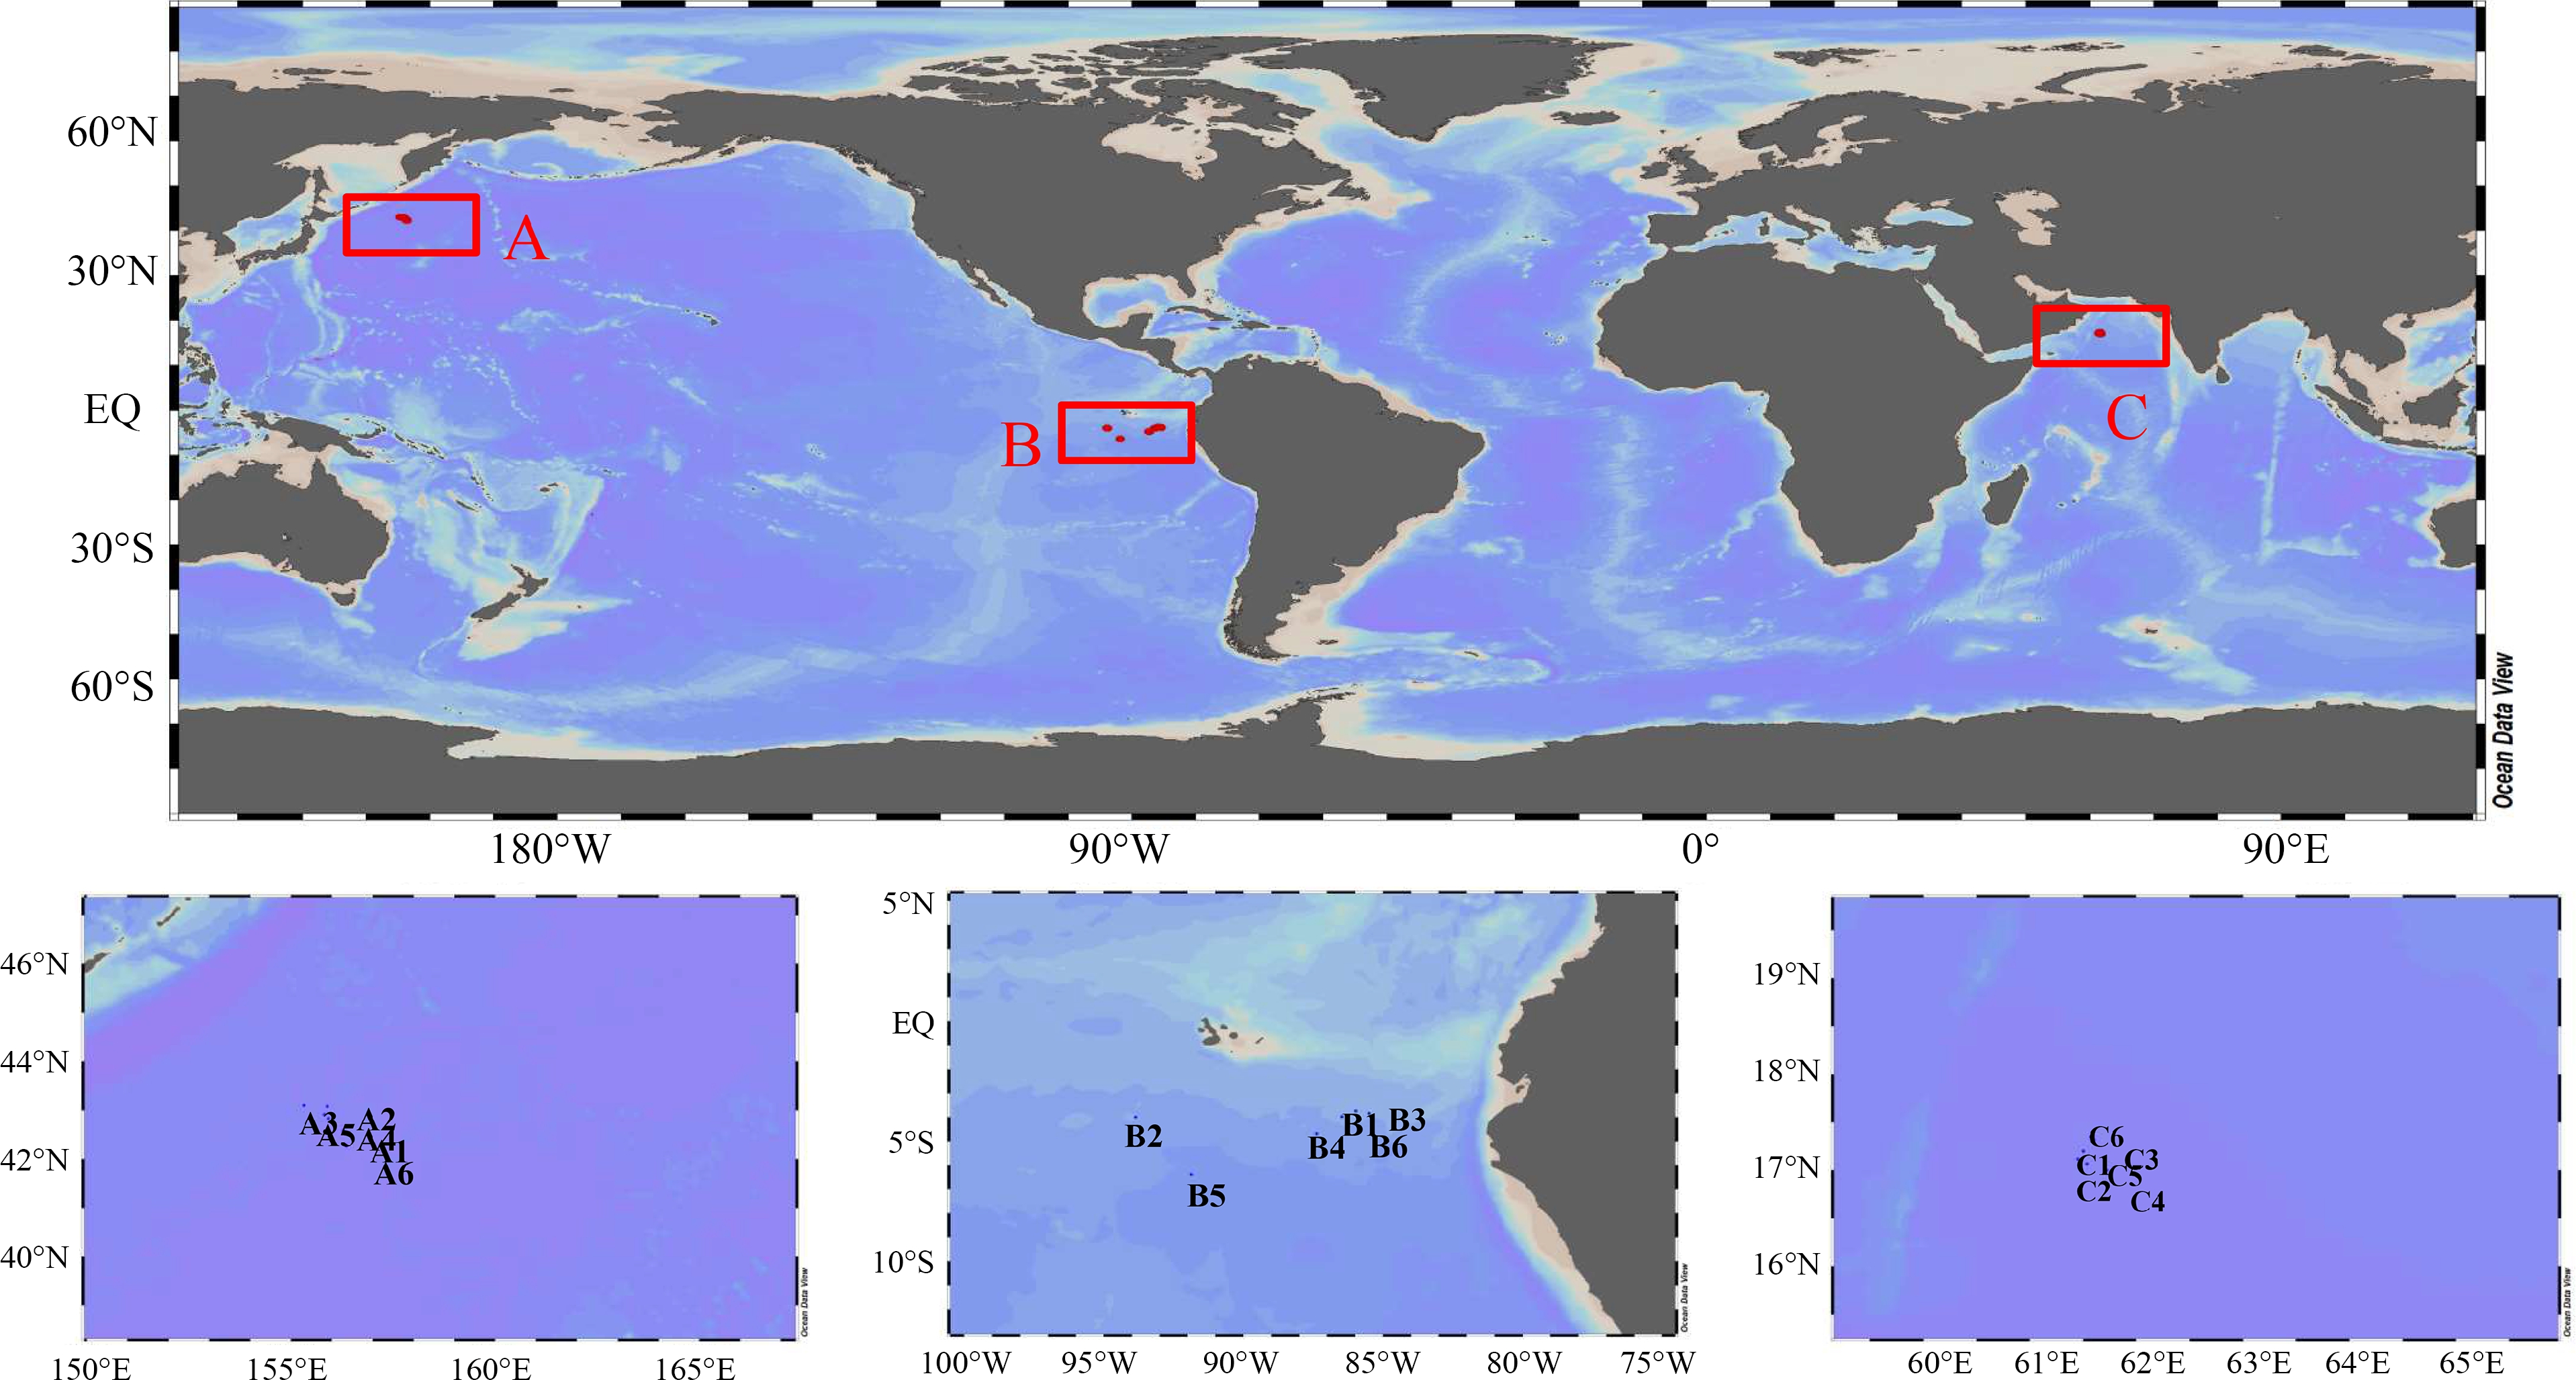
2017—2018年利用灯光围捕法采集北太平洋褶柔鱼(Todarodes pacificus,n=18),东南太平洋美洲大赤鱿(Dosidicus gigas,n=36)和印度洋鸢乌贼(Symplectoteuthis oualaniensis,n=18)样品,每个采样区域设置6个采样点(表1和图1)。捕获的3种鱿鱼均属于柔鱼科,在生活特性上具有较大的相似性(表2)[10-12],因此认为这3种鱿鱼在富集重金属水平上不存在明显的种间差异,可视为同类进行比较。鱿鱼运送至实验室后,在-20 ℃下保存至实验分析。
表1 站位点信息
Table 1 Sampling locations

区域Location经度(东+西-)/(°)Longitude (East + West -)/(°)纬度(北+南-)/(°)Latitude (North + South -)/(°)西北太平洋Northwest Pacific OceanA1156.2842.58A2155.8843.08A3155.3243.10 A4155.9242.83A5155.8242.92A6156.3542.27东南太平洋Southeast Pacific OceanB1-86.48-3.97B2-93.87-3.98B3-85.50-3.83B4-87.38-4.68B5-91.86-6.38B6-85.98-3.73印度洋Indian OceanC161.5017.20C261.5317.07C361.6017.32C461.7217.00C561.4517.17C661.5717.35

图1 采样点分布示意图
Fig. 1 Sketch map of the sampling sites
表2 3种鱿鱼的生活习性
Table 2 The habits of three squid

种类 Species栖息水层 Perched layer摄食 Diet生长周期 Life cycle 太平洋褶柔鱼Todarodes pacificus约75 mAbout 75 m鱼、头足类、甲壳类Fish, cephalopods and crustaceans约1 aAbout 1 a美洲大赤鱿Dosidicus gigas约100 mAbout 100 m鱼、头足类、甲壳类Fish, cephalopods and crustaceans约1 aAbout 1 a鸢乌贼Symplectoteuthis oualaniensis约100 mAbout 100 m鱼、头足类、甲壳类Fish, cephalopods and crustaceans<1 aLess than 1 a
1.2 样品预处理和测定方法
1.2.1 鱿鱼样品处理
鱿鱼样品在解剖之前,全部进行解冻。样品用去离子水洗净、使用不锈钢刀分离出肌肉、胃和肝脏组织并称量质量。所有组织样品在处理后都立即冷冻干燥保存。
1.2.2 金属含量测定
鱿鱼样品中Hg的测定:取0.03 g样品(干质量),置于测汞仪(DMA-80,Milestone,意大利)进行检测。测试条件如表3所示。
表3 测汞仪DMA- 80的工作条件
Table 3 Direct mercury analyzer DMA 80 operation parameters

工作参数 Operating parameter设定值 Setting燃烧温度/℃ Burning temperature/℃650干燥时间/sDrying time/s100分解时间/sResolving time/s150等待时间/sLatency time/s10
Cr、As、Cd和Pb的测定:取鱿鱼样品0.10 g置于聚四氟乙烯消解管中,向消解管中加入HNO3(Trace Metal,赛默飞)∶H2O2(优级纯,国药集团化学试剂有限公司,中国)=4∶2(V/V)的混合溶液6 mL,摇匀拧紧后放入全自动微波消解仪(ETHOSUP,莱伯泰科,北京,中国)中进行消解,待消化液冷却后移入50 mL离心管中,以超纯水定容至50 mL,采用电感耦合等离子体质谱(ICP-MS,Agilent 7900a,美国)分析测定仪测定其含量,测试条件如表4所示。
表4 电感耦合等离子体质谱分析仪工作条件
Table 4 ICP-MS operation parameters

工作参数Operating parameter设定值Setting工作参数Operating parameter设定值Setting功率/W Power/W1 500测试次数Times of test 3载气流量/(L·min-1) Carrier gas flow/(L·min-1)0.80模式ModelHe碰撞He collision辅助气流量/(L·min-1) Auxiliary flow/(L·min-1)0.40采集时间/s Acquisition time/s35
1.3 质量控制
Cr、As、Cd、Pb和Hg的检出限分别为0.05、2.00×10⁻³、2.00×10⁻³、0.02和1.00×10⁻³ μg·g-1,定量限分别是0.20、5.00×10⁻³、5.00×10⁻³、0.05和3.00×10⁻³ μg·g-1。各元素的标准曲线范围如表5所示,由于As与Cd的浓度较高,超出标线范围,文中的浓度数据为样品稀释10倍后再换算得出,未超过标线范围的Cr和Pb为未稀释样品测得的数据。
表5 各元素的标准曲线
Table 5 The standard curve of each element

元素名称Elements 标准曲线Standard curveCry=0.0505x+0.0040 (r2=0.9990)Asy=7.1130×10⁻⁴x-1.7772×10⁻⁵ (r2=0.9994)Cdy=0.0017x-7.9081×10⁻⁶ (r2=0.9994)Pby=0.0079x+4.1737×10⁻⁴ (r2=0.9992)Hgy=0.044x+0.0027 (r2=0.9970)
1.4 鱿鱼重金属污染水平评价
鱿鱼肌肉重金属污染评价依据《海洋生物质量》(GB 18421—2001,表6),采用单因子污染指数法(single factor index,SFI)和金属污染指数法(metal pollution index,MPI)[13-14]对3片海域鱿鱼的污染程度和重金属富集能力差异进行评估。
表6 海洋生物质量标准值
Table 6 Standard concentrations of 5 elements in marine organisms (mg·kg-1)

元素Elements第1类Type Ⅰ第2类Type Ⅱ第3类Type ⅢCr≤0.5≤2.0≤6.0As≤1.0≤5.0≤8.0Cd≤0.2≤2.0≤5.0Pb≤0.1≤2.0≤6.0Hg≤0.05≤0.1≤0.3
单因子污染指数法:SFI=Ci/Si
(1)
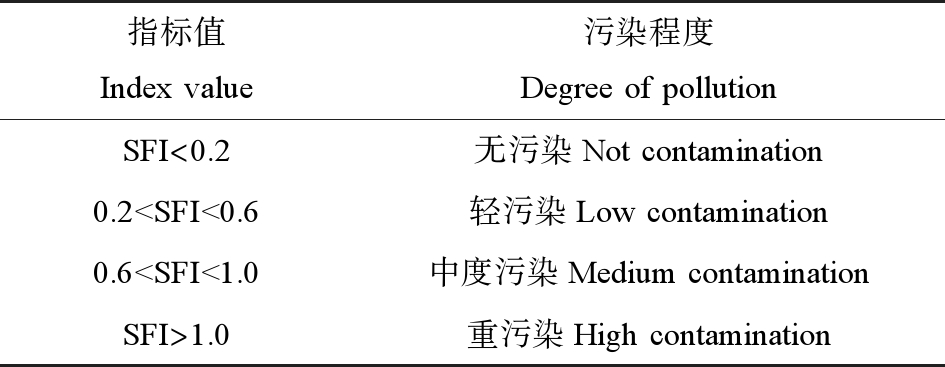
式中,SFI表示重金属i污染指数;Ci表示生物体实测重金属i含量(mg·kg-1,鲜质量),Si为重金属i的评价标准值(mg·kg-1,鲜质量),按照国家食品卫生标准值(GB 2762—2012、GB 13106—1991),Pb、Cd、Cr、As和Hg的标准值分别为0.5、0.1、2.0、0.5和0.05 mg·kg-1。SFI的评价标准如表7所示[15]。
表7 单因子污染指数法(SFI)的污染标准
Table 7 The single factor index (SFI) value with the corresponding pollution criteria

指标值Index value污染程度Degree of pollutionSFI<0.2无污染Not contamination0.2
金属污染指数法:![]()
(2)
式中:Cn为样品中第n种重金属的浓度(mg·kg-1,鲜质量);n为评价元素个数,MPI的评价标准如表8所示。
表8 金属污染指数法(MPI)的污染标准
Table 8 The metal pollution index (MPI) value with the corresponding pollution criteria

指标值Index value污染程度Degree of pollutionMPI<2未受影响Not impacted2
1.5 重金属暴露健康风险评估
1.5.1 每日估计摄入量(EDI)
由于目前缺少鱿鱼的日平均摄入量数据,鱿鱼在头足类中占有较高的食用比例,故本研究使用头足类日平均摄入量近似替代鱿鱼的日平均摄入量[16]。根据头足类中重金属的浓度和头足类的每日消费量计算出这5种重金属的每日摄入量(estimated daily intake,EDI)[17-18],计算公式如下。
(3)
式中:Ci和FIR分别表示重金属浓度(mg·kg-1)和头足类日平均摄取率(g·d-1),BW指平均体重(成人平均体质量70 kg)[19]。联合国粮农组织(FAO)调查数据显示,在西北太平洋、东南太平洋和印度洋地区,头足类的平均日消费量分别为4.10、2.50和2.40 g·d-1。
1.5.2 非致癌风险评价(THQ)
单一重金属危害系数(the target hazard quotient,THQ)是比较污染物摄入与标准参考剂量的综合风险指标,常用于重金属的非致癌风险评价[20]。当THQ<1时,认为暴露人群无明显健康风险;当THQ≥1时,则暴露人群存在健康风险。计算公式如下:
(4)
式中:EF为暴露频率(365 d·a-1);ED为平均暴露时间(70 a);AT为平均曝光时间(d);RfD为金属的参考口服剂量(mg·kg-1·d-1),RfD分别为1.50(Cr)、3.00×10⁻⁴(As)、3.00×10⁻³(Cd)、3.50×10⁻³(Pb)和5×10⁻⁴(Hg) mg·kg-1·d-1;AT=ED×365(d)[20-21]。鉴于鱿鱼体内重金属的混合叠加效应,常用危害指数(HI)综合评估各种重金属对人体健康造成的风险[22]。同样,HI值≥1表示重金属对人体有潜在的危害。否则,风险可以忽略不计。HI计算公式如下:
HI=∑THQ=THQCr+THQAs+THQPb+THQCd+THQHg
(5)
1.6 数据分析
数据整理利用Excel 2010完成,采用Ocean Data View进行采样点绘制,皮尔森相关性、主成分分析等绘图利用Origin 2019b完成,利用R(V.4.0.3)软件进行蒙特卡洛分析。
2 结果(Results)
2.1 大洋鱿鱼重金属富集特征
鱿鱼体内5种重金属元素Cr、As、Cd、Pb和Hg浓度如图2所示,含量分别为nd~0.68、0.14~14.88、nd~247.80、nd~1.46和3.00×10⁻³~0.15 μg·g-1。Cd和As的浓度明显高于其他3种重金属。组织间表现出消化腺>胃>肌肉的趋势,主要是因为消化腺含有大量的蛋白质,重金属与酶上的巯基能发生大量的结合[23-24]。

图2 鱿鱼体内重金属浓度
注:灰色代表西北太平洋,红色代表东南太平洋,蓝色代表印度洋。
Fig.2 Concentrations of heavy metals in squids
Note:Grey represents Northwest Pacific,red represents Southeast Pacific,and blue represents Indian Ocean.
鱿鱼重金属富集特征还与生活的海域有关。Cr在区域间呈现西北太平洋(肌肉:0.15~0.53 μg·g-1,胃:0.12~0.50 μg·g-1,消化腺:0.07~0.25 μg·g-1)>东南太平洋(肌肉:0.08~0.12 μg·g-1,胃:0.10~0.17 μg·g-1,消化腺:0.08~0.19 μg·g-1)>印度洋(肌肉:0.06~0.16 μg·g-1,胃:0.06~0.68 μg·g-1,消化腺:0.03~0.16 μg·g-1)。Pb则呈现西北太平洋>印度洋>东南太平洋的趋势。另外,据Dorneles等[25]研究发现,生物碎屑可以释放Cd至环境,鱿鱼可以通过摄食生物碎屑间接提高体内Cd含量。有研究表明Cd易富集在上升流表层区域[26],鱿鱼生活在水深100 m左右,夜晚至水表层活动,为其摄入Cd提供了良好的条件。鱿鱼组织中Cd浓度呈现出印度洋(肌肉:0.83~2.91 μg·g-1,胃:2.25~15.37 μg·g-1,消化腺:118.72~247.80 μg·g-1)>东南太平洋(肌肉:0.24~0.80 μg·g-1,胃:1.54~10.34 μg·g-1,消化腺:59.75~93.99 μg·g-1)>西北太平洋(肌肉:0.07~0.49 μg·g-1,胃:0.11~0.57 μg·g-1,消化腺:23.94~43.69 μg·g-1)的趋势,该3块区域中印度洋存在1块季节性上升流区域,东南太平洋拥有赤道上升流[27],使得这2块海域拥有更多的Cd元素,鱿鱼体内表现出富Cd现象。除此以外,As也表现出了海域差异性,印度洋>东南太平洋>西北太平洋。根据《全国海岸带和滩涂资源综合调查简明规程》中软体类生物质量标准(表9),Cd和As的含量均超过标准,需要引起重视。此外,Hg的浓度呈现西北太平洋(肌肉:0.04~0.52 μg·g-1,胃:0.03~0.91 μg·g-1,消化腺:0.06~0.15 μg·g-1)>东南太平洋(肌肉:0.02~0.04 μg·g-1,胃:0.01~0.04 μg·g-1,消化腺:0.03~0.08 μg·g-1)>印度洋(肌肉:7.00×10⁻³~0.01 μg·g-1,胃:3.00×10⁻³~7.00×10⁻³ μg·g-1,消化腺:4.00×10⁻³~0.03 μg·g-1)的趋势。据估计,目前全球一半以上的人为Hg排放来自亚洲[28]。而西北太平洋可能是来自亚洲的大气Hg源的下风,导致其中有较高的污染物水平[29]。Kojadinovic等[30]认为印度洋这样的热带海洋受到的污染比北部海洋少,而且,印度洋与大型人为活动中心隔绝,因此在印度洋呈现较低的污染水平。
表9 软体类生物质量标准
Table 9 Biological quality standards for mollusks (μg·g-1,湿质量Wet weight)

生物类别Organisms categoriesPbCdCrAsHg软体类 Molluscs≤10≤5.5≤1.5≤1.0≤0.3
根据皮尔森相关性分析(数据已正态化处理),重金属Cd与Hg、Pb呈明显正相关,相关系数分别为0.26和0.30,与其他重金属未呈明显正相关或呈负相关。As与Pb也呈现明显正相关,相关系数为0.28,说明鱿鱼体内这2组元素可能存在着相似的来源(图3)。

图3 5种元素间的相关性
Fig. 3 The correlations among five elements
2.2 鱿鱼重金属污染水平评价
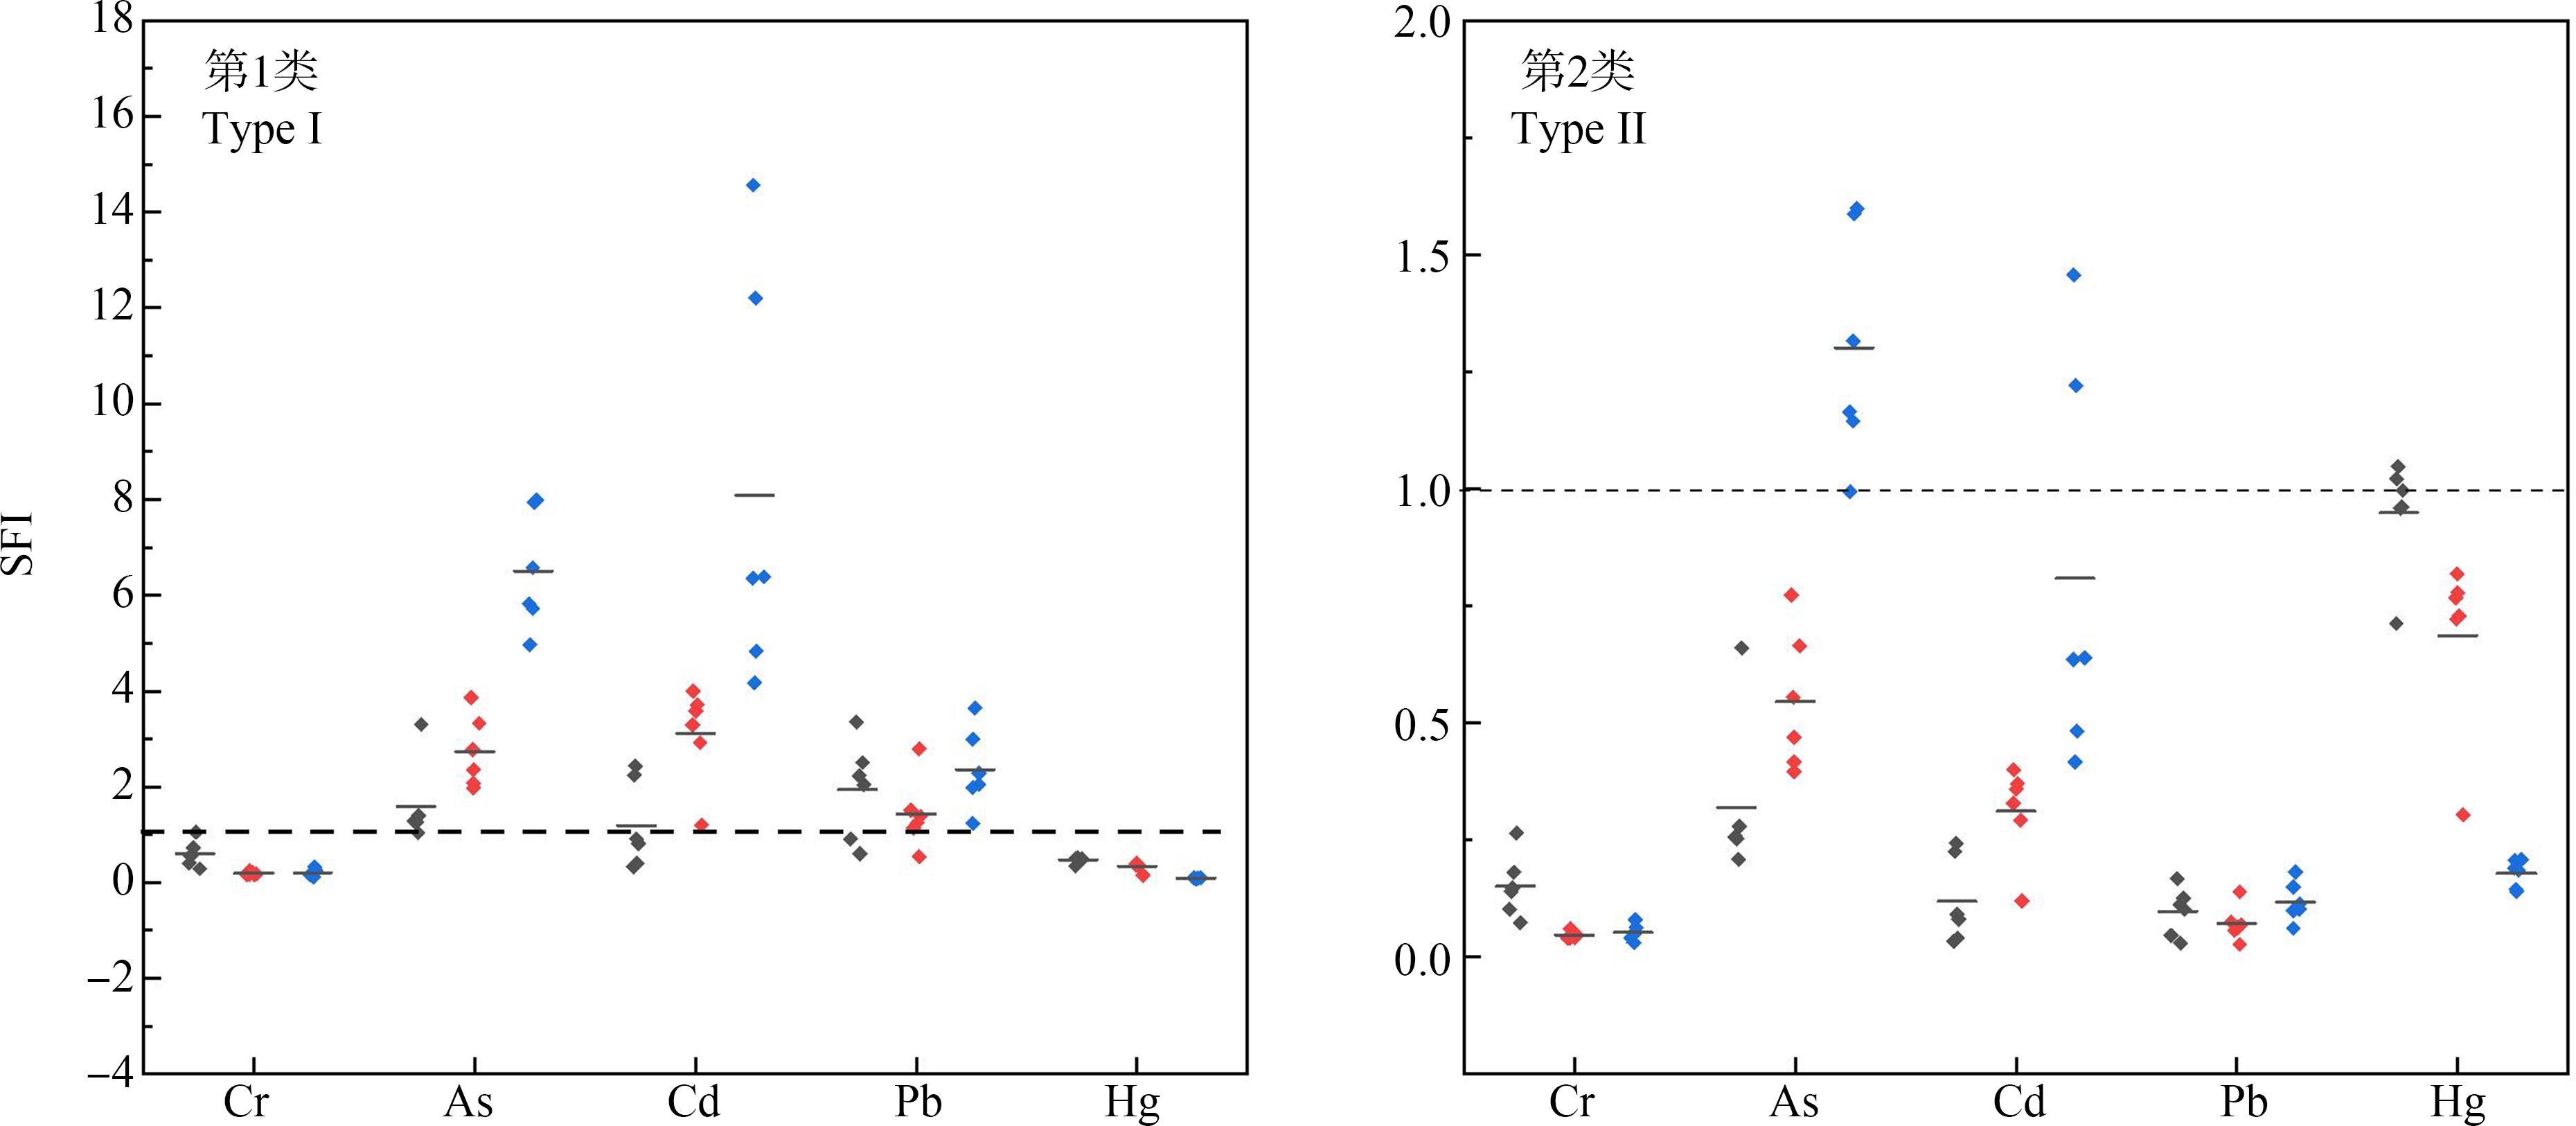
根据《海洋生物质量》(GB 18421—2001),海洋生物质量可划分为3类,第1类生物质量最优,第2类次之,第3类相对较差[31]。采用SFI和MPI对三大海域鱿鱼肌肉重金属含量进行污染水平评价,结果如图4和图5所示。从3类生物体的污染指数来看,与第1类海洋生物质量相比,除Cr和Hg在3片海域的SFI不超过1外,其余3种重金属元素在各区域污染指数几乎100%超过1。印度洋Cd最高SFI值达到14.57,平均为8.09,As最高SFI值达到7.94,平均为6.51,Pb最高SFI达到3.65,平均值为2.44。与第2类海洋生物质量相比,除印度洋Cd、As的SFI值仍>1外,其余均<1,符合质量标准。因此,需要对印度洋区域重金属污染问题加强控制和监管。

图4 单因子污染指数(SFI)法评价鱿鱼肌肉重金属水平
注:灰色代表西北太平洋,红色代表东南太平洋,蓝色代表印度洋。
Fig.4 Heavy metals levels in squid muscles assessed using single factor index (SFI) method
Note:Grey represents Northwest Pacific,red represents Southeast Pacific,and blue represents Indian Ocean.

图5 鱿鱼肌肉重金属污染指数(MPI)
注:灰色代表西北太平洋,红色代表东南太平洋,蓝色代表印度洋。
Fig.5 The metal pollution index (MPI) in squid muscles
Note:Grey represents Northwest Pacific,red represents Southeast Pacific,and blue represents Indian Ocean.
3片海域鱿鱼体内重金属污染指数如图5所示,印度洋鱿鱼对重金属富集能力最强,MPI值为0.68±0.04,与单因子污染指数法结果一致。总体而言,MPI均<2,能够满足无公害水产品安全要求。
2.3 健康风险评价
鱿鱼中有毒元素的积累对消费者的健康有害,而肌肉是鱿鱼的主要被食用组织,因此,对鱿鱼肌肉进行健康风险评估至关重要。5种有毒元素的EDI是根据肌肉中有毒元素的浓度和FAO给出的当地日平均摄入量计算出来的。Cr、As、Pb、Cd和Hg的平均EDI均<3.40×10⁻⁶ mg·kg-1·d-1,远低于联合国粮农组织/世界卫生组织食品添加剂专家委员会制定的有毒元素每日摄入耐受量(PTDIs)[32-33]。5种重
金属的THQ平均值均<1(表10)。此外,As的THQ值最高,而Cr的THQ值最低。由图6可知,3种鱼类的HI均<1。HI在3片海域的排序为印度洋(0.88)>东南太平洋(0.35)>西北太平洋(0.34),表明靠近这3片海域的当地居民长期摄食这3种鱿鱼不会造成潜在的重金属健康风险。5种重金属对HI的贡献率有较大差异性,贡献率大小排序为As>Cd>Pb>Hg>Cr,故可视As和Cd为主要风险元素,其中As对HI的贡献率最高(超过90%),应对其予以优先关注防控。同时As又是威胁人类健康的主要重金属之一,摄入后可能导致肾癌、皮肤癌和神经紊乱[34],因此应加强鱿鱼食用品中As的健康风险防控。
表10 3片海域鱿鱼中5种重金属健康风险评价
Table 10 Health risk assessment of five heavy metals of squid from three regions

EDI/(×10-3mg·kg-1·d-1)THQ(×10-3)CrAsCdPbHgCrAsCdPbHgHI(×10-3)西北太平洋Northwest Pacific Ocean0.02 0.090.140.023.00×10-30.01311.7613.975.285.56 336.58 东南太平洋Southeast Pacific Ocean3.40×10-30.10.020.011.00×10-32.00×10-3324.8922.271.2822.45 350.89 印度洋Indian Ocean0.01 0.240.080.013.00×10-43.00×10-3798.5274.582.070.61 875.78
注:EDI表示每日摄入量;THQ表示单一重金属危害系数;HI表示危害指数。
Note:EDI is estimated daily intake;THQ is the target hazard quotient;HI is the harm index.

图6 重金属的非致癌风险
Fig. 6 THQ of individual metal
尽管定量分析方法评估的结果均表明摄食3片海域鱿鱼对人体不会产生健康风险,但摄入量增大仍然有产生风险的可能。因此,利用蒙特卡洛模拟方法对5种重金属的联合作用进行不确定性模拟计算,结果表明在西北太平洋、东南太平洋和印度洋3片海域的鱿鱼的最大摄入量分别为99、48.5和20.5 g·d-1(图7)。为人们摄食鱿鱼的风险评估提供了数据支撑。

图7 蒙特卡洛分析
Fig. 7 Mento Carlo simulation
3 讨论(Discussion)
西北太平洋、东南太平洋和印度洋3片海域鱿鱼组织中重金属均表现出消化腺>胃>肌肉,Cd、As大于Cr、Pb和Hg。重金属呈现明显的地域差异性。相关性分析结果显示,Cd、Hg与Pb呈明显正相关,As与Pb也呈现明显正相关,说明2组元素可能存在相似的来源。
印度洋Cd、As浓度较高,通过SFI、MPI值的计算,两者均超过《海洋生物质量》(GB 18421—2001),中对其的限定值。非致癌风险评估结果表明3片海域鱿鱼均不存在健康风险,可放心适量食用。通过蒙特卡洛分析,得出3片海域鱿鱼的最大推荐食用量,分别为99、48.5和20.5 g·d-1。
基于本文的研究结果,建议加强对重金属排放的监管力度,同时制定出更加完善的海产品中不同种类重金属的标准。针对不同区域、不同海产品以及不同人群等特点给出更具针对性的参考食用量和食用频率、引导人们避免食用被污染的海产品,从而减少有害重金属的摄入风险,保证海产品的食用安全性。
致谢:感谢上海海洋大学鱿钓技术组对本研究样品的技术支持,感谢刘必林研究员在实验实施方面提供的帮助及评审专家提出的宝贵意见。
[1] Clarkson T W,Vyas J B,Ballatori N.Mechanisms of mercury disposition in the body [J].American Journal of Industrial Medicine,2007,50(10):757-764
[2] Djahed B,Taghavi M,Farzadkia M,et al.Stochastic exposure and health risk assessment of rice contamination to the heavy metals in the market of Iranshahr,Iran [J].Food and Chemical Toxicology,2018,115:405-412
[3] 郭军,郭冠超.加快发展海洋经济的战略意义[J].理论参考,2012(4):5-6
Guo J,Guo G C.The strategic significance of accelerating the development of marine economy [J].Theoretical Reference,2012(4):5-6 (in Chinese)
[4] Copat C,Arena G,Fiore M,et al.Heavy metals concentrations in fish and shellfish from eastern Mediterranean Sea:Consumption advisories [J].Food and Chemical Toxicology,2013,53:33-37
[5] Copat C,Bella F,Castaing M,et al.Heavy metals concentrations in fish from Sicily (Mediterranean Sea) and evaluation of possible health risks to consumers [J].Bulletin of Environmental Contamination and Toxicology,2012,88(1):78-83
[6] 谢文平,朱新平,郑光明,等.广东罗非鱼养殖区水体和鱼体中重金属、HCHs、DDTs含量及风险评价[J].环境科学,2014,35(12):4663-4670
Xie W P,Zhu X P,Zheng G M,et al.Residues and health risk assessment of HCHs,DDTs and heavy metals in water and tilapias from fish ponds of Guangdong [J].Environmental Science,2014,35(12):4663-4670 (in Chinese)
[7] 宋伟华,马永钧,姚平.世界鱿鱼产品市场贸易简况[J].海洋渔业,2003,25(3):161-162
[8] Jamil T,Lias K,Norsila D,et al.Assessment of heavy metal contamination in squid (Loligo spp.) tissues of Kedah-Perlis waters,Malaysia [J].Journal of Analytical Sciences,2014,18(1):195-203
[9] Wu Y Y,Shen Y,Huang H,et al.Trace element accumulation and tissue distribution in the purpleback flying squid Sthenoteuthis oualaniensis from the central and southern South China Sea [J].Biological Trace Element Research,2017,175(1):214-222
[10] 方舟,陈新军.太平洋褶柔鱼渔业资源及渔场学研究进展[J].海洋渔业,2018,40(1):102-116
Fang Z,Chen X J.Review on fishery of Japanese flying squid Todarodes pacificus [J].Marine Fisheries,2018,40(1):102-116 (in Chinese)
[11] Chen X J,Li J H,Liu B L,et al.Fishery biology of jumbo flying squid Dosidicus gigas off Costa Rica Dome [J].Journal of Ocean University of China,2014,13(3):485-490
[12] Chen X J,Liu B L,Tian S Q,et al.Fishery biology of purpleback squid,Sthenoteuthis oualaniensis,in the northwest Indian Ocean [J].Fisheries Research,2007,83(1):98-104
[13] Hao Y,Chen L,Zhang X L,et al.Trace elements in fish from Taihu Lake,China:Levels,associated risks,and trophic transfer [J].Ecotoxicology and Environmental Safety,2013,90:89-97
[14] Usero J.Trace metals in the bivalve molluscs Ruditapes decussatus and Ruditapes philippinarum from the Atlantic Coast of Southern Spain [J].Environment International,1997,23(3):291-298
[15] 黄长江,赵珍.湛江港海域海产品中重金属残留及评价[J].汕头大学学报:自然科学版,2007,22(1):30-36
Huang C J,Zhao Z.Assessment on contents of heavy metals in seafoods from Zhanjiang harbor [J].Journal of Shantou University:Natural Science Edition,2007,22(1):30-36 (in Chinese)
[16] Food and Agriculture Organization of the United Nations (FAO).Food supply-livestock and fish primary equivalent.Microsoft Excel file [EB/OL].(2018-01-17) [2021-06-05].http://www.fao.org/faostat/en/#data/CL
[17] Griboff J,Wunderlin D A,Monferran M V.Metals,As and Se determination by inductively coupled plasma-mass spectrometry (ICP-MS) in edible fish collected from three eutrophic reservoirs.Their consumption represents a risk for human health?[J].Microchemical Journal,2017,130:236-244
[18] Liu H Q,Liu G J,Yuan Z J,et al.Occurrence,potential health risk of heavy metals in aquatic organisms from Laizhou Bay,China [J].Marine Pollution Bulletin,2019,140:388-394
[19] Traina A,Bono G,Bonsignore M,et al.Heavy metals concentrations in some commercially key species from Sicilian coasts (Mediterranean Sea):Potential human health risk estimation [J].Ecotoxicology and Environmental Safety,2019,168:466-478
[20] Untied States Environmental Protection Agency (US EPA).Risk assessment guidance for superfund.Human Health Evaluation Manual (Part A) [EB/OL].(2010-04-01) [2021-06-05].https://www.epa.gov/sites/production/files/2015-09/documents/rags_a.pdf
[21] Yang Q Q,Li Z Y,Lu X N,et al.A review of soil heavy metal pollution from industrial and agricultural regions in China:Pollution and risk assessment [J].The Science of the Total Environment,2018,642:690-700
[22] Bonsignore M,Salvagio Manta D,Mirto S,et al.Bioaccumulation of heavy metals in fish,crustaceans,molluscs and echinoderms from the Tuscany coast [J].Ecotoxicology and Environmental Safety,2018,162:554-562
[23] Bustamante P,Lahaye V,Durnez C,et al.Total and organic Hg concentrations in cephalopods from the North Eastern Atlantic waters:Influence of geographical origin and feeding ecology [J].The Science of the Total Environment,2006,368(2-3):585-596
[24] Seco J,Xavier J C,Brierley A S,et al.Mercury levels in Southern Ocean squid:Variability over the last decade [J].Chemosphere,2020,239:124785
[25] Dorneles P R,Lailson-Brito J,dos Santos R A,et al.Cephalopods and cetaceans as indicators of offshore bioavailability of cadmium off Central South Brazil Bight [J].Environmental Pollution,2007,148(1):352-359
[26] Martin J H,Broenkow W W.Cadmium in plankton:Elevated concentrations off Baja California [J].Science,1975,190(4217):884-885
[27] Froyland G,Stuart R M,van Sebille E.How well-connected is the surface of the global ocean?[J].Chaos:An Interdisciplinary Journal of Nonlinear Science,2014,24(3):033126
[28] Pirrone N,Cinnirella S,Feng X,et al.Global mercury emissions to the atmosphere from anthropogenic and natural sources [J].Atmospheric Chemistry and Physics,2010,10(201):5951-5964
[29] Sunderland E M,Krabbenhoft D P,Moreau J W,et al.Mercury sources,distribution,and bioavailability in the North Pacific Ocean:Insights from data and models [J].Global Biogeochemical Cycles,2009,23(2):1-14
[30] Kojadinovic J,Potier M,Le Corre M,et al.Bioaccumulation of trace elements in pelagic fish from the Western Indian Ocean [J].Environmental Pollution,2007,146(2):548-566
[31] 孙玲玲,宋金明,于颖,等.荣成湾14种海洋经济生物体中的重金属水平与食用风险初步评价[J].海洋与湖沼,2018,49(1):52-61
Sun L L,Song J M,Yu Y,et al.Preliminary assessment on heavy metal levels and food risk in 14 economic organisms of the Rongcheng Bay [J].Oceanologia et Limnologia Sinica,2018,49(1):52-61 (in Chinese)
[32] Joint (FAO/WHO) Expert Committee on Food Additives (JECFA).Evaluation of certain food additives and contaminants:Seventy-seventh report of the Joint FAO/WHO Expert Committee on Food Additives (JECFA).JECFA/77/TRS.[R].Rome:Food &Agriculture Organization,2013
[33] Joint (FAO/WHO) Expert Committee on Food Additives (JECFA).Joint FAO/WHO Expert Committee on food Additives.Reports of the 53rd meeting of the Joint FAO/WHO Expert Committee on Food Additives (JECFA).JECFA/53/ TRS.[R].Rome:Food &Agriculture Organization,1999
[34] 张小磊,王晶晶,安春华,等.郑州沿黄地区养殖鱼类中重金属污染与健康风险评价[J].生态环境学报,2018,27(2):350-355
Zhang X L,Wang J J,An C H,et al.Pollution characteristics and health risk assessment of heavy metals in cultured fish species along the Yellow River in Zhengzhou [J].Ecology and Environmental Sciences,2018,27(2):350-355 (in Chinese)