在过去的几十年里,人类内分泌(激素)相关疾病的高发病率和不断增加的趋势引发了人们对环境内分泌干扰物(environmental endocrine disruptors, EDCs)的关注。EDCs能够干扰和改变内分泌系统的功能,引起人体内分泌紊乱[1]、引发儿童肥胖[2]等。雌激素就是一种典型的EDC,人体受雌激素的影响可以通过该物质对雌激素受体(estrogen receptor, ER)的激动作用来评估[3]。
对人类雌激素受体有激动作用的雌激素可以分为3类:天然雌激素(雌酮、雌二醇和雌三醇等),合成雌激素(双酚A),以及植物雌激素(金雀异黄酮、β-谷甾醇和豆甾醇等)[4]。目前大量研究已从人体血液、尿液中检测出了天然雌激素[5-7]、合成雌激素[8-9]以及植物雌激素[10-12]。还有研究检测了人从水体环境接触雌激素的风险[13];从中草药[14]、豆浆[15]等通过食用摄入雌激素的风险。
雌激素对ER的激动作用可以通过相对结合亲和力(relative binding affinity, RBA)的数据来评估。有研究通过实验确定了部分雌激素的雌激素受体相对结合亲和力[16]。对于部分没有实验数据的物质,一些研究通过分子对接[17]或者使用QSAR建模[18]预测了雌激素受体相对结合亲和力。
本研究对全国范围内的猪饲料以及猪肉中含有的天然雌激素(雌酮、雌二醇和雌三醇等)、合成雌激素(双酚A)、植物雌激素(金雀异黄酮、β-谷甾醇和豆甾醇等)进行了含量的检测;并对雌激素从饲料到猪肉的生物富集进行了评估。本研究还对雌激素和雌激素类似物的雌激素受体相对结合亲和力进行了QSAR计算,建立了q2=0.721,r2=0.925的CoMFA预测模型和q2=0.824,r2=0.961的CoMSIA预测模型。通过使用本研究预测得到的雌激素受体相对结合亲和力以及农业农村部给出的人群猪肉摄入量,对测得的雌激素水平进行了对人体的影响评估。
1 材料与方法(Materials and methods)
1.1 材料
β-谷甾醇标准品(≥99%)、柚皮素标准品(≥99%)、豆甾醇标准品(≥99%)和大豆苷标准品(≥99%)购自ANPEL公司;香豆素标准品购自Dr. Ehrenstorfer公司;香芹酚(≥95%)、麝香草酚(≥99%)购自CNW公司;金雀异黄酮(96.0%)购自TCI公司;8种激素类混标(≥99%)购自ANPEL公司;硅烷化试剂(V(BSTFA)∶V(TMCS)=99∶1)购自REGIS公司;SPE填料LC-C18(40~63 μm)、PSA(40~63 μm)购自CNW公司。
猪饲料样品于各地购买后空运至实验室,并于室温下密封保存;猪肉样品于各地购买后冷冻空运至实验室,并于-40 ℃冰箱保存。猪饲料及猪肉样品的采样点设置在我国东北地区、华北地区、华中地区、华东地区、东南地区和西南地区具有代表性的城市,分别是哈尔滨、北京、西安、上海、广州和成都。
1.2 试验方法
1.2.1 样品前处理
样品经粉碎均匀后制成待测样,于室温下密封保存。称取2.0 g待测样品于50 mL聚乙烯离心管中,加入10 mL超纯水,涡旋振荡1 min后,加入10 mL 1%乙酸+乙酸乙酯,涡旋振荡2 min后,摇床振荡90 min,再加入4.0 g无水硫酸钠和1.0 g氯化钠,涡旋振荡2 min。取上清液约8 mL置于装有100 mg C18、50 mg PSA和200 mg无水硫酸钠的15 mL离心管中,涡旋振荡2 min,于4 ℃冰箱静置过夜。取5 mL上清液至10 mL试管中,40 ℃氮吹至干,用1 mL甲醇复溶,经0.22 μm滤膜过滤后,上机测定[19]。
1.2.2 色谱条件
使用日本岛津GCMS-QP2010气相色谱质谱联用仪进行分析,进样器为岛津AOC-6000多功能自动进样器,使用的色谱柱是Rtx-5ms气相色谱柱(30 m×0.25 mm, 0.25 μm)。进样量为1 μL,电子能量70 eV,离子源温度230 ℃,进样器温度程序如下:初始温度50 ℃,以8 ℃·s-1的速率升温至220 ℃,保持2 min;之后以10 ℃·s-1的速率升温至280 ℃,保持16 min。载气流速1 mL·min-1,扫描模式为选择离子(SIM)模式。
1.3 QSAR计算
相对结合亲和力(relative binding affinity, RBA)是通过比较测试化学品与雌二醇的半数抑制浓度(IC50)来计算的。
式中:![]() 是雌二醇在生物测定中对ER结合产生50%抑制作用的浓度,IC50是测试化学品在生物测定中对ER结合产生50%抑制作用的浓度。
是雌二醇在生物测定中对ER结合产生50%抑制作用的浓度,IC50是测试化学品在生物测定中对ER结合产生50%抑制作用的浓度。
在本研究中,使用相对结合亲和力的负对数(pRBA)来衡量结合亲和力,RBA活性数据来自美国EPA CompTox平台[20]。物质结构数据来自PubChem[21],经MarvinSketch软件处理后导入Sybyl-X 2.1.1(Tripos)进行QSAR计算。
2 结果与讨论(Results and discussion)
2.1 雌激素及其类似物的QSAR计算
本研究在PubChem中搜索了1 000多种雌激素结构相似化合物,最后筛选出了65种具有RBA实验值的化合物。从这65种化合物中选取29个化合物进行3D-QSAR研究,以雌激素受体相对亲和力(RBA)的对数表征生物活性,建立了CoMFA与CoMSIA模型。构建三维定量构效关系模型时,选用活性最好的分子作为模板分子,将全部分子的共有骨架作为固定结构,进行分子的叠合,使它们的立体场差别最小,29个化合物的分子叠合图如图1所示。
CoMFA和CoMSIA模型的各项统计学参数如表1所示。就CoMFA模型而言,交叉验证相关系数(q2)和非交叉验证相关系数(r2)分别是0.721和0.925,F检验值相对较低,仅为64.977,尚在可靠范围内。上述参数均表明,CoMFA模型具有较好的预测能力。对测试集中分子进行活性预测,相关系数为0.991。CoMFA立体场(steric field, S)贡献率为56.6%,静电场(electrostatic filed, E)为43.4%,可见该类化合物周围的立体场和静电场二者对其发挥活性有重要的影响。CoMSIA模型的q2和r2分别是0.824和0.961,F检验值为113.157,尚在可靠范围内。上述参数均表明,CoMSIA模型具有较好的预测能力。

图1 训练集中化合物的分子叠合
Fig. 1 Molecular superposition of compounds in the training set
表1 CoMFA和CoMSIA模型的统计参数
Table 1 Statistical parameters of CoMFA and CoMSIA models

模型ModelsPLS参数 PLS statisticsONCaq2bEscr2dFePfrp2gCoMFA60.7210.4500.92564.9770.0000.991CoMSIA60.8240.3230.961113.1570.0000.989模型Model场贡献 ContributionsS hE iH jD kA lCoMFA0.5660.434---CoMSIA0.1800.1910.1640.2940.171
注:a 最佳主成分数,b 留一法(LOO)交叉验证相关系数,c 估计标准误差,d 非交叉验证相关系数,e F检验值,f r2的概率,g 测试集的预测相关系数,h 空间场,i 静电场,j H疏水场,k 氢键供体场,l 氢键受体场。
Note: a Optimum number of components, b Leave-one-out (LOO) cross-validated correlation coefficient, c Standard error of estimate, d Noncross-validated correlation coefficient, e F-test value, f Probability of r2, g Predicted correlation coefficient for the test set, h Steric field, i Electrostatic field, j Hydrophobic field, k H-bond donor field, and l H-bond acceptor field.
基于CoMFA和CoMSIA模型预测得到的pRBA与通过实验测定的活性值进行了相关性分析,二者相关性系数分别为0.991和0.989。优良的线性相关性(r2均>0.9)再次证明了这2种模型均具有良好的预测能力(图2)。

图2 CoMFA(a)和CoMSIA(b)模型预测logRBA值与实验值的相关性
注:RBA表示相对亲和力。
Fig. 2 CoMFA (a) and CoMSIA (b) models predict the correlation between the logRBA value and the experimental value
Note: RBA means relative binding affinity.
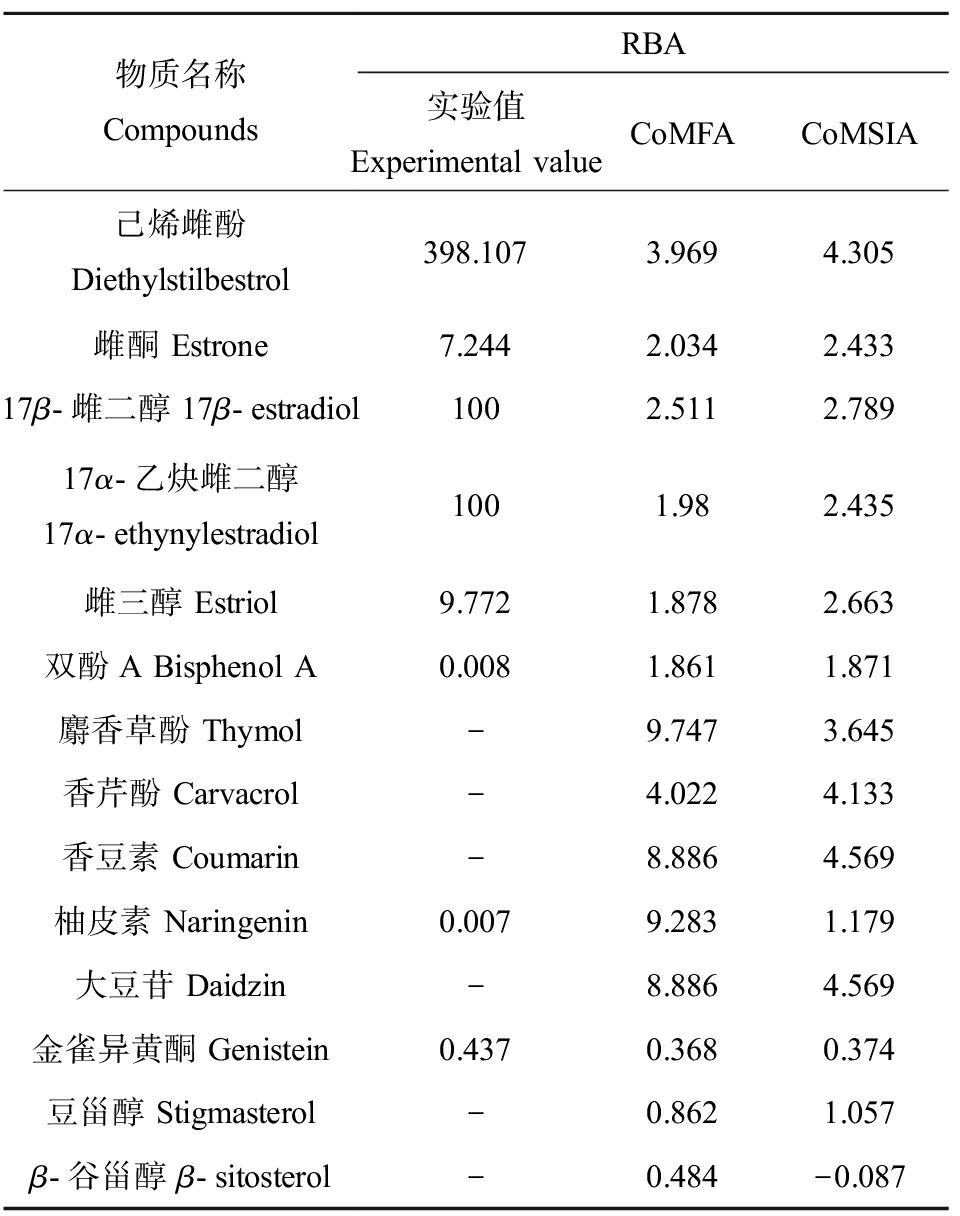
本研究使用该模型得到所检测的13种雌激素的RBA预测值如表2所示。
由表2可知,该模型较适合用于预测RBA值较低的植物雌激素,后续评估具有RBA实验值的雌激素使用实验值;无RBA实验值的雌激素使用CoMSIA预测值,β-谷甾醇使用CoMFA预测值。
表2 13种雌激素的RBA实验值与预测值
Table 2 RBA experimental and predicted values of 13 estrogens

物质名称CompoundsRBA实验值Experimental valueCoMFACoMSIA己烯雌酚 Diethylstilbestrol398.1073.9694.305雌酮 Estrone7.2442.0342.43317β-雌二醇 17β-estradiol1002.5112.78917α-乙炔雌二醇 17α-ethynylestradiol1001.982.435雌三醇 Estriol9.7721.8782.663双酚A Bisphenol A0.0081.8611.871麝香草酚 Thymol-9.7473.645香芹酚 Carvacrol-4.0224.133香豆素 Coumarin-8.8864.569柚皮素 Naringenin0.0079.2831.179大豆苷 Daidzin-8.8864.569金雀异黄酮 Genistein0.4370.3680.374豆甾醇 Stigmasterol-0.8621.057β-谷甾醇 β-sitosterol-0.484-0.087
2.2 猪饲料与猪肉中雌激素含量
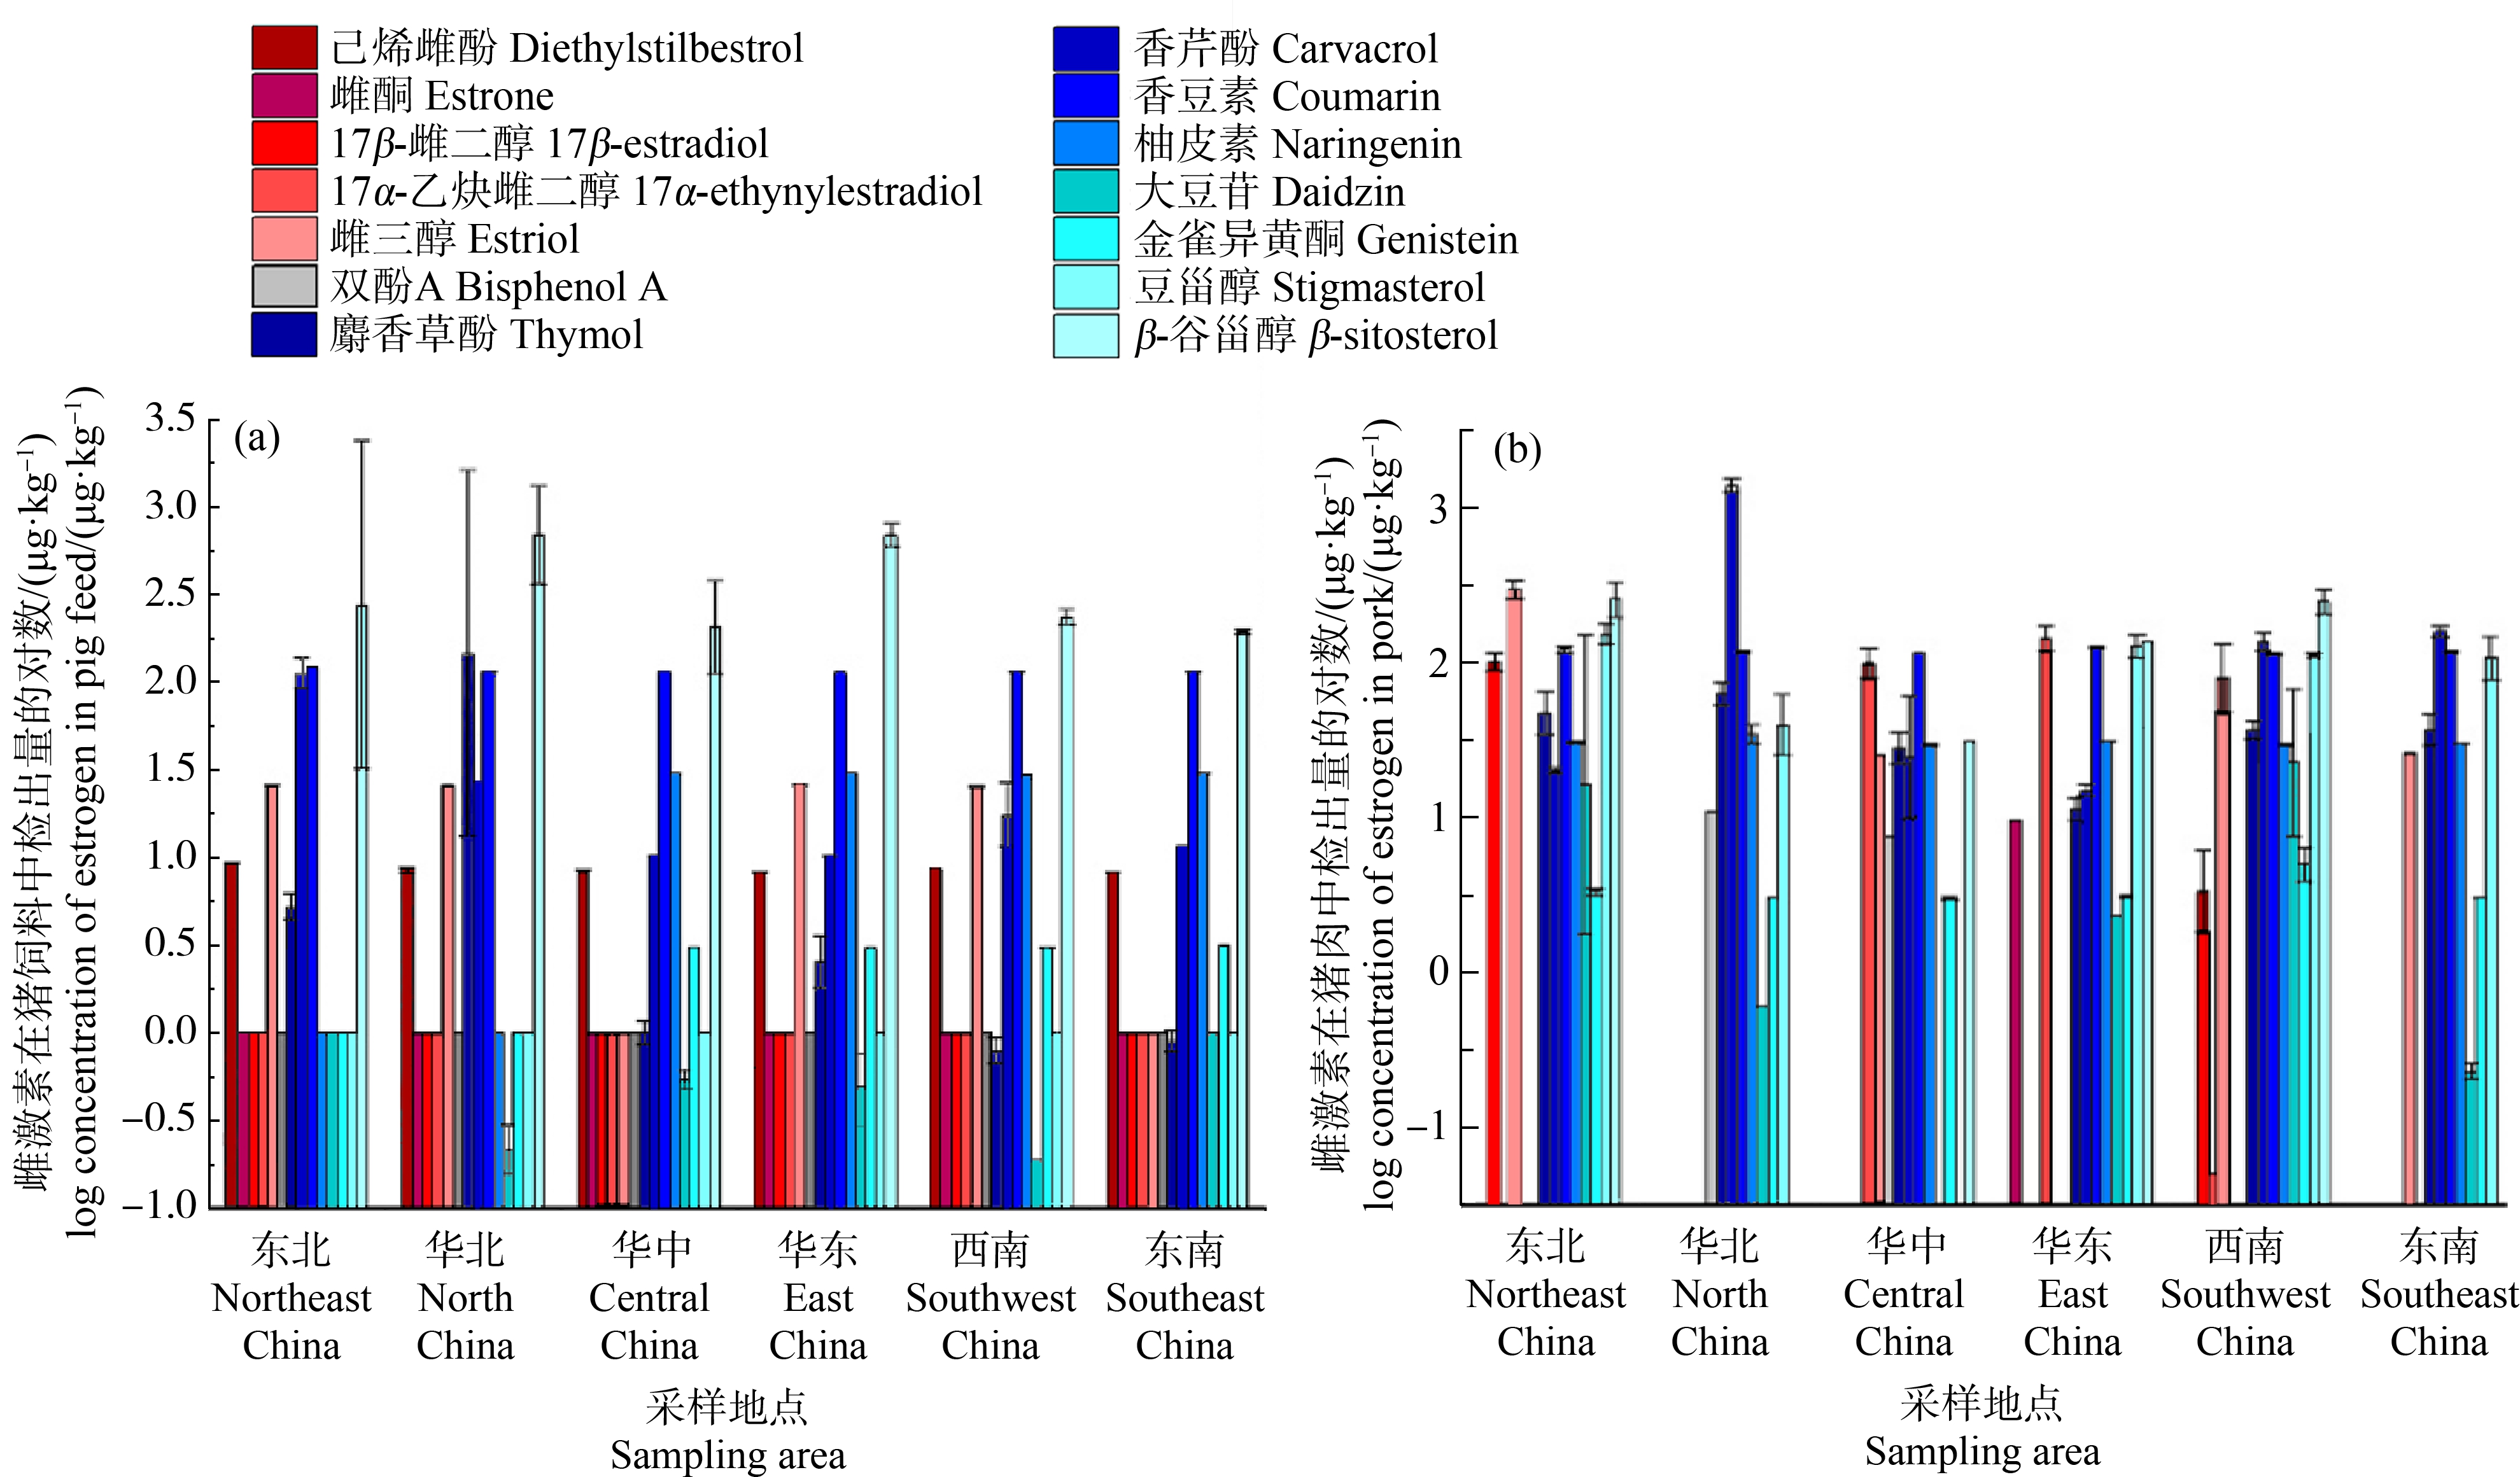
在代表我国东北地区、华北地区、华中地区、华东地区、东南地区和西南地区的猪饲料以及猪肉样品中均有不同程度检出天然雌激素以及植物雌激素(图3)。
其中植物雌激素在猪饲料和猪肉中检出率较高,为75%和92%;天然雌激素在猪饲料和猪肉中检出率较低,均为33%;合成雌激素在猪饲料中未检出,在猪肉中检出率为33%。利用饲料和肉中植物雌激素浓度计算得出,植物雌激素从猪饲料到猪肉中的生物富集系数(bioconcentration factor, BCF)为0.27~8.2。
2.3 猪肉雌激素效应评估
从《2020中国卫生健康统计年鉴》中的城乡居民膳食结构以及城乡居民每人每日食物摄入量得到猪肉的每日摄入量数据为89.6 g;参照标准人定义(体质量63 kg,年龄18~45岁,从事轻体力劳动的成年男性),算出各雌激素每日暴露量如表3所示[22]。
猪肉中雌激素的每日暴露量(E)=

图3 我国各地区猪饲料(a)与猪肉(b)中雌激素检出量
Fig. 3 Concentration of estrogens in pig feed (a) and pork (b) in China

图4 猪饲料(a)与猪肉(b)中各雌激素对雌激素当量(EEQ)的贡献
Fig. 4 Contribution of estrogen in pig feed and pork to total estrogen equivalence quotient (EEQ)
一般来说,雌激素的雌激素作用是由它的浓度和雌激素效力决定的,这可以用雌激素当量(estrogen equivalence quotient, EEQ)反映[23],计算公式如下:
EEQ=RBAi×Ci
式中:RBAi表示某个雌激素的相对结合亲和力,Ci是猪肉中该雌激素的浓度。各雌激素对总雌激素效应的贡献EEQ如图4所示。
由图4可知,猪饲料中天然雌激素贡献的总雌激素当量较高;猪肉中植物雌激素贡献的总雌激素当量较高,因此植物雌激素的雌激素效应不可忽视,尤其是香芹酚、香豆素和β-谷甾醇贡献的EEQ较高,应引起重视。
猪肉中雌激素风险指数的计算,参照食品中化学物质风险评估的原则和方法,对毒性效应有阈值的化学物质,选用毒理学上描述危害特征的毒性参数与膳食暴露量的估计值比较来进行风险评估,计算公式如下:
RI=E/ADI
式中:RI为环境雌激素的风险指数,E为环境雌激素的每日暴露量,ADI为环境雌激素的每日容许摄入量。若RI≤1,则说明该雌激素的暴露风险在可接受范围内;若RI>1,则说明该雌激素有健康风险。
欧洲食品安全局(EPSA)以及世界卫生组织(WHO)给出了部分雌激素的ADI,17β-雌二醇为0.05 μg·kg-1·d-1,双酚A为50 μg·kg-1·d-1。其他未给出ADI的物质可通过使用预测的RBA值进行估算。
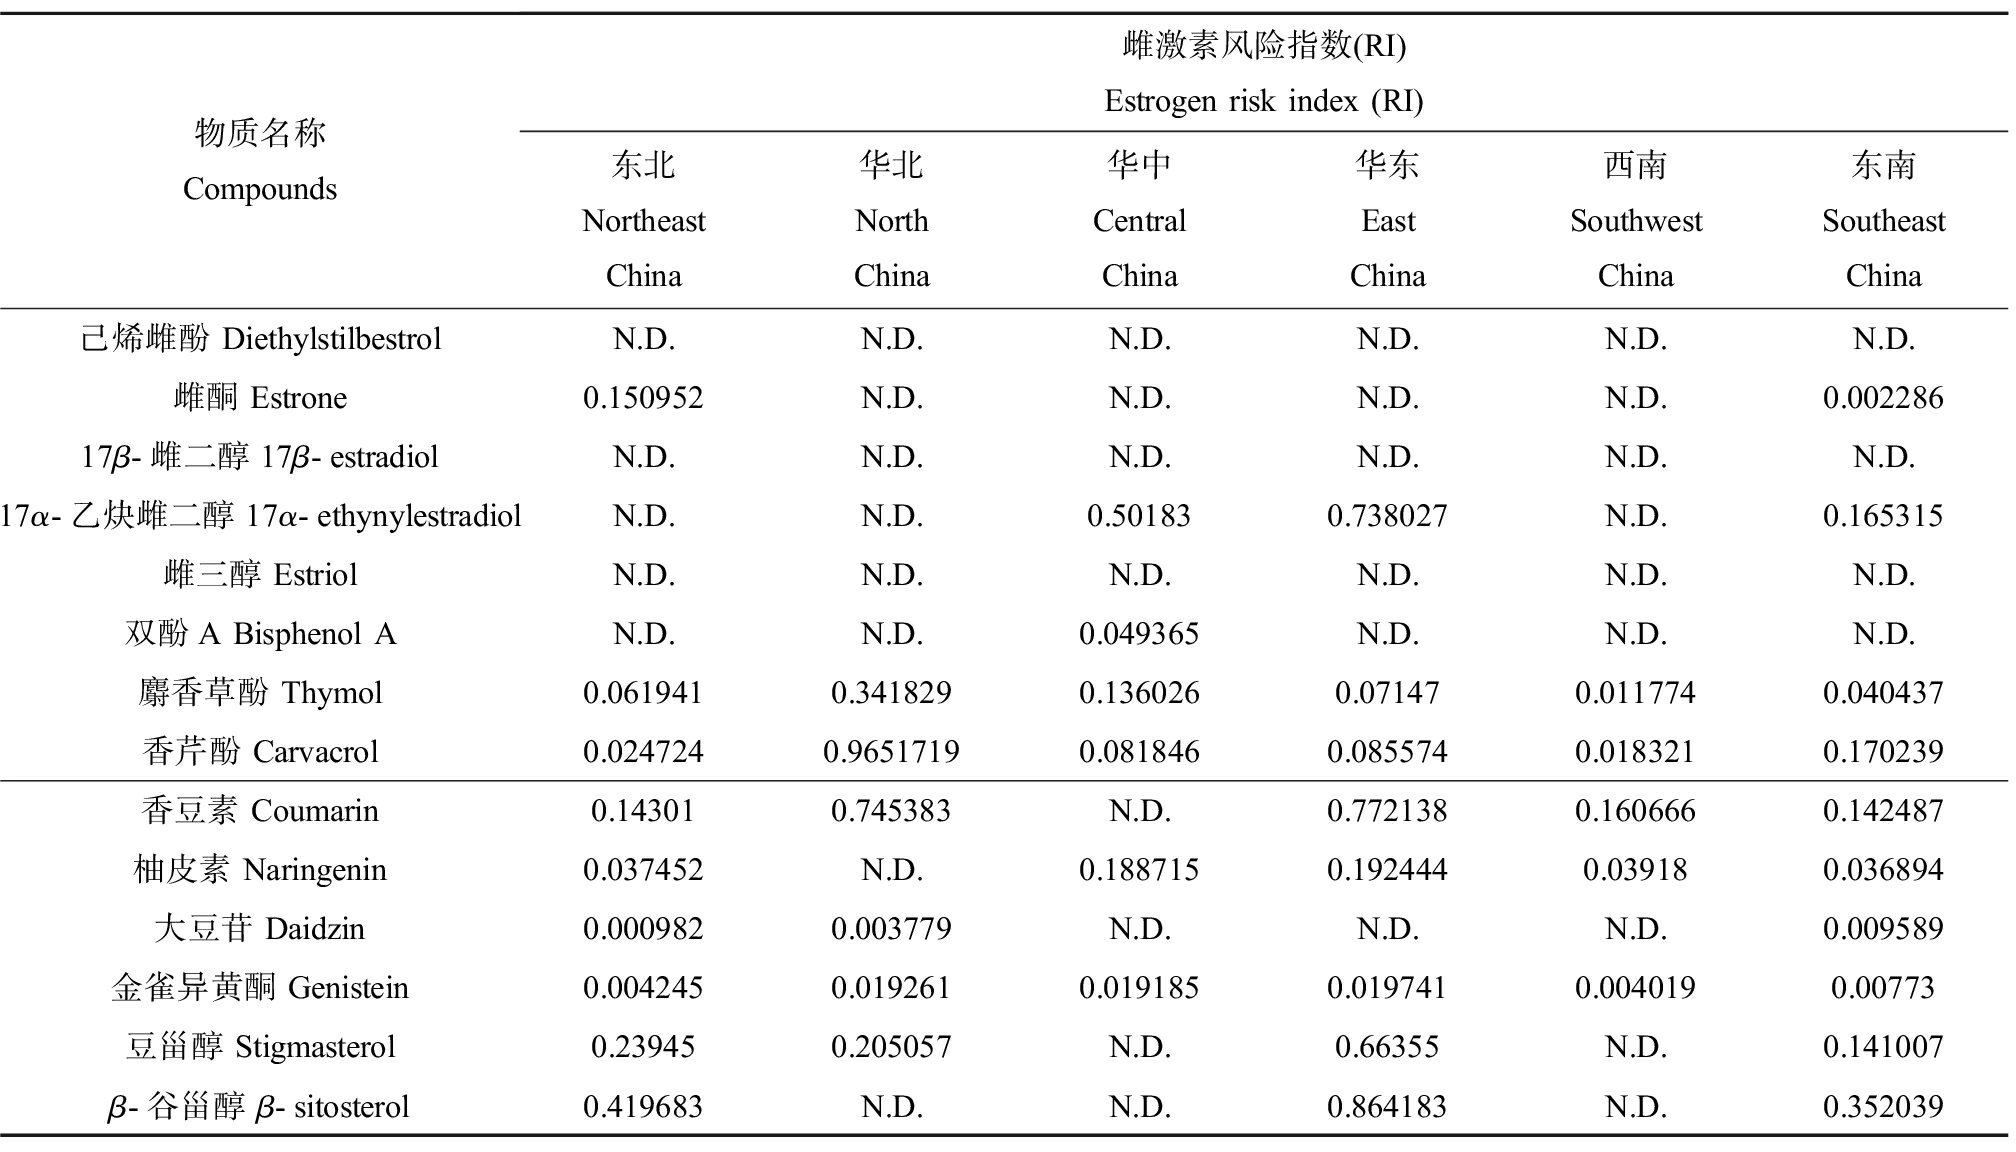
通过计算得出各物质雌激素RI如表4所示。可见各地区猪肉中各物质RI均<1,可以安全食用,但有部分物质RI值接近于1,若猪肉摄入量高于平均值则仍有雌激素效应风险。
表3 各地区猪肉中雌激素每日暴露量
Table 3 Daily exposure to estrogen in pork in various regions

物质名称Compounds雌激素每日暴露量/(μg·kg-1·d-1)Daily exposure to estrogen/(μg·kg-1·d-1)东北 Northeast China华北North China华中Central China华东East China西南Southwest China东南Southeast China己烯雌酚 DiethylstilbestrolN.D.N.D.N.D.N.D.N.D.N.D.雌酮 Estrone0.001896N.D.N.D.N.D.N.D.2.87E-0517β-雌二醇 17β-estradiolN.D.N.D.N.D.N.D.N.D.N.D.17α-乙炔雌二醇 17α-ethynylestradiolN.D.N.D.0.0063030.009269N.D.0.002076雌三醇 EstriolN.D.N.D.N.D.N.D.N.D.N.D.双酚A Bisphenol AN.D.N.D.0.00062N.D.N.D.N.D.麝香草酚 Thymol0.0007780.0042930.0017080.0008980.0001480.000508香芹酚 Carvacrol0.0003110.121220.0010280.0010750.000230.002138香豆素 Coumarin0.0017960.009362N.D.0.0096980.0020180.00179柚皮素 Naringenin0.00047N.D.0.002370.0024170.0004920.000463大豆苷 Daidzin1.23E-054.75E-05N.D.N.D.N.D.0.00012金雀异黄酮 Genistein5.33E-050.0002420.0002410.0002485.05E-059.71E-05豆甾醇 Stigmasterol0.0030070.002575N.D.0.008334N.D.0.001771β-谷甾醇 β-sitosterol0.005271N.D.N.D.0.010854N.D.0.004421
注:N.D.表示未检出。
Note: N.D. represents not detected.
表4 各地区猪肉中雌激素风险指数(RI)
Table 4 Estrogen risk index (RI) in pork from different region

物质名称Compounds雌激素风险指数(RI)Estrogen risk index (RI)东北 Northeast China华北North China华中Central China华东East China西南Southwest China东南Southeast China己烯雌酚 DiethylstilbestrolN.D.N.D.N.D.N.D.N.D.N.D.雌酮 Estrone0.150952N.D.N.D.N.D.N.D.0.00228617β-雌二醇 17β-estradiolN.D.N.D.N.D.N.D.N.D.N.D.17α-乙炔雌二醇 17α-ethynylestradiolN.D.N.D.0.501830.738027N.D.0.165315雌三醇 EstriolN.D.N.D.N.D.N.D.N.D.N.D.双酚A Bisphenol AN.D.N.D.0.049365N.D.N.D.N.D.麝香草酚 Thymol0.0619410.3418290.1360260.071470.0117740.040437香芹酚 Carvacrol0.0247240.96517190.0818460.0855740.0183210.170239香豆素 Coumarin0.143010.745383N.D.0.7721380.1606660.142487柚皮素 Naringenin0.037452N.D.0.1887150.1924440.039180.036894大豆苷 Daidzin0.0009820.003779N.D.N.D.N.D.0.009589金雀异黄酮 Genistein0.0042450.0192610.0191850.0197410.0040190.00773豆甾醇 Stigmasterol0.239450.205057N.D.0.66355N.D.0.141007β-谷甾醇 β-sitosterol0.419683N.D.N.D.0.864183N.D.0.352039
注:N.D.表示未检出。
Note: N.D. represents not detected.
[1] Boberg J, Mandrup K R, Jacobsen P R, et al. Endocrine disrupting effects in rats perinatally exposed to a dietary relevant mixture of phytoestrogens [J]. Reproductive Toxicology, 2013, 40: 41-51
[2] Heras-González L, Latorre J A, Martinez-Bebia M, et al. The relationship of obesity with lifestyle and dietary exposure to endocrine-disrupting chemicals [J]. Food and Chemical Toxicology, 2020, 136: 110983
[3] Emara Y, Fantke P, Judson R, et al. Integrating endocrine-related health effects into comparative human toxicity characterization [J]. Science of the Total Environment, 2021, 762: 143874
[4] Fleck S C, Churchwell M I, Doerge D R, et al. Urine and serum biomonitoring of exposure to environmental estrogens Ⅱ: Soy isoflavones and zearalenone in pregnant women [J]. Food and Chemical Toxicology, 2016, 95: 19-27
[5] Robles J, Marcos J, Renau N, et al. Quantifying endogenous androgens, estrogens, pregnenolone and progesterone metabolites in human urine by gas chromatography tandem mass spectrometry [J]. Talanta, 2017, 169: 20-29
[6] Huang J, Sun J H, Chen Y H, et al. Analysis of multiplex endogenous estrogen metabolites in human urine using ultra-fast liquid chromatography-tandem mass spectrometry: A case study for breast cancer [J]. Analytica Chimica Acta, 2012, 711: 60-68
[7] Adlercreutz H, Kiuru P, Rasku S, et al. An isotope dilution gas chromatographic-mass spectrometric method for the simultaneous assay of estrogens and phytoestrogens in urine [J]. The Journal of Steroid Biochemistry and Molecular Biology, 2004, 92(5): 399-411
[8] Foster W G, Kubwabo C, Kosarac I, et al. Free bisphenol A (BPA), BPA-glucuronide (BPA-G), and total BPA concentrations in maternal serum and urine during pregnancy and umbilical cord blood at delivery [J]. Emerging Contaminants, 2019, 5: 279-287
[9] Lacroix M Z, Puel S, Collet S H, et al. Simultaneous quantification of bisphenol A and its glucuronide metabolite (BPA-G) in plasma and urine: Applicability to toxicokinetic investigations [J]. Talanta, 2011, 85(4): 2053-2059
[10] Mustafa A M, Malintan N T, Seelan S, et al. Phytoestrogens levels determination in the cord blood from Malaysia rural and urban populations [J]. Toxicology and Applied Pharmacology, 2007, 222(1): 25-32
[11] Prasain J K, Arabshahi A, Moore D R Ⅱ, et al. Simultaneous determination of 11 phytoestrogens in human serum using a 2 min liquid chromatography/tandem mass spectrometry method [J]. Journal of Chromatography B, 2010, 878(13-14): 994-1002
[12] Wyns C, Bolca S, de Keukeleire D, et al. Development of a high-throughput LC/APCI-MS method for the determination of thirteen phytoestrogens including gut microbial metabolites in human urine and serum [J]. Journal of Chromatography B, 2010, 878(13-14): 949-956
[13] 黄斌, 潘学军, 万幸, 等. 固相萃取-衍生化-气相色谱/质谱测定水中类固醇类环境内分泌干扰物[J]. 分析化学, 2011, 39(4): 449-454
Huang B, Pan X J, Wan X, et al. Simultaneous determination of steroid endocrine disrupting chemicals in water by solid phase extraction-derivatization gas chromatography-mass spectrometry [J]. Chinese Journal of Analytical Chemistry, 2011, 39(4): 449-454 (in Chinese)
[14] Lee S H, Jung B H, Kim S Y, et al. Determination of phytoestrogens in traditional medicinal herbs using gas chromatography-mass spectrometry [J]. The Journal of Nutritional Biochemistry, 2004, 15(8): 452-460
[15] Benedetti B, di Carro M, Mirasole C, et al. Fast derivatization procedure for the analysis of phytoestrogens in soy milk by gas chromatography tandem mass spectrometry [J]. Microchemical Journal, 2018, 137: 62-70
[16] Gray S L, Lackey B R. Optimizing a recombinant estrogen receptor binding assay for analysis of herbal extracts [J]. Journal of Herbal Medicine, 2019, 15: 100252
[17] Cotterill J V, Palazzolo L, Ridgway C, et al. Predicting estrogen receptor binding of chemicals using a suite of in silico methods - Complementary approaches of (Q)SAR, molecular docking and molecular dynamics [J]. Toxicology and Applied Pharmacology, 2019, 378: 114630
[18] He J Y, Peng T, Yang X H, et al. Development of QSAR models for predicting the binding affinity of endocrine disrupting chemicals to eight fish estrogen receptor [J]. Ecotoxicology and Environmental Safety, 2018, 148: 211-219
[19] 胡海山, 赵淑娥, 芦慧, 等. QuEChERS-超高效液相色谱法快速测定果蔬中4种植物激素残留[J]. 食品安全质量检测学报, 2019, 10(10): 2995-2999
Hu H S, Zhao S E, Lu H, et al. Rapid determination of 4 kinds of phytohormone residues in fruits and vegetables by QuEChERS-ultra performance liquid chromatography [J]. Journal of Food Safety & Quality, 2019, 10(10): 2995-2999 (in Chinese)
[20] United States Environmental Protection Agency (US EPA). CompTox, U.S. Environmental Protection Agency [DB]. [2021-10-5]. https://comptox.epa.gov/dashboard/predictions/index
[21] National Center for Biotechnology Information. PubChem, National Center for Biotechnology Information [DB]. [2021-09-21]. https://pubchem.ncbi.nlm.nih.gov/
[22] 赵娜娜, 应力, 孙方云, 等. 温州市食品环境雌激素污染状况及风险评估[J]. 温州医科大学学报, 2014, 44(3): 173-176
Zhao N N, Ying L, Sun F Y, et al. Contamination levels of environmental estrogens in foods and risk assessment in Wenzhou [J]. Journal of Wenzhou Medical University, 2014, 44(3): 173-176 (in Chinese)
[23] Tang Z, Wan Y P, Liu Z H, et al. Twelve natural estrogens in urines of swine and cattle: Concentration profiles and importance of eight less-studied [J]. Science of the Total Environment, 2022, 803: 150042