-
近年来,尽管我国大气污染状况整体有所改善,但大部分城市细颗粒物(PM2.5)污染问题仍未解决[1],尤其是采暖季区域性重污染天气频发[2],二次成分污染严重[3-4]。文献研究表明,PM2.5主要受人为活动和工业生产的影响,在华中、华北、苏北地区污染程度较高[5]。2019年中国生态环境状况公报[6]表明,京津冀周边地区“2+26”城市空气质量超标天中,以PM2.5为首要污染物的天数占比42.9% 。因此,PM2.5仍是我国大中城市大气环境的主要污染物之一,PM2.5成分复杂,主要有水溶性离子Na+、K+、Mg2+、Ca2+、Cl−、硫酸盐(SO42−)、硝酸盐(NO3−)、有机碳(OC)、元素碳(EC)、重金属等。PM2.5不仅对环境、气候、人体健康造成危害[7-10],会引发人体呼吸系统和心脑血管疾病[11],而且会降低大气能见度[12],形成雾霾天气。
2020年1月新型冠状病毒(COVID-19)疫情开始在我国传播,为控制疫情和感染,全国各地启动实施一级响应措施,人们居家办公,人为污染源排放量、移动源和轻工业活动水平大幅削减[13]。为了解疫情管控政策对空气质量的影响[14-15],国内外学者对不同城市环境空气质量做了大量的研究,发现疫情管控政策对颗粒物(PM10和PM2. 5)、NO2、SO2及CO浓度削减较多,对Cl−、SO42−、Na +和Ca2 +的昼夜变化影响较大[16]。利用相关模式对空气质量影响的模拟研究表明,一次污染物对减排响应较敏感,二次污染物对减排响应有一定时滞性且易受气象因素影响[17],如疫情期间NOx向NO3−转化的能力并未削减,颗粒物减排在削减一次排放的同时也要控制组分的前体物[18]。目前大量研究主要围绕疫情减排情景下空气质量状况和6项常规污染物(PM10、PM2.5、NO2、SO2、CO、O3)浓度变化,但对于疫情管控影响下长时间序列PM2.5中的组分变化研究没有文献报道,且气象因素和人为因素对空气质量状况均有较大影响,因此需要结合气象因素对疫情管控影响下的PM2.5及组分浓度变化进行详细分析。
济南是“京津冀及周边2+26”重要通道城市之一,作为我国华北地区城市,济南市大气污染受采暖季燃煤取暖影响较大[19],采暖季灰霾天气频发,容易对周边地区造成影响,引起区域性重污染天气。本文基于济南市2019年11月1日—2020年3月31日的在线监测数据,通过对比疫情管控前(2019年11月1日—2020年1月24日)和疫情管控后(2020年1月25日—2020年3月31日)两个时段PM2.5中组分变化,结合气象因素分析2020年春节疫情管控下济南市PM2.5中组分变化,研究结果将对济南市PM2.5污染防控和减排方案提供理论指导意义。
-
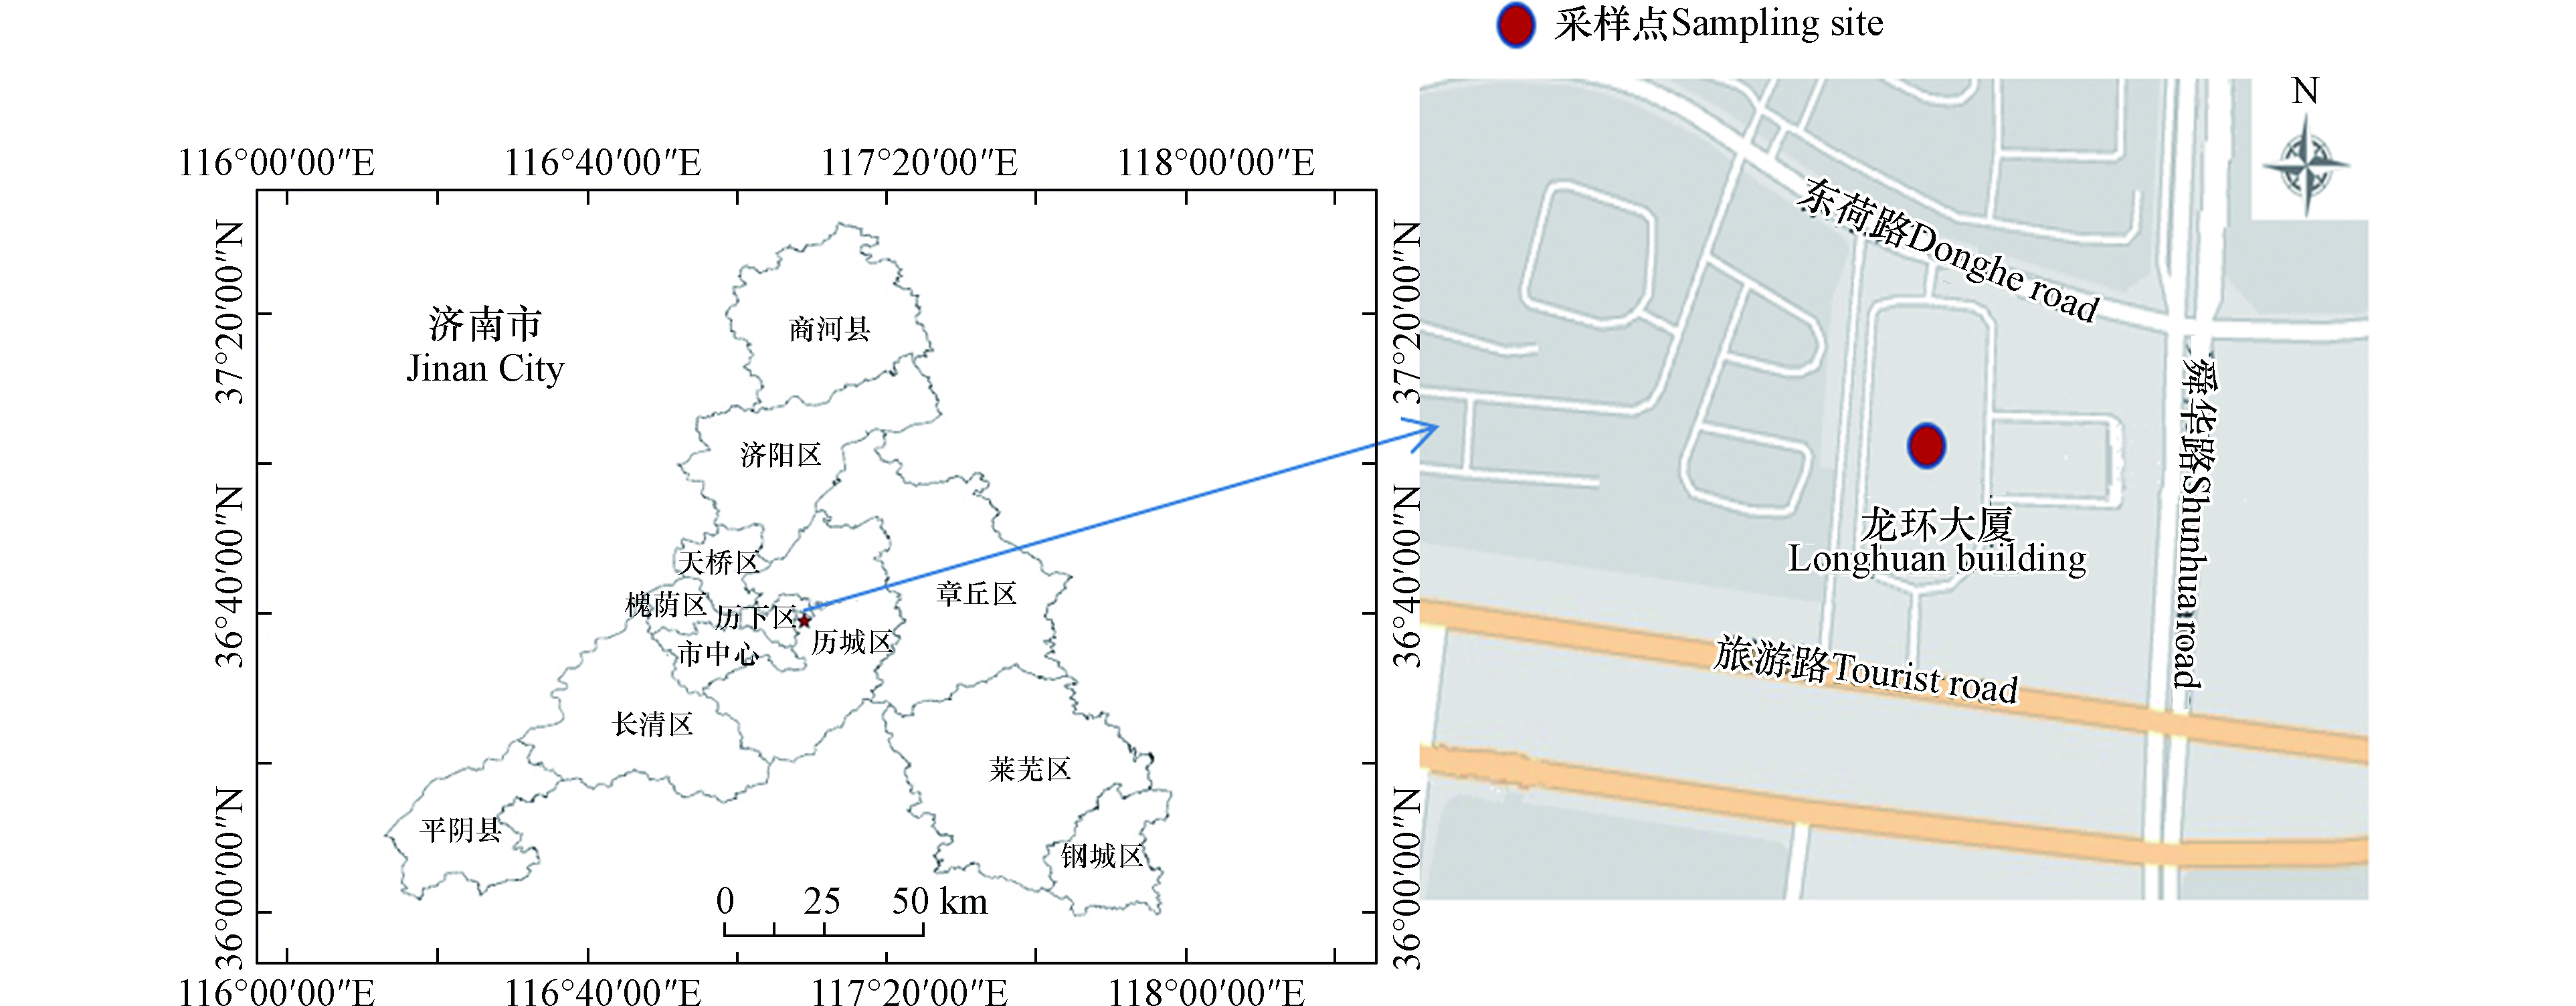
采样地点(图1)为龙环大厦山东省济南生态环境监测中心院内(E117.15°,N36.65°),位于济南市区舜华南路与旅游路交叉口附近西侧,采样头距离地面7 m左右。监测点南侧紧邻旅游路,东侧距离舜华南路30 m,均为城市主干道,监测点周围主要为办公区域,周围无明显工业源。采样为24 h连续自动在线采集小时浓度,采样时间为2019年11月1日至2020年3月31日。
-
采用PM2.5自动监测仪(MetOne,BAM 1020)、气溶胶在线离子色谱仪(台湾张嘉有限公司,S-611 C)、气溶胶有机碳元素碳监测仪(先河环保科技有限公司,Model 4)、大气重金属X射线荧光光谱在线监测仪(先河环保科技有限公司,XHAM-2000 A)分别进行PM2.5浓度及其离子(NO3−、SO42−、NH4+)、碳组分(OC,EC)和金属元素(铅、硒、汞、铬、镉、锌、铜、镍、铁、锰、钛、锑、锡、钒、钡、砷、钙、钾、钴、银、铊、镓、硅、金、铝等24种元素)等组分的在线快速分析,获得每小时颗粒物浓度及组分浓度数据;常规污染物(NO、NO2、SO2)数据和气象数据(相对湿度和风速)参考采样点位邻近的例行监测站点数据,NH3数据通过测定的离子含量换算得到,大气边界层高度PBL由激光雷达EV-LIDAR监测。
-
气溶胶在线离子色谱仪采用外标法制作标准曲线,标准溶液浓度分别为0.005、0.01、0.02、0.05、0.1、0.2、0.5、1 mg·L−1,每月绘制一次校准曲线,所有目标物相关系数R≥0.995。当仪器更换定量环、色谱柱、抑制器等核心部件后,重新进行标准曲线校准。每2周使用去离子水(≥18 MΩ.cm)检查仪器基线与空白响应情况,如任一目标物响应高于方法检出限,及时排查后重新进行测试。每周进行一次标准曲线中间浓度点核查,所有目标物核查结果与标准曲线相应点的理论浓度值相对误差应小于±10%,否则重新进行标准曲线校准。每月进行一次采样流量核查,使用经过计量检定的标准流量计对设备流量进行检查,如流量偏差超过±5%,则进行校准。
气溶胶有机碳/元素碳监测仪采用浓度为2.1 μg·μL−1的标准蔗糖溶液,分别注射2、4、6、8、10 μL的溶液制作蔗糖标准曲线,每季度做1次,相关系数R≥0.995;当仪器更换核心部件后,重新进行标准曲线校准。每周用10 μL的2.1 μg·μL−1的标准蔗糖溶液进行单点标定,误差控制在±10%以内。每月进行1次采样流量校核,使用经过计量检定的标准流量计对设备流量进行检查,如流量偏差超过±15%,则进行校准。
大气重金属X射线荧光光谱在线监测仪,采用Cr、Cd、Pb质控棒,质控棒实际测量值与标准偏差控制在±5%以内。并采用含24种金属元素的标准膜片进行质控,测量值与标准值的相对误差控制在±5%以内。
PM2.5自动监测仪,每月进行标准膜片校准和切割头清洗,其余监测仪器每周进行采样流量检查和校准。
-
将PM2.5中矿物尘元素(KC)、有机物(OM)和微量元素(TE)进行化学质量重构,计算方法[20]见式(1)(2)(3)。
式中,c[KC]、c[OM]、c[TE]分别为矿物尘元素、有机物、微量元素的浓度(μg·m−3);其余均为相应元素的浓度(μg·m−3)。
-
硫氧化率(SOR)、氮氧化率(NOR)可表示SO2、NO2向SO42−、NO3−转化的程度,SOR、NOR越大,表示有更多的SO2、NO2转化为SO42−、NO3−。其计算方法见公式[21](4)和(5),铵盐转化率(NHR)可表示NH3向NH4+转化的程度[22],见公式(6)。
式中,c(SO42−)、c(NO3-)、c(NH4+)分别为SO42−、NO3−、NH4+的浓度(μg·m−3),c(SO2)、c(NO2)、c(NH3)分别为SO2、NO2、NH3的浓度(μg·m−3)。
-
二次有机碳(SOC)是由光化学反应和挥发性及半挥发性有机物的气-粒转化生成,采用OC/EC最小比值法进行PM2.5中SOC的定量估算,通过公式[23](7)计算二次有机碳的浓度
式中,c[SOC]为二次有机碳的质量浓度(μg·m−3),c[OC]为有机碳的质量浓度(μg·m−3),c[EC]为元素碳的质量浓度(μg·m−3),(OC/EC)min为采样期间所观测OC/EC最小值,经计算本文中(OC/EC)min取1.67。
-
运用SPSS统计分析软件,构建PM2.5浓度与各气象因子(相对湿度Z1、边界层高度Z2和风速Z3)的标准化多元线性回归方程,得到各气象因子的回归系数,进一步计算各气象因子对PM2.5浓度的相对贡献率,作为比较气象因子影响PM2.5浓度的指标。计算公式[24]见(8)和(9)。
式中,Y为PM2.5浓度的标准化值;Z1、Z2、Z3分别为各气象因子标准化后的值;
$ u $ 为随机误差项;a1、a2、a3分别为各气象因子序列标准化后对应的回归系数,回归系数越大,说明气象因子对PM2.5浓度的影响越大,ηi为Zi气象因子对PM2.5浓度的相对贡献率。其中,标准化的过程如下:设需要标准化处理的数据(PM2.5浓度Y、相对湿度Z1、边界层高度Z2和风速Z3)为序列
$ {{x}_{1},{x}_{2},\cdots ,x}_{n} $ ,则新序列
$ {{w}_{1},{w}_{2},\cdots ,w}_{n} $ 为原序列的标准化序列。 -
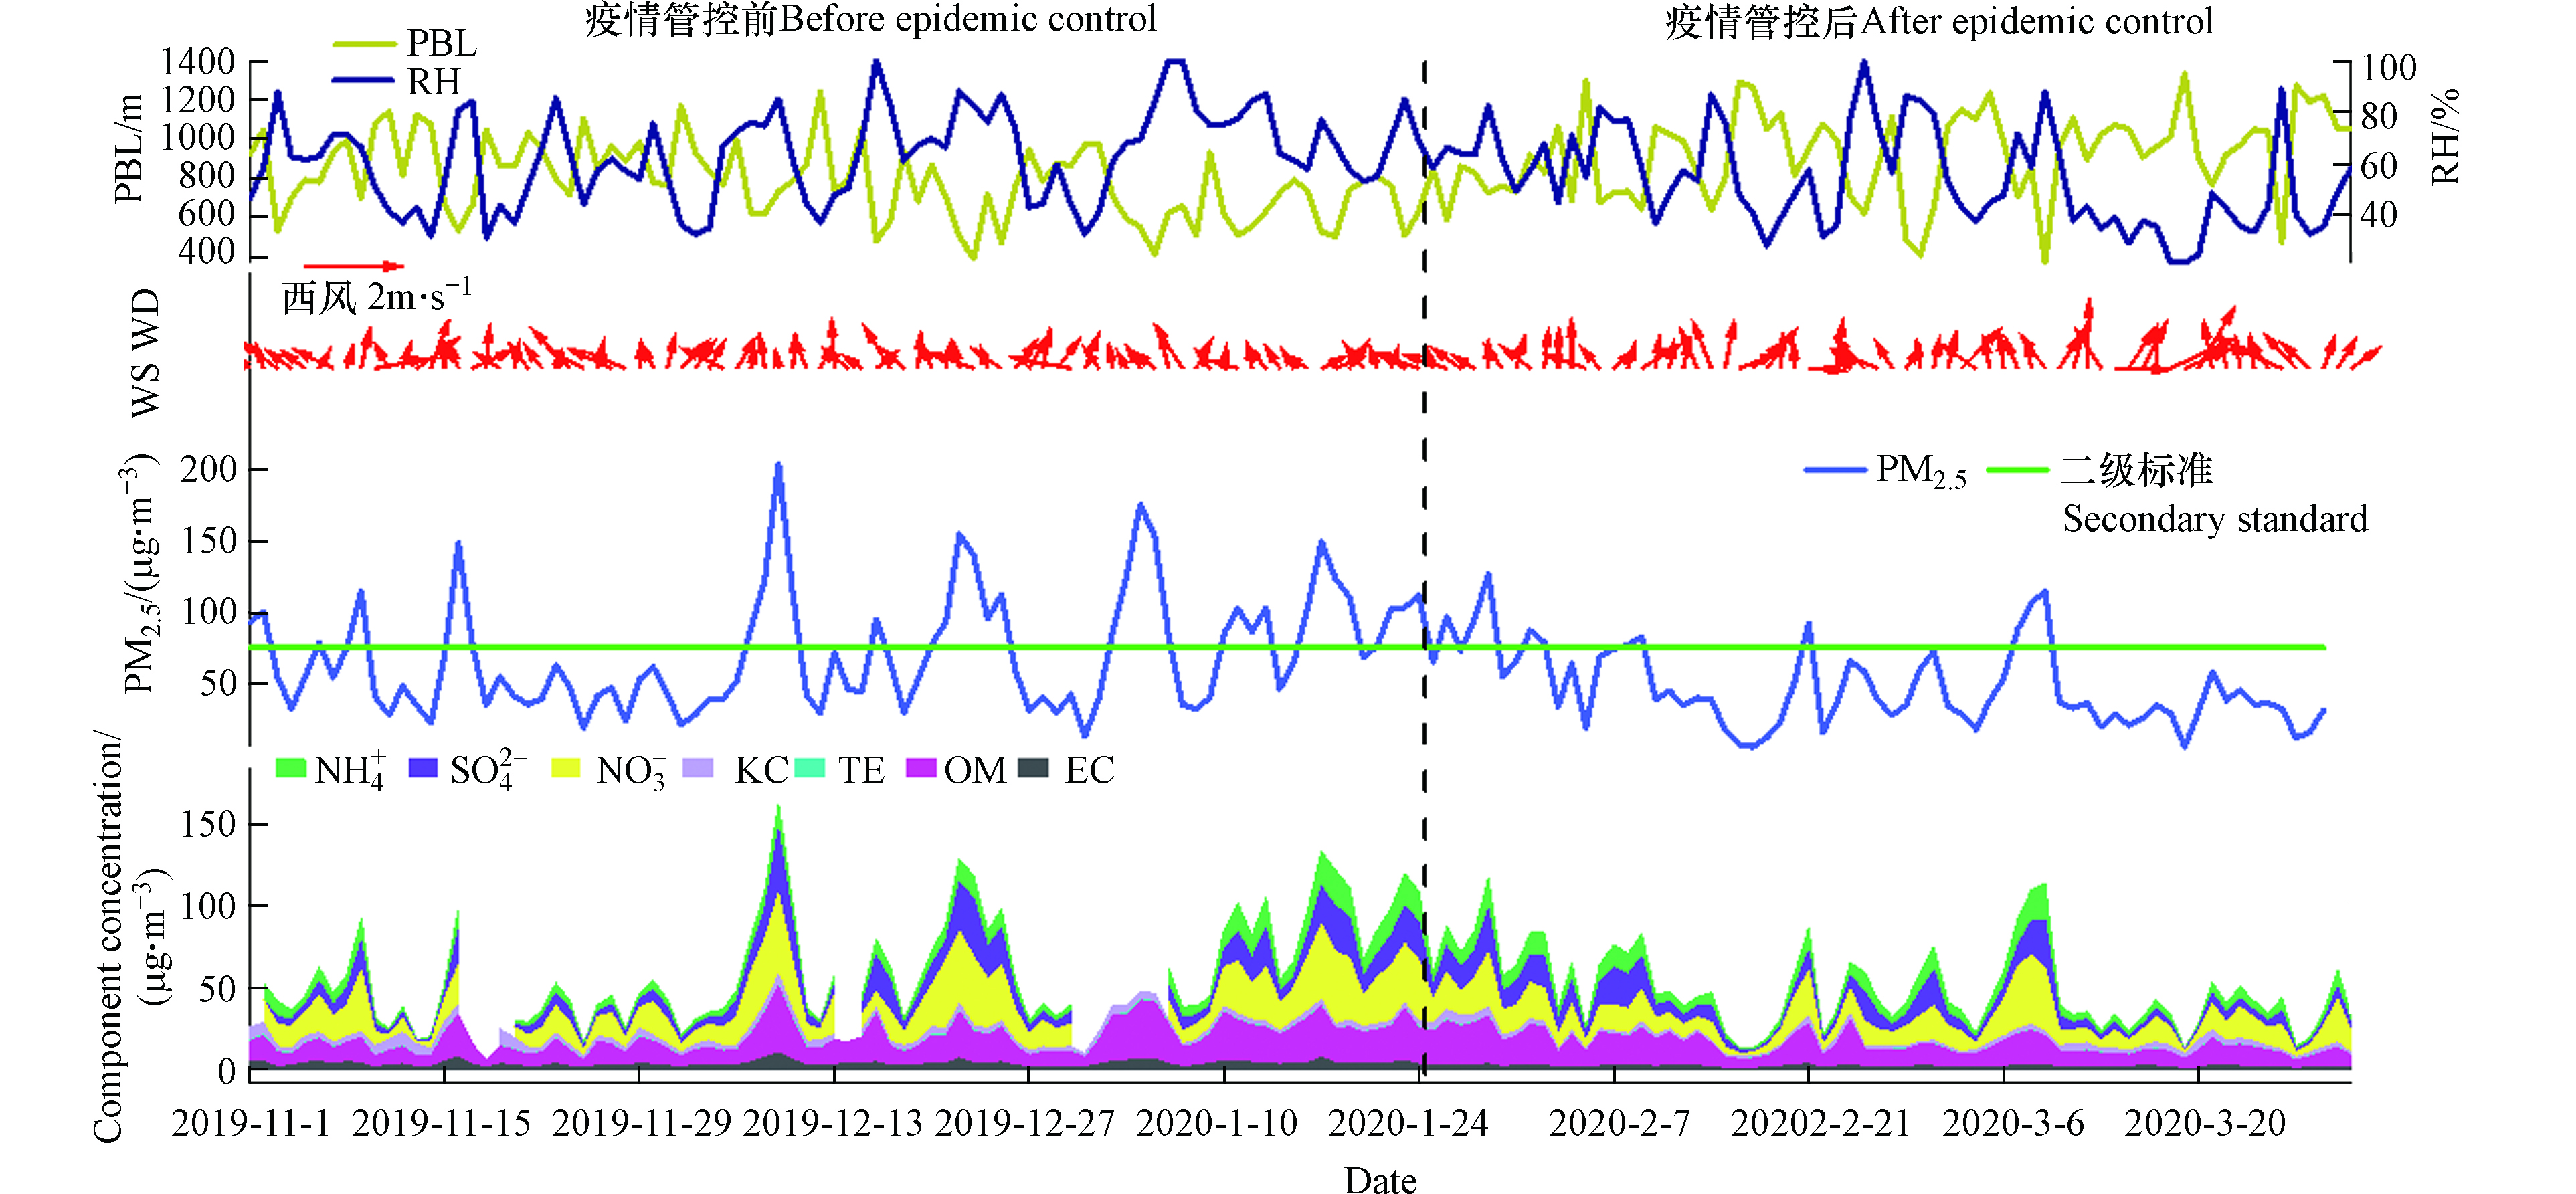
图2给出了济南市2019年11月1日—2020年3月31日PM2.5和组分浓度及气象因素日均变化.
可以看出疫情管控下2020年1月25日后PM2.5浓度大幅下降,超标天数明显减少,疫情管控后PM2.5平均浓度为(47.23±27.89)μg·m−3,有11 d超过我国《环境空气质量标准》(GB 3095-2012)中的PM2.5日均浓度二级标准(75 μg·m−3),超标率为16.4%,比管控前下降了24.8%。管控前后PM2.5组分中可明显看出,NO3−、OM、SO42−和NH4+占比均较大,3种二次离子SNA (SO42−、NO3−、NH4+)占比之和管控前后分别为56.9%和65.0%,疫情管控后二次组分占比高于疫情期间(2020年1月24—31日)安阳市(55.8%)和新乡市(53.0%),与郑州市(65.1%)基本持平[25];疫情管控后,PM2.5中二次组分占比增加较大的为SO42−、NH4+和OM,说明济南市PM2.5受燃煤源排放的影响并未降低。同时,在同样的大气边界层高度降低、风速较小、湿度较大等不利气象条件下,疫情管控后PM2.5浓度高值明显降低(43.8%);疫情管控前12月9日PM2.5浓度达到峰值204.08 μg·m−3,相对湿度高达85.1%,风速和大气边界层高度分别降低至0.44 m·s−1和735.52 m;而疫情管控后PM2.5浓度在3月9日较高114.63 μg·m−3,该日相对湿度高达88.1 %,且风速和大气边界层高度也降低至0.90 m·s−1和373.13 m,进一步说明在冬季遇不利气象条件下工地停工等重污染应急减排措施可起到消峰作用。
为进一步分析PM2.5中重构组分变化,对疫情管控前后PM2.5中组分浓度和占比进行对比(表1)。结果表明,疫情管控前PM2.5组分浓度从大到小顺序为NO3−、OM、SO42−、NH4+、KC、EC和TE, SNA 浓度较高,分别为11.48、20.43、7.65 μg·m−3。疫情管控后PM2.5中组分浓度均有所下降,其中TE、EC和NO3−浓度降幅较大,分别降低了50.3%、46.8%和31.5%。从PM2.5组分占比来看,疫情管控后,TE和EC在PM2.5中的占比减少,其他组分占比均有所升高,其中NH4+占比升高最多(37.1%),其次为OM占比升高(29.7%),SO42−占比升高(18.3%),NO3−占比变化较小。说明疫情管控影响下,济南市PM2.5一次排放的组分浓度削减较大,来自机动车尾气的NOX二次转化明显减少,但来自燃煤的SO2和NO2二次转化有所增强。
-
对采样期间济南市空气质量指数进行了统计分析,进一步对比疫情管控前后济南市空气质量变化。结果表明:疫情管控前(85 d),空气质量为优、良、轻度污染、中度污染和重度污染的天数分别为2、44、29、6、4 d,优良等级占比为54.1%,轻度污染等级占比达34.1%,中度和重度污染等级天数占比11.8%,济南市空气质量状况较差;而疫情管控后(67 d),空气质量为优、良、轻度污染和中度污染的天数分别为10、43、13、1 d,优良等级天数占比大幅增加(79.1%),增幅为25%,轻度污染和中度污染等级占比为20.9%,且无重度污染天,空气质量状况明显改善。
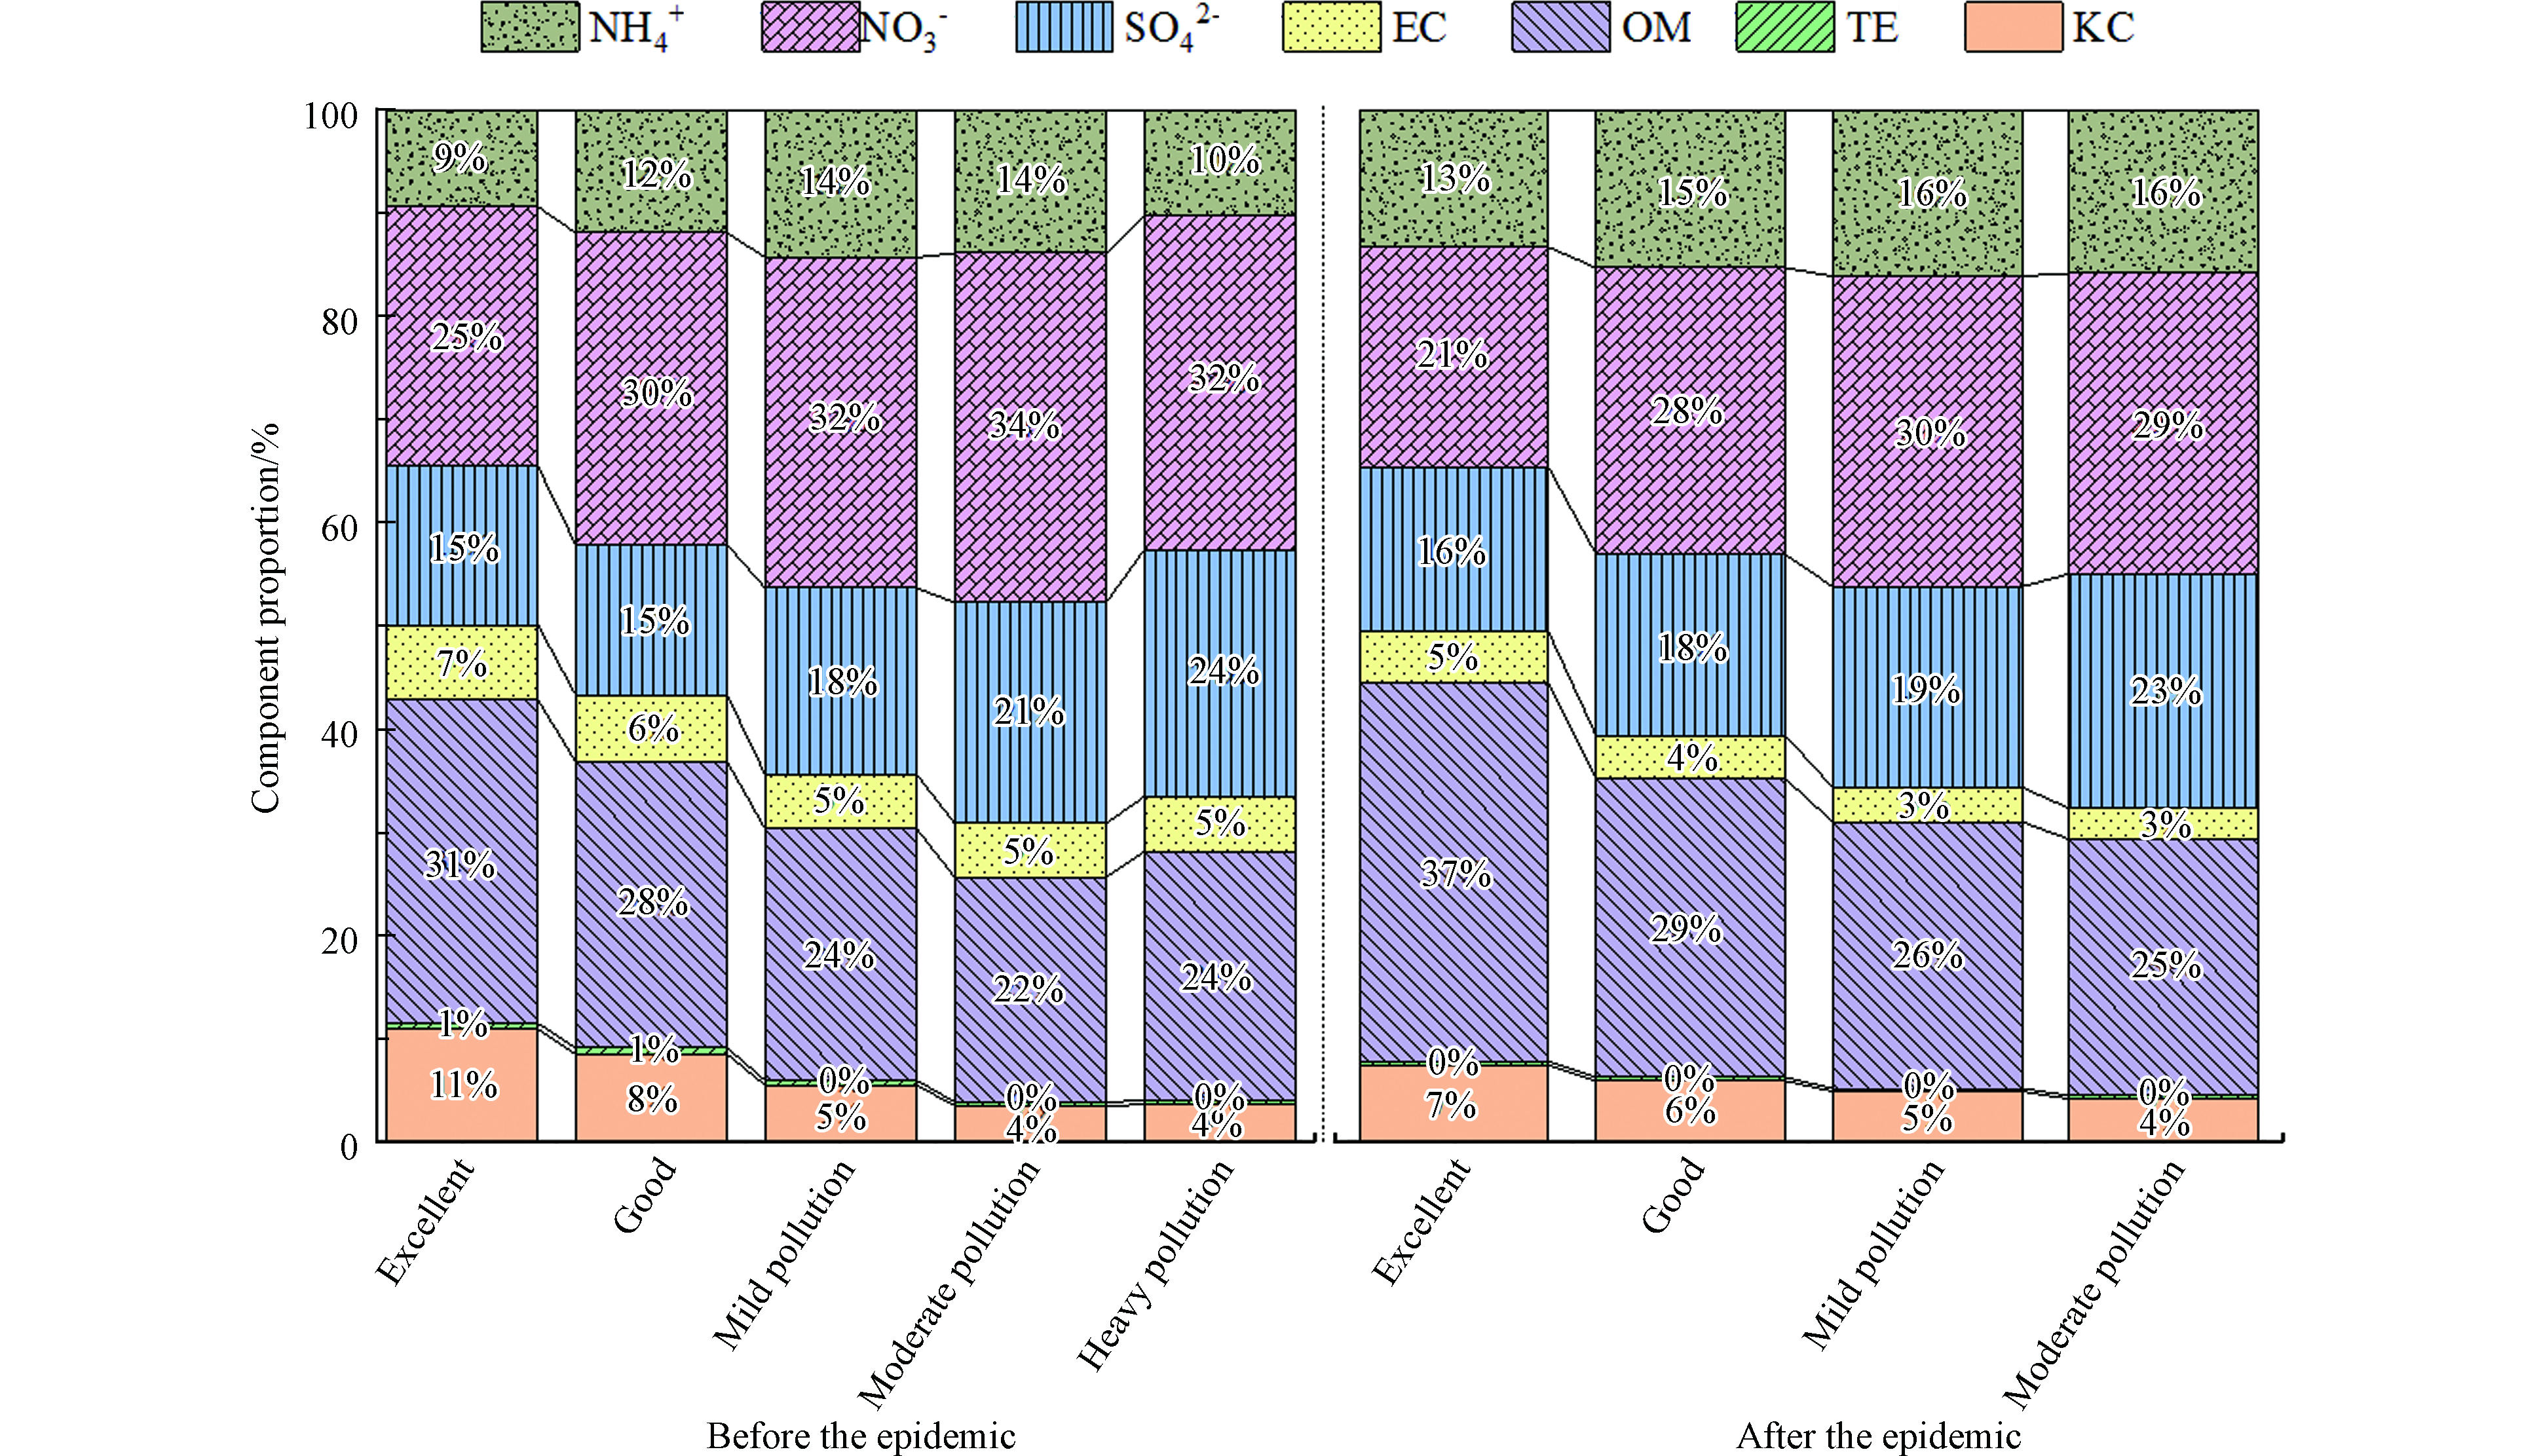
图3为疫情管控前后不同污染等级PM2.5中组分占比变化,结果表明,疫情管控后,轻度及以上污染等级PM2.5中NO3−和EC占比降低,而SO42−、OM和NH4+增加,尤其是OM,优天占比增加6%,说明冬季颗粒物浓度较低时,有机物更易转化;各污染等级下,TE和KC占比均降低。说明受疫情管控影响,市民出行减少,机动车排放降低,施工工地停工,对NO3−削减较大,而疫情管控后,因颗粒物浓度降低,VOCs二次转化增强,使OM含量升高。
PM2.5中的硫酸盐和硝酸盐主要来自于气粒转化,PM2.5中占比最高的NO3−、SO42−、NH4+的质量浓度取决于大气中SO2、NOx和NH3的含量,同时也受相对湿度、大气压、大气氧化能力及其他气象条件的影响。氮氧化率(NOR)和硫氧化率(SOR)可定量表示一次气态前体物NO2和SO2向NO3−和SO42−转化的程度。为了解疫情管控前后大气中的二次转化,分别计算了疫情管控前后两时期的SOR和NOR值,并分析了不同污染等级(优、良、轻度污染、中度污染、重度污染)下SOR和NOR的变化(表2)。文献研究表明SOR、NOR值若大于0.1,则表示有大量二次气溶胶生成,若小于0.1,则表明NO3−、SO42−主要来源于一次污染排放[26]。经计算疫情管控前后SOR、NOR分别为0.4、0.26和0.40、0.29,疫情管控后的NOR高于文献报道的2019—2020成都市重污染过程[27]中的SOR、NOR(0.40、0.27),也高于2019年1月嘉兴市污染时段SOR、NOR(0.40、0.27)和清洁时段对应值(0.38、0.18)[28],这一研究结果说明疫情管控后二次组分转化严重。疫情管控前后不同污染等级下SOR、NOR均大于0.1,且随污染等级升高而增大,说明重污染天气可促进SO2和NO2的二次转化,且疫情管控后各污染等级SOR和NOR均大于疫情管控前,表明疫情管控后二次转化增强。
大气中的NH3主要来自于农业排放,在城区主要来自于汽车尾气、工业排放和外部区域传输等[29],在大气中的主要反应为与硫酸或者硝酸反应转化为硫酸铵和硝酸铵[30]。从图3中可以看出,除重度污染等级外,NH4+在PM2.5中的占比随着污染等级加重而增加;而表2中NHR在疫情管控前后不同污染等级下的变化呈现先增加后降低的趋势,根据NHR计算公式(公式6)推测,在中度污染和重度污染下NH3可能通过外部区域传输进入济南市,使得济南市NH3浓度增加。
相关研究表明[31]NO3−主要来源于机动车等移动源,而SO42−主要来源于燃煤排放等固定源,因此用NO3−/SO42−来指示移动源和固定源对大气污染的贡献,若NO3−/SO42−>1表示移动源贡献大于固定源,反之则表明固定源对大气污染贡献较大。表2中济南市疫情管控前后不同污染等级NO3−/SO42−均大于1,说明移动源相比固定源对济南市大气污染影响大,这与黄涵涵等[32]分析2017—2018年西安市秋冬季PM2.5受移动源影响较大结果一致。疫情管控后不同污染等级NO2/SO2和NO3−/SO42−明显降低;NO3−/SO42−均值(1.54),比疫情管控前(1.80)降低了14.4%,低于赵孝囡等[33]研究的郑州市2019年均NO3−/SO42−(1.83)及邵玄逸等[34]计算的2018年1月北京市NO3−/SO42−(2.02),说明济南市区2020年春节受疫情管控下机动车排放量减少影响[35],NO2浓度削减程度大于SO2,汽车尾气等移动源对污染的贡献降低。
研究表明,OC与EC主要来源于机动车尾气排放、燃煤排放和生物质燃烧,OC与EC的比值常被用来判断是否有二次有机污染的产生,当OC/EC值>2时,可以认为存在二次污染[36]。疫情管控前后不同污染等级碳组分变化见表3。由表3可知,疫情管控前后OC/EC均大于2,说明济南市二次有机污染严重;疫情管控后不同污染等级下OC/EC值均大于管控前,而研究表明EC主要来源于汽油车和柴油车尾气排放[37],说明疫情管控后机动车排放明显减少。疫情管控后不同污染等级下SOC浓度分别为2.78、4.14、6.81、10.32 μg·m−3,在OC中的占比分别为59.7%、56.5%、61.1%、63.9%,均高于疫情管控前,受管控影响OC浓度在优、良、轻度污染等级下均有所下降,但SOC生成有所升高,说明疫情管控下二次有机反应并未削减。
-
王建英[38]等通过对银川市秋冬季重污染过程成因的分析研究,指出气象条件是大气重污染过程形成的重要因素,魏煜等[39]的研究指出,疫情期间气象条件对空气质量的变化也影响较大。为了评价气象要素变化对疫情管控前后污染的影响,构建了气象因子相对湿度(RH)、边界层高度(PBL)、风速(WS)对PM2.5浓度的多元线性回归方程,计算了疫情管控前后不同气象因素对PM2.5相对贡献率见表4。
从标准化回归系数a可以看出,RH与PM2.5浓度呈正相关,而PBL和WS与PM2.5浓度呈负相关,说明湿度越大,PBL和WS越小,PM2.5浓度越大。对比疫情管控前后,疫情管控前PBL对PM2.5的贡献率最大为46.5%,其次为RH,贡献率为40.8%;疫情管控后RH对PM2.5的贡献率升高至最大(50.2%),说明疫情管控前PBL降低是PM2.5浓度升高的首要因素,而疫情管控后湿度增大是使PM2.5浓度升高的首要因素;疫情管控前相对湿度高于疫情管控后(表2),因为12月15—16日和1月5—7号均为雨雪天气,12月16号、1月5号和6号相对湿度分别高达99.96%、99.92%和100%,拉高了湿度平均值,但雨雪天气对PM2.5有清除作用,使相对湿度对PM2.5贡献减小;而疫情管控后只有2月25号出现雨雪天气,因此疫情管控后湿度贡献率高于管控前;湿度增大促进了SO2、NO2等气态污染物的液相和非均相转化[21]。
-
(1)疫情管控下,济南市PM2.5质量浓度明显下降,平均质量浓度为(47.23±27.89) μg·m−3,超标率下降24.8%;疫情管控后PM2.5中的组分浓度均有所下降,其中TE、EC和NO3−浓度减少较大,分别降低了50.3%、46.8%和31.5%。
(2)不同污染等级对比结果表明,疫情管控后优良天数占比79.1%,无重度污染天。从不同污染等级的组分浓度变化来看,疫情管控后各污染等级下的TE、EC和NO3−占比均低于疫情管控前,但OM、SO42−、NH4+占比有所升高,SNA占比增大;SOR、NOR计算结果表明,SOR和NOR随湿度升高和污染等级升高而增大,疫情管控后不同污染等级下SOR和NOR均高于疫情管控前,而NHR有所降低;NO2/SO2明显降低,NO3−/SO42−比疫情管控前降低14.0%,汽车尾气等移动源对污染的贡献降低;碳组分中EC浓度削减较大,二次有机碳SOC浓度升高。
(3)气象因素标准化多元线性回归表明,疫情管控前,边界层高度变化对PM2.5的贡献率最大为46.5%,疫情管控后相对湿度对PM2.5的贡献率最大为50.2%,疫情管控后湿度是使PM2.5浓度升高,促进二次转化的首要因素。
济南市区2020年春节疫情管控前后PM2.5组分变化
Changes in contents of PM2.5 components over Jinan city before and after implementation of epidemic control measures during the 2020 Spring Festival
-
摘要: 为研究新型冠状病毒疫情管控政策对PM2.5组分的影响,基于在线监测数据对济南市2020年春节疫情管控前后的PM2.5及其组分浓度进行了研究,并运用标准化多元线性回归分析了气象因素对PM2.5浓度变化的贡献率。结果表明,疫情管控后,济南市区PM2.5浓度明显下降,日均值超标率下降了24.8%;PM2.5中各组分浓度均有不同程度的下降,其中微量元素(TE)、元素碳(EC)和硝酸盐(NO3−)浓度降幅较大,分别为50.3%、46.8%和31.5%。从组分占比来看,疫情管控后TE和EC占比减小,而铵盐(NH4+)、有机物(OM)、硫酸盐(SO42−)、矿物尘占比增大,NO3−占比变化不大,二次离子SNA (SO42-、NO3-、NH4+)占比之和增大14.3%。对比PM2.5中各组分占比发现,疫情管控后,轻度及以上污染等级PM2.5中NO3−和EC占比降低,而OM、SO42−和NH4+增加,说明受疫情管控影响,市民出行减少,机动车排放降低,施工工地停工,对NO3−削减较大,而疫情管控后,因颗粒物浓度降低,VOCs二次转化增强,使OM含量升高。对比疫情管控前,硫氧化率和氮氧化率值增大,NO2/SO2和NO3−/SO42−比值有明显降低,其均值分别下降了30.0%和14.0%,说明疫情管控期间汽车尾气等移动源对污染的贡献减少;受管控影响OC浓度在优、良和轻度污染等级下均下降,但二次有机碳(SOC)浓度升高,说明疫情管控下二次转化生成并未削减。气象因素标准化多元线性回归表明,疫情管控前边界层高度变化对PM2.5的贡献率最大(46.5%),疫情管控后相对湿度是促进PM2.5浓度升高的首要因素。Abstract: To understand the influence of coronavirus disease control policies on changes in characteristics of particulate matter smaller than 2.5 μm (PM2.5), concentrations of various PM2.5 components in Jinan city before and after implementation of the epidemic control measures during the 2020 Spring Festival were studied using online monitoring data. Standardized multiple linear regression was used to analyze the contribution of meteorological factors to the variations in concentrations of PM2.5 components. After the epidemic control measures were implemented, the concentrations of PM2.5 components in the area decreased significantly, and the rate at which the daily average concentration was exceeded decreased by 24.8%. The concentrations of all PM2.5 components decreased to various degrees, with those of trace elements (TE), elemental carbon (EC), and nitrate (NO3−) having decreased significantly by 50.3%, 46.8%, and 31.5%, respectively. In terms of component proportions, those of TE and EC decreased after the epidemic control measures were initiated whereas those of ammonium (NH4+), organic matter (OM), sulfate (SO42−), and mineral dust increased; the proportion of NO3− changed slightly, and the total proportion of secondary ions SO42−, NO3−, and NH4+ increased by 14.3%. Comparison of the proportions of PM2.5 components showed that after the epidemic control measures were implemented, the proportions of NO3− and EC in PM2.5 that cause a light pollution level decreased whereas those of OM, SO42−, and NH4+ increased. This indicated that people traveled less, motor vehicle emissions decreased, work at construction sites stopped, and NO3− proportion was greatly reduced while epidemic control measures were in place. However, afterward, decrease in concentrations of PM2.5 components and increase in secondary transformation of volatile organic compounds led to an increase in OM concentration. Compared with those before the epidemic control measures were implemented, the NO2/SO2 and NO3–/SO42− ratios fell significantly, and their average values decreased by 30.0% and 14.0%, respectively, indicating that the contribution of mobile sources (e.g., automobile exhaust) to pollution had decreased during the epidemic control period. Under the influence of the control measures, the OC concentration also decreased for excellent, good, and mild pollution levels; however, the secondary organic carbon concentration increased, indicating that secondary conversions did not decrease under the epidemic control conditions. Standardized multiple linear regression analyses of meteorological factors showed that changes in the height of the boundary layer contributed the most (46.5%) to changes in concentrations of PM2.5 components before the epidemic control measures were implemented; afterward, humidity was the primary factor governing the increase in these concentrations.
-
Key words:
- epidemic control /
- PM2.5 /
- secondary components /
- pollution grade /
- meteorological factors
-

-
表 1 疫情管控前后PM2.5中组分变化
Table 1. Changes of components in PM2.5 before and after the epidemic control
时间
PeriodKC TE OM EC SO42− NO3− NH4+ SNA 管控前/%
Before epidemic control5.4 0.4 23.0 5.2 16.2 28.8 11.8 56.9 管控后/%
After epidemic control5.9 0.3 29.8 4.1 19.2 29.6 16.2 65.0 占比变化率/%
Percentage change rate10.1 −27.5 29.7 −20.4 18.3 2.6 37.1 14.3 管控前/(μg·m−3)
Before epidemic control3.81 0.31 16.26 3.67 11.48 20.43 8.36 40.27 管控后/(μg·m−3)
After epidemic control2.80 0.15 14.07 1.95 9.06 13.99 7.65 30.70 浓度变化率/%
Concentration change rate−26.5 −50.3 −13.5 −46.8 −21.1 −31.5 −8.5 −23.8 表 2 疫情管控前后不同污染等级SOR、NOR变化
Table 2. Changes of SOR and NOR in different pollution levels before and after epidemic control
疫情管控前Before epidemic control 疫情管控后After epidemic control 空气质量级别
Air quality
level均值
Avera-ge优
Excellent良
Good轻度污染
Mild
pollution中度污染
Moderate
pollution重度污染
Heavy
pollution均值
Average优
Excellent良
Good轻度污染
Mild
pollution中度污染
Moderate
pollutionDays 2 44 29 6 4 10 43 13 1 SOR 0.41 0.24 0.32 0.49 0.63 0.78 0.40 0.24 0.39 0.50 0.70 NOR 0.26 0.14 0.21 0.31 0.42 0.41 0.29 0.19 0.28 0.40 0.58 NHR 0.48 0.29 0.51 0.49 0.30 0.38 0.44 0.28 0.46 0.53 0.18 RH/% 63.4 34.6 58.3 68.2 75.1 81.6 54.2 45.1 54.3 58.6 82.5 NO2/SO2 3.94 2.55 3.77 3.93 4.36 5.93 2.76 2.05 3.00 2.55 2.11 NO3−/SO42- 1.80 1.64 2.07 1.77 1.58 1.36 1.54 1.34 1.58 1.55 1.28 注:表中NO2/SO2和NO3−/SO42-均为质量浓度之比.
Note: in the table, NO2/SO2 and NO3−/SO42- are the ratio of mass concentration.表 3 疫情管控前后不同污染等级碳组分变化 (μg·m−3)
Table 3. Changes of carbon components in different pollution levels before and after epidemic (μg·m−3)
疫情管控前
Before epidemic control疫情管控后
After epidemic control空气质量级别
Air quality level优
Excellent良
Good轻度污染
Mild
pollution中度污染
Moderate
pollution重度污染
Heavy
pollution优
Excellent良
Good轻度污染
Mild
pollution中度污染
Moderate
pollutionOC 4.66 7.78 12.28 16.07 22.08 4.66 7.33 11.15 16.16 EC 1.51 2.70 4.20 6.08 7.69 1.12 1.91 2.60 3.50 OC/EC 3.10 2.97 2.97 2.76 2.89 4.31 3.82 4.40 4.62 SOC 2.14 3.27 5.27 5.92 9.23 2.78 4.14 6.81 10.32 注:表中OC/EC为质量浓度之比.
Note: in the table, OC/EC is the ratio of mass concentration.表 4 疫情管控前后不同气象因素标准化的回归系数及对PM2.5相对贡献率
Table 4. Regression coefficients of standardization of different meteorological factors before and after epidemic control and their relative contribution to PM2.5
Z1(RH) Z2(PBL) Z3(WS) a1 η/% a2 η/% a3 η/% 管控前
Before epidemic control0.29 40.8 −0.34 46.5 −0.09 12.6 管控后
After epidemic control0.43 50.2 −0.26 30.6 −0.16 19.2 注:a1、a2、a3分别为各气象因子序列标准化后对应的回归系数,ηi为Zi气象因子对PM2.5浓度的相对贡献率.
Note: a1、a2 and a3 are the corresponding regression coefficients of each standardized meteorological factor sequence, and ηi is the relative contribution rate of Zi meteorological factor to PM2.5 concentration. -
[1] 王韵杰, 张少君, 郝吉明. 中国大气污染治理: 进展·挑战·路径 [J]. 环境科学研究, 2019, 32(10): 1755-1762. WANG Y J, ZHANG S J, HAO J M. Air pollution control in China: Progress, challenges and future pathways [J]. Research of Environmental Sciences, 2019, 32(10): 1755-1762(in Chinese).
[2] PANG N N, GAO J, CHE F, et al. Cause of PM2.5 pollution during the 2016-2017 heating season in Beijing, Tianjin, and Langfang, China [J]. Journal of Environmental Sciences, 2020, 95: 201-209. doi: 10.1016/j.jes.2020.03.024 [3] LIU Y Y, WANG J, ZHAO X Y, et al. Characteristics, secondary formation and regional contributions of PM2.5 pollution in Jinan during winter [J]. Atmosphere, 2020, 11(3): 273. doi: 10.3390/atmos11030273 [4] 刘倬诚, 牛月圆, 吴婧, 等. 山地型城市冬季大气重污染过程特征及成因分析 [J]. 环境科学, 2021, 42(3): 1306-1314. LIU Z C, NIU Y Y, WU J, et al. Characteristics and cause analysis of heavy air pollution in a mountainous city during winter [J]. Environmental Science, 2021, 42(3): 1306-1314(in Chinese).
[5] 刘清, 杨永春, 刘海洋. 中国366个城市空气污染综合程度的时空演变特征分析 [J]. 干旱区地理, 2020, 43(3): 820-830. LIU Q, YANG Y C, LIU H Y. Spatiotemporal evolution characteristics of air pollution degree in 366 cities of China [J]. Arid Land Geography, 2020, 43(3): 820-830(in Chinese).
[6] 中华人民共和国生态环境部, 2020. 2019年中国生态环境状况公报 [R/OL]. (2020-06-02) [2021-5-19]. www. mee. gov. cn/hjzl/sthjzk/zghjzkgb/202006/P020200602509464172096. pdf Ministry of Ecology and Environment, PRC, 2020. Bulletin on China's ecological environment in 2019[R/OL]. (2020-06-02) [2021-5-19]. www. mee. gov. cn/hjzl/sthjzk/zghjzkgb/202006/P020200602509464172096. pdf
[7] XIE J J, YUAN C G, XIE J, et al. Fraction distribution of arsenic in different-sized atmospheric particulate matters [J]. Environmental Science and Pollution Research, 2019, 26(30): 30826-30835. doi: 10.1007/s11356-019-06176-w [8] MO Y Z, BOOKER D, ZHAO S Z, et al. The application of land use regression model to investigate spatiotemporal variations of PM2.5 in Guangzhou, China: Implications for the public health benefits of PM2.5 reduction [J]. Science of the Total Environment, 2021, 778: 146305. doi: 10.1016/j.scitotenv.2021.146305 [9] SUN H, CHEN H, YAO L, et al. Sources and health risks of PM2.5-bound polychlorinated biphenyls (PCBs) and organochlorine pesticides (OCPs) in a North China rural area [J]. Journal of Environmental Sciences, 2020, 95: 240-247. doi: 10.1016/j.jes.2020.03.051 [10] PANWAR P, PRABHU V, SONI A, et al. Sources and health risks of atmospheric particulate matter at Bhagwanpur, an industrial site along the Himalayan foothills [J]. SN Applied Sciences, 2020, 2(4): 1-12. [11] HOPKE P K, HILL E L. Health and charge benefits from decreasing PM2.5 concentrations in New York State: Effects of changing compositions [J]. Atmospheric Pollution Research, 2021, 12(3): 47-53. doi: 10.1016/j.apr.2021.01.018 [12] LI X, LI S S, XIONG Q L, et al. Characteristics of PM2.5 chemical compositions and their effect on atmospheric visibility in urban Beijing, China during the heating season [J]. International Journal of Environmental Research and Public Health, 2018, 15(9): 1924. doi: 10.3390/ijerph15091924 [13] 唐倩, 郑博, 薛文博, 等. 京津冀及周边地区秋冬季大气污染物排放变化因素解析 [J]. 环境科学, 2021, 42(4): 1591-1599. TANG Q, ZHENG B, XUE W B, et al. Contributors to air pollutant emission changes in autumn and winter in Beijing-Tianjin-Hebei and surrounding areas [J]. Environmental Science, 2021, 42(4): 1591-1599(in Chinese).
[14] CHU B W, ZHANG S P, LIU J, et al. Significant concurrent decrease in PM2.5 and NO2 concentrations in China during COVID-19 epidemic [J]. Journal of Environmental Sciences, 2021, 99: 346-353. doi: 10.1016/j.jes.2020.06.031 [15] NIU Z, HU T T, KONG L, et al. Air-pollutant mass concentration changes during COVID-19 pandemic in Shanghai, China [J]. Air Quality, Atmosphere & Health, 2021, 14(4): 523-532. [16] WANG H L, MIAO Q, SHEN L J, et al. Characterization of the aerosol chemical composition during the COVID-19 lockdown period in Suzhou in the Yangtze River Delta, China [J]. Journal of Environmental Sciences, 2021, 102: 110-122. doi: 10.1016/j.jes.2020.09.019 [17] 刘厚凤, 徐薇, 魏敏, 等. 2020年初疫情管控对山东省空气质量影响的模拟 [J]. 环境科学, 2021, 42(3): 1215-1227. LIU H F, XU W, WEI M, et al. Impact of pollutant emission reduction on air quality during the COVID-19 pandemic control in early 2020 based on RAMS-CMAQ [J]. Environmental Science, 2021, 42(3): 1215-1227(in Chinese).
[18] 陈楠, 张周祥, 李涛, 等. 武汉地区疫情管控期间空气质量变化及改善措施研究 [J]. 气候与环境研究, 2021, 26(2): 217-226. CHEN N, ZHANG Z X, LI T, et al. Air quality change and improvement measures during the COVID-19 epidemic in Wuhan [J]. Climatic and Environmental Research, 2021, 26(2): 217-226(in Chinese).
[19] 张亚茹, 陈永金, 郭庆春, 等. 济南市大气污染物时空变化及预测分析 [J]. 环境工程, 2020, 38(2): 114-121. ZHANG Y R, CHEN Y J, GUO Q C, et al. Analysis on tempo-spatial variation and prediction of air pollutants in Jinan [J]. Environmental Engineering, 2020, 38(2): 114-121(in Chinese).
[20] 魏小锋, 刘光辉, 闫学军, 等. 济南市冬季大气重污染过程PM2.5数浓度谱和组分分布特征 [J]. 生态环境学报, 2020, 29(9): 1847-1854. WEI X F, LIU G H, YAN X J, et al. Characteristics of PM2.5 number concentrations and compositions during heavy air pollution events in ji'nan [J]. Ecology and Environmental Sciences, 2020, 29(9): 1847-1854(in Chinese).
[21] 任娇, 尹诗杰, 郭淑芬. 太原市大气PM2.5中水溶性离子的季节污染特征及来源分析 [J]. 环境科学学报, 2020, 40(9): 3120-3130. REN J, YIN S J, GUO S F. Seasonal variation and source analysis of water-soluble ions in PM2.5 in Taiyuan [J]. Acta Scientiae Circumstantiae, 2020, 40(9): 3120-3130(in Chinese).
[22] 潘光, 丁椿, 孙友敏, 等. 德州市采暖季环境空气含氮/硫物质的污染及气-粒分配特征 [J]. 环境科学研究, 2020, 33(8): 1766-1775. PAN G, DING C, SUN Y M, et al. Pollution of ambient Nitrogen/Sulfur substances and associated gas-particle distribution characteristics during heating period in Dezhou city [J]. Research of Environmental Sciences, 2020, 33(8): 1766-1775(in Chinese).
[23] 张婷婷, 马文林, 亓学奎, 等. 北京城区PM2.5有机碳和元素碳的污染特征及来源分析 [J]. 环境化学, 2018, 37(12): 2758-2766. doi: 10.7524/j.issn.0254-6108.2018051701 ZHANG T T, MA W L, QI X K, et al. Characteristics and sources of organic carbon and element carbon in PM2.5 in the urban areas of Beijing [J]. Environmental Chemistry, 2018, 37(12): 2758-2766(in Chinese). doi: 10.7524/j.issn.0254-6108.2018051701
[24] 潘光, 李少洛, 朱丽, 等. 济南市降尘通量时空分布特征研究 [J]. 生态环境学报, 2019, 28(9): 1802-1809. PAN G, LI S L, ZHU L, et al. Study on spatial and temporal distribution of dust-fall flux in Jinan city [J]. Ecology and Environmental Sciences, 2019, 28(9): 1802-1809(in Chinese).
[25] 王申博, 范相阁, 和兵, 等. 河南省春节和疫情影响情景下PM2.5组分特征 [J]. 中国环境科学, 2020, 40(12): 5115-5123. doi: 10.3969/j.issn.1000-6923.2020.12.002 WANG S B, FAN X G, HE B, et al. Chemical composition characteristics of PM2.5 in Henan Province during the Spring Festival and COVID-19 outbreak [J]. China Environmental Science, 2020, 40(12): 5115-5123(in Chinese). doi: 10.3969/j.issn.1000-6923.2020.12.002
[26] LI X R, WANG Y S, GUO X Q, et al. Seasonal variation and source apportionment of organic and inorganic compounds in PM2.5 and PM10 particulates in Beijing, China [J]. Journal of Environmental Sciences, 2013, 25(4): 741-750. doi: 10.1016/S1001-0742(12)60121-1 [27] 冯小琼, 陈军辉, 尹寒梅, 等. 成都市冬季3次灰霾污染过程特征及成因分析 [J]. 环境科学, 2020, 41(10): 4382-4391. FENG X Q, CHEN J H, YIN H M, et al. Characteristics and formation mechanism of three haze pollution processes in Chengdu in winter [J]. Environmental Science, 2020, 41(10): 4382-4391(in Chinese).
[28] 张颖龙, 李莉, 宋刘明, 等. 嘉善冬季PM2.5化学组分特征及来源分析 [J]. 环境化学, 2021, 40(3): 754-764. doi: 10.7524/j.issn.0254-6108.2020062303 ZHANG Y L, LI L, SONG L M, et al. Chemical components characteristic and source apportionment of PM2.5 during winter in Jiaxing [J]. Environmental Chemistry, 2021, 40(3): 754-764(in Chinese). doi: 10.7524/j.issn.0254-6108.2020062303
[29] 胡清静. 大气中氨气、铵盐和有机胺盐的研究[D]. 中国海洋大学, 2015. HU Q J. The study of ammonia, ammonium salt and aminium salt in the atmosphere[D]. Ocean University of China, 2015(in Chinese).
[30] 刘学军, 沙志鹏, 宋宇, 等. 我国大气氨的排放特征、减排技术与政策建议 [J]. 环境科学研究, 2021, 34(1): 149-157. LIU X J, SHA Z P, SONG Y, et al. China's atmospheric ammonia emission characteristics, mitigation options and policy recommendations [J]. Research of Environmental Sciences, 2021, 34(1): 149-157(in Chinese).
[31] 王鑫, 安俊琳, 苏筱倩, 等. 南京北郊水溶性离子污染特征及其光学特性 [J]. 中国环境科学, 2020, 40(2): 506-512. doi: 10.3969/j.issn.1000-6923.2020.02.005 WANG X, AN J L, SU X Q, et al. Characteristics and optical properties of water-soluble ion pollution in the northern suburbs of Nanjing [J]. China Environmental Science, 2020, 40(2): 506-512(in Chinese). doi: 10.3969/j.issn.1000-6923.2020.02.005
[32] 黄含含, 王羽琴, 李升苹, 等. 西安市PM2.5中水溶性离子的季节变化特征 [J]. 环境科学, 2020, 41(6): 2528-2535. HUANG H H, WANG Y Q, LI S P, et al. Seasonal variation of water-soluble ions in PM2.5 in Xi'an [J]. Environmental Science, 2020, 41(6): 2528-2535(in Chinese).
[33] 赵孝囡, 王申博, 杨洁茹, 等. 郑州市PM2.5组分、来源及其演变特征[J]. 环境科学, 2021, 42(8): 3633-3643. ZHAO X N, WANG S B, YANG J R, et al. Chemical Component and Source of PM2.5 and Their Evolutive Characteristics in Zhengzhou []. Environmental Science, 2021, 42(8): 3633-3643.
[34] 邵玄逸, 王晓琦, 钟嶷盛, 等. 京津冀典型城市冬季人为源减排与气象条件对PM2.5污染影响[J]. 环境科学, 2021, 42(9): 4095-4103. SHAO X Y, WANG X Q, ZHONG N S, et al. Impacts of Anthropogenic Emission Reduction and Meteorological Conditions on PM2.5 Pollution in Typical Cities of Beijing-Tianjin-Hebei in Winter [J]. Environmental Science, 2021, 42(9): 4095-4103.
[35] CHEN K, WANG M, HUANG C H, et al. Air pollution reduction and mortality benefit during the COVID-19 outbreak in China [J]. The Lancet. Planetary Health, 2020, 4(6): 210-212. doi: 10.1016/S2542-5196(20)30107-8 [36] 黄炯丽, 陈志明, 莫招育, 等. 广西玉林市大气PM10和PM2.5中有机碳和元素碳污染特征分析 [J]. 环境科学, 2018, 39(1): 27-37. HUANG J L, CHEN Z M, MO Z Y, et al. Characteristics of organic and elemental carbon in PM10 and PM2.5 in Yulin city, Guangxi [J]. Environmental Science, 2018, 39(1): 27-37(in Chinese).
[37] 国纪良, 姬亚芹, 马妍, 等. 盘锦市夏冬季PM2.5中碳组分污染特征及来源分析 [J]. 中国环境科学, 2019, 39(8): 3201-3206. doi: 10.3969/j.issn.1000-6923.2019.08.009 GUO J L, JI Y Q, MA Y, et al. Pollution characteristics and sources of carbon components in PM2.5 during summer and winter in Panjin city [J]. China Environmental Science, 2019, 39(8): 3201-3206(in Chinese). doi: 10.3969/j.issn.1000-6923.2019.08.009
[38] 王建英, 崔洋, 史霖, 等. 银川市冬季两次典型持续大气污染过程对比分析 [J]. 环境科学研究, 2020, 33(3): 555-562. WANG J Y, CUI Y, SHI L, et al. Comparative study of two typical continuous air pollution processes in Yinchuan city in winter [J]. Research of Environmental Sciences, 2020, 33(3): 555-562(in Chinese).
[39] 魏煜, 徐起翔, 赵金帅, 等. 基于机器学习算法的新冠疫情管控对河南省空气质量影响的模拟分析[J]. 环境科学, 2021, 42(9): 4126-4139. WEI Y, XU Q X, ZHAO J S, et al. Simulation Analysis of the Impact of COVID-19 Pandemic Control on Air Quality in Henan Province based on Machine Learning Algorithm [J]. Environmental Science, 2021, 42(9): 4126-4139.
-


 下载:
下载:


