-
扬尘源是我国各地区大气颗粒物污染的重要来源,如我国北方地区春季扬尘源对PM2.5的贡献率可达到30%以上[1-5]。《扬尘源颗粒物排放清单编制技术指南(试行)》(以下简称“《指南》”)指出,土壤扬尘是指裸露地面的颗粒物在自然或人力作用下形成的扬尘[6]。土壤扬尘源分布区域广、排放随机性大、瞬时爆发性强,对局地和区域空气质量的季节性影响明显[7-9],会影响大气辐射平衡或作为凝结核促进颗粒物的二次反应[10]。因此,编制土壤扬尘源排放清单对于空气质量模拟和相关研究具有重要意义[11]。
近年来,遥感技术(RS)和地理信息系统技术(GIS)被广泛应用于构建高空间分辨率排放清单[12-14]。运用该类方法,目前已有关于南京[15]、哈尔滨[16]、北京[17]、常州[18]、长沙[19]、武汉[9]和郑州[20]等中国中部及东部城市的土壤扬尘排放清单及本地化排放因子的研究,但有关中国西部城市的相关报道较少[21],尚未发现关于西宁市土壤扬尘排放清单的研究。
作为青海省省会,地处青藏高原河湟谷地的西宁市具有典型的西部城市特征。同时也是兰西城市群中心城市,是西部大开发重要工业基地、资源开发基地和交通网络枢纽。西宁市2018年PM10和PM2.5日均浓度均超过国家二级质量标准,其大气污染不容忽视。西宁市土壤扬尘排放清单研究的缺乏,给当地污染成因分析、预警预报带来了较大的不确定性。
为系统构建西宁市土壤扬尘清单,本研究以2018年为基准年,将遥感技术(RS)与地理信息系统技术(GIS)相结合,并通过实地考察、现场采样以及实验分析,获取了具有西宁市本地化特征的土壤扬尘计算参数,并结合当地气象参数,建立了西宁市土壤扬尘排放清单并获得其时空分配特征,以期为西宁市大气污染防治对策制定提供基础和依据。
-
以西宁市行政边界为研究区域(100°54’E—101°54'E,36°13'N—37°24'N),估算西宁市土壤扬尘排放量,研究范围涵盖西宁市城区(城东区、城西区、城北区、城中区)、湟中区、湟源县和大通县。
-
土壤扬尘源排放量计算公式(1)如下:
式中,Wi为土壤扬尘的总排放量(空气动力学当量直径在0—i μm 间的颗粒物,如PM2.5、PM10),t·a−1;EFi为土壤扬尘PMi的排放系数,t·(m2·a)−1;A为土壤扬尘面积,m2。
土壤扬尘PMi的排放系数主要受土壤表层颗粒物粒径分布、土壤质地、地表粗糙度、植被覆盖度、周边屏蔽条件以及气象条件等因素的影响。具体计算方法见式(2)和(3):
式中,EFi为土壤扬尘源的 PMi 排放系数,t·(m2·a)−1或t·(m2·month)−1;Di为 PMi 的起尘因子,t·(104 m2·a)−1 或t·(104 m2·month)−1;C为气候因子,无量纲;η为土壤扬尘控制措施的抑尘效率,%,本研究中统一取值为0;ki为粒度乘数,PMi在土壤扬尘中百分含量,%;Iwe为土壤风蚀指数, t·(104 m2·a)−1或t·(104 m2·month)−1;f为地面粗糙因子,取值为0.5;L为无屏蔽宽度因子,表示研究区域的开阔程度,即没有明显的阻挡物(如建筑物或者高大的树木)的最大范围。当无屏蔽宽度小于等于300 m时,L=0.7;当无屏蔽宽度大于300 m,小于600 m时,L=0.85;当无屏蔽宽度大于等于600 m时,L=1.0,本研究统一取值0.75;V为植被覆盖因子,指裸露土壤面积与总计算面积比例,也就是V=1-植被覆盖度。
-
气候因子是用来表征气象因素对土壤扬尘排放影响的重要指标,主要由风速、降水量、蒸发量和温度共同决定。
相比年气候因子而言,月气候因子能够反映短期的气候条件,因此在计算土壤扬尘排放量时宜选取月气候因子,具体计算公式如下式(4)、(5)和(6):
式中,Cm为月平均气候因子;um为月平均风速,m·s−1;PE为桑氏威特降水-蒸发指数,为年降水-蒸发指数。
式中,p为年降水量,mm;E*为年潜在蒸发量,mm;Ta 为年平均温度,℃。
由于每月的降水-蒸发指数不能够精确评估短时间内土壤中的水分条件,因此,在计算月气候因子时应选择年降水-蒸发指数。
根据西宁气象局提供的2018年气象数据,计算得到了2018年年潜在蒸发量、年降水量和年桑氏威特降水-蒸发指数,如表1所示。结果表明,各站点年潜在蒸发量由小到大为:湟源县 < 湟中区 < 大通县 < 西宁市市区。湟中区的年降水量最大为669.80 mm,大通县的年降水量最小为483.40 mm。湟中区的年桑氏威特降水-蒸发指数最大为151.27,西宁市市区的年桑氏威特降水-蒸发指数最小为102.49。
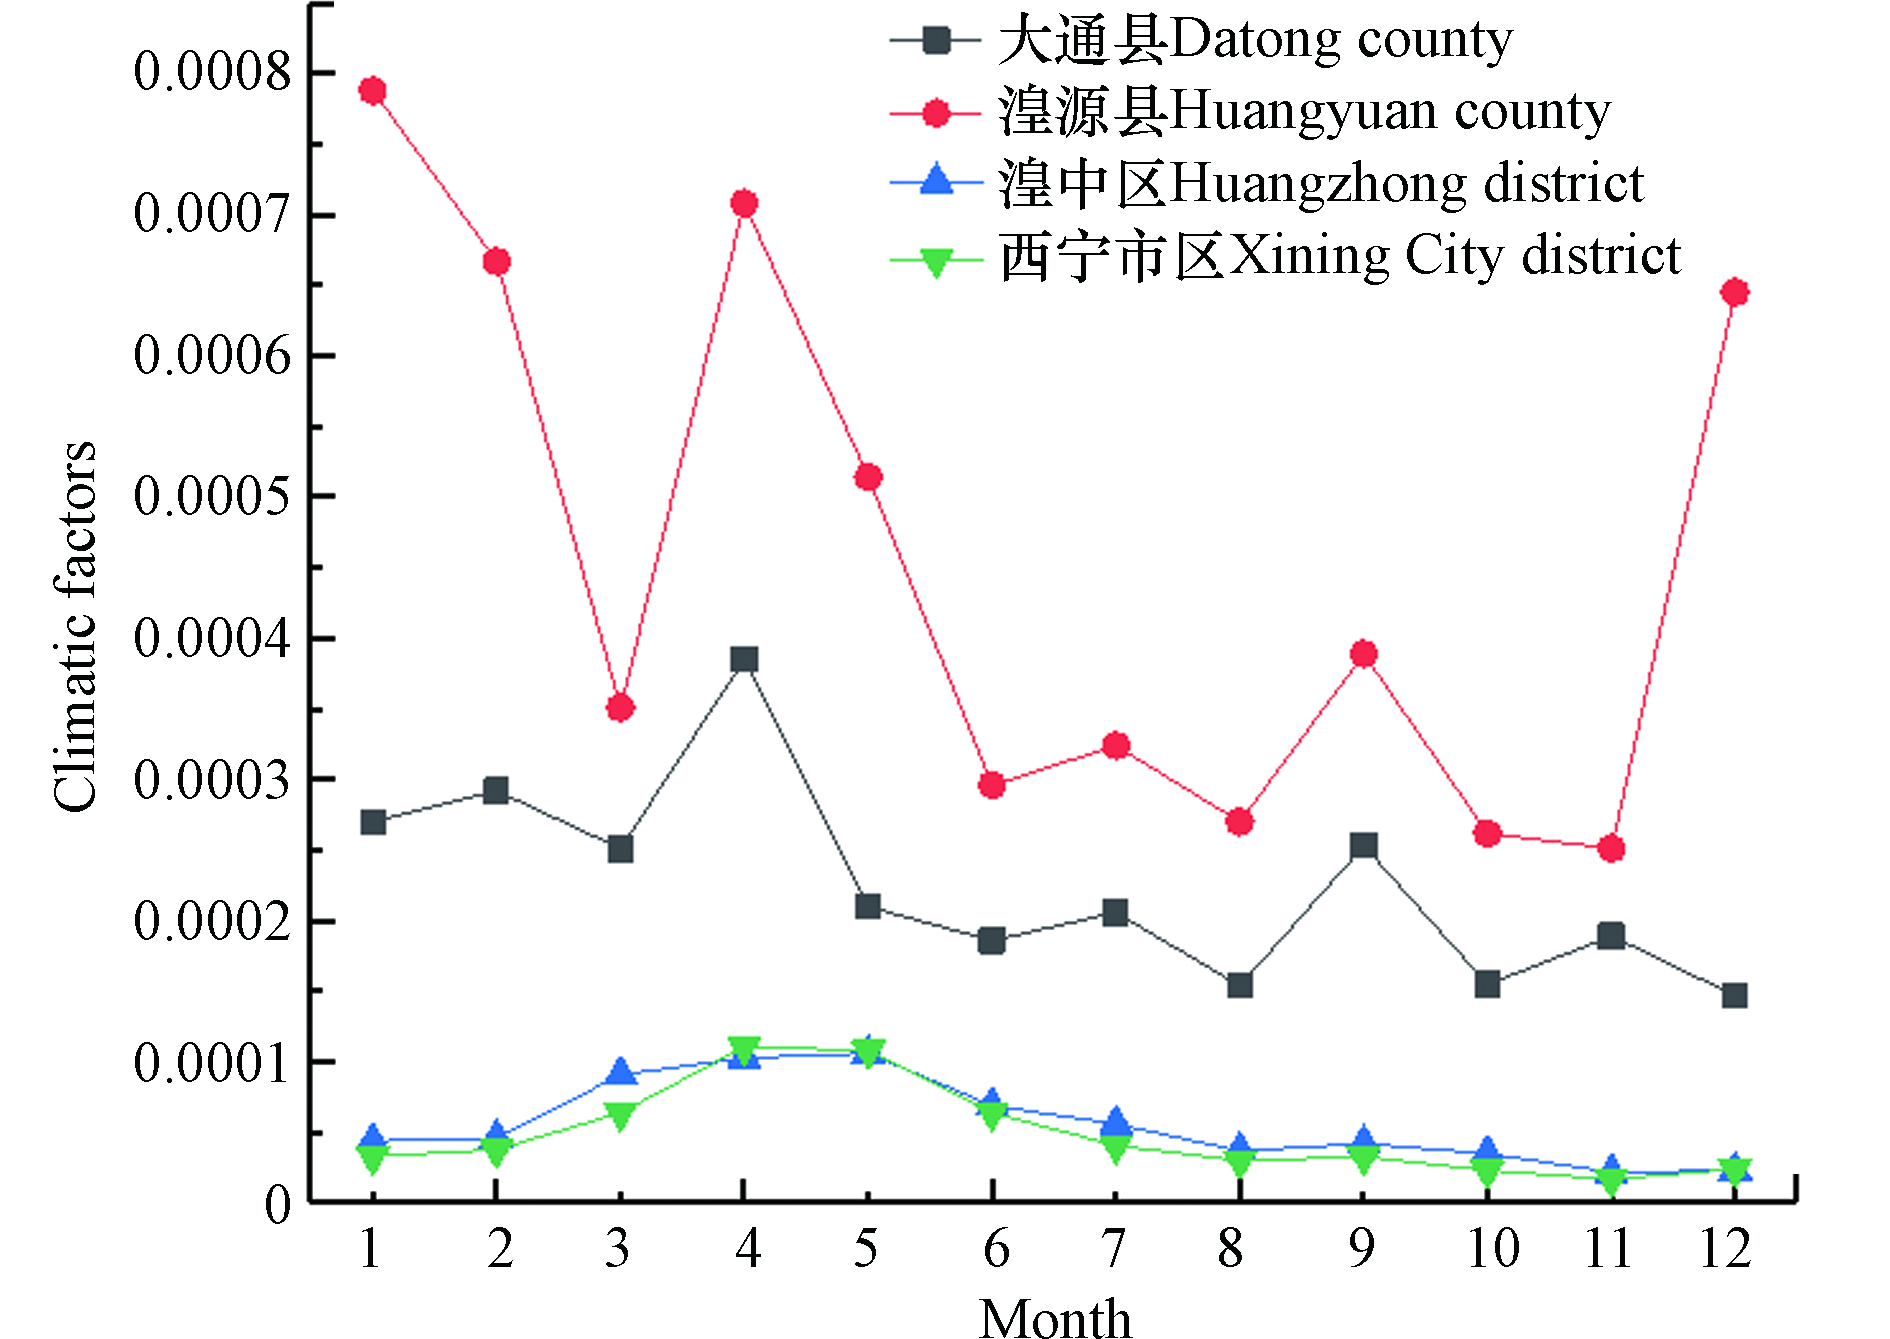
气候因子是地区排放季节性变化的决定性因素[22]。计算得到的各地区各月气候因子见图1,湟源县1月份的气候因子值(0.000788)最高,西宁市区11月份的气候因子值(0.000017)最低。湟源县站点的各月份的月气候因子均高于其他站点相应月份的月气候因子。除湟源县外,其余各站点月气候因子最大值均出现在4、5月份。除大通县月气候因子最小值出现在12月份外,其余站点月气候因子最小值均出现在11月份。气候因子对颗粒物排放系数的影响主要来源于平均风速[20],春季4、5月时,风速较大,因此西宁市各区气候因子均处于较高水平。而湟源县的气候因子最高值出现在1月,是4月的1.11倍,这主要是由于当时受局部气象因素影响,湟源县1月份平均风速为2.81 m·s−1,是4月风速的1.03倍,且明显高于其他月份风速,进而导致湟源县1月份气候因子较高。总体看,湟中区的气候因子变化规律和数值与西宁市区接近。
-
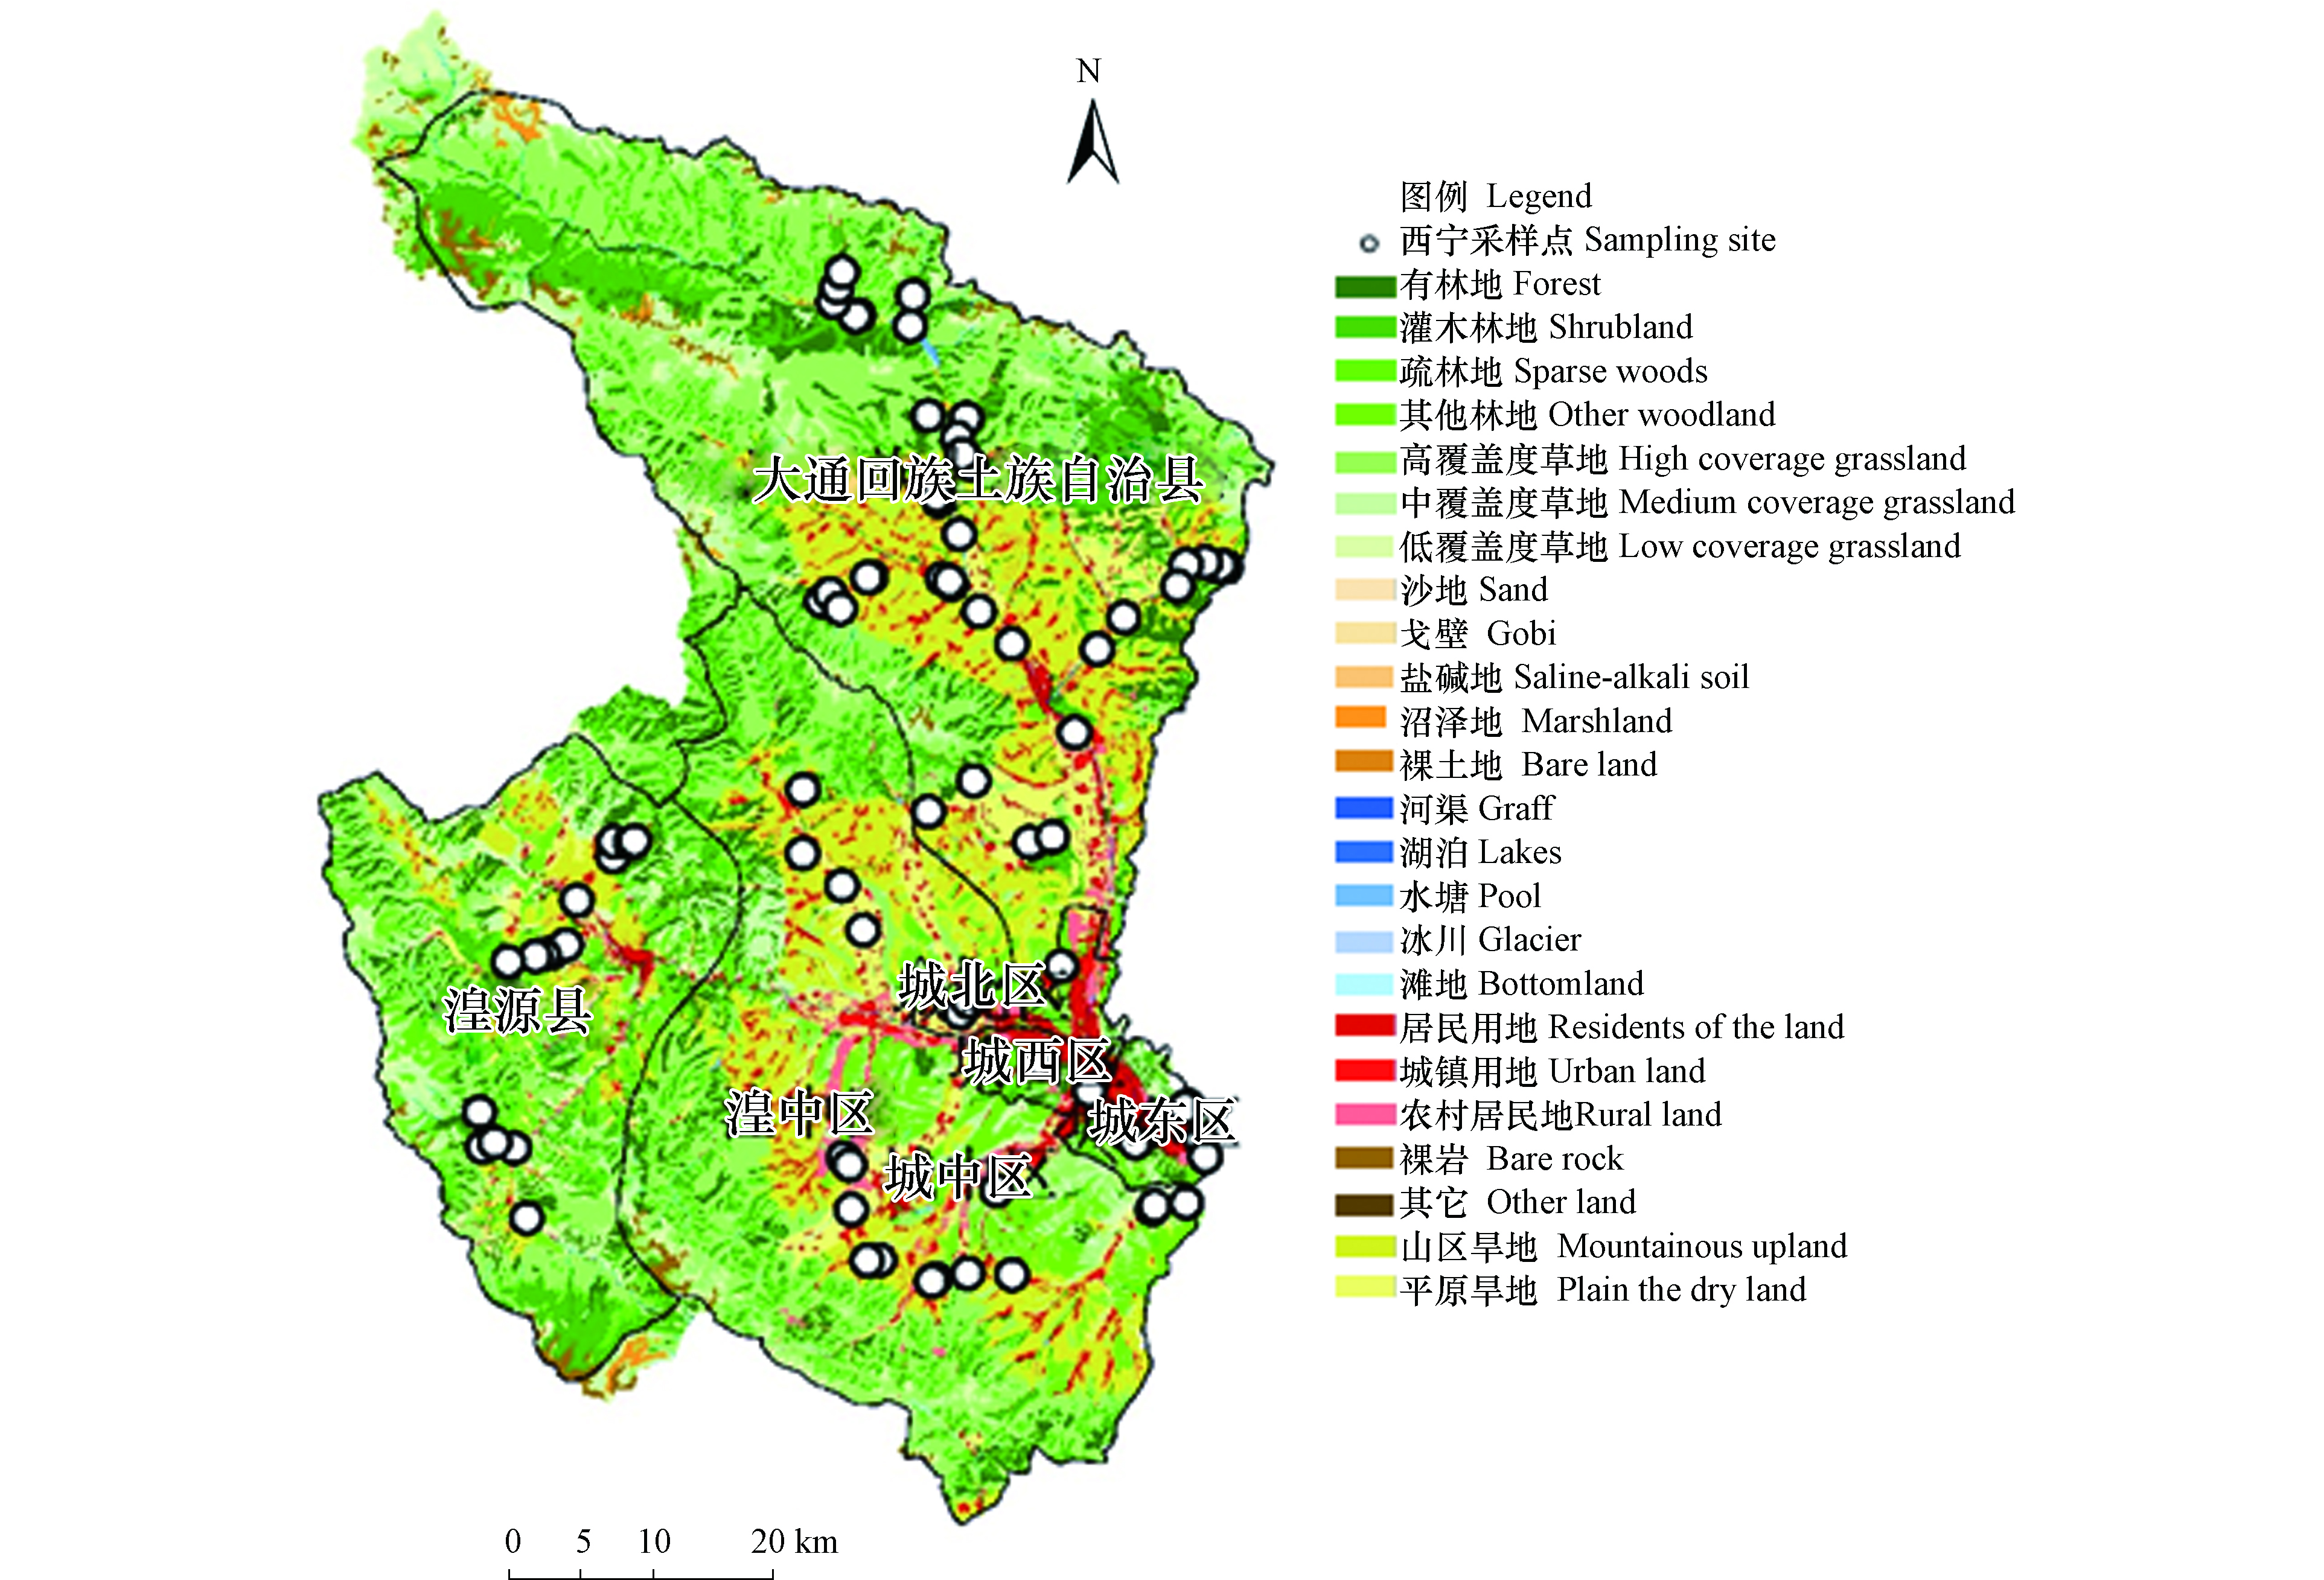
土壤粒度乘数是指不同粒径颗粒物在表层土壤中的百分含量。为使粒度乘数参数本地化,本研究通过采集研究区域内不同土地利用类型的土壤样品,通过再悬浮获取粒径信息,然后通过计算得到不同土地利用类型土壤样品的粒度乘数。2019年9月,采集研究区域内不同土地利用现状的表层(0—10 cm)土壤样品84个,采样点如图2所示,将采集到的土壤样品在实验室内自然阴干,过200目泰勒标准筛筛分,再悬浮的同时采用Optical Particle Sizer 3330测定粒度组成(PM2.5、PM10)。
将测定得到的粒度乘数结果依据不同土地利用类型进行分类统计,将各不同地块类型采样点位PM2.5粒度乘数的平均值作为对应地块类型的粒度乘数;对于采样未涉及到的土地利用类型的地块的粒度乘数,使用与其近似类型的地块的粒度乘数进行赋值,PM10粒度乘数采用扬尘指南推荐值。
-
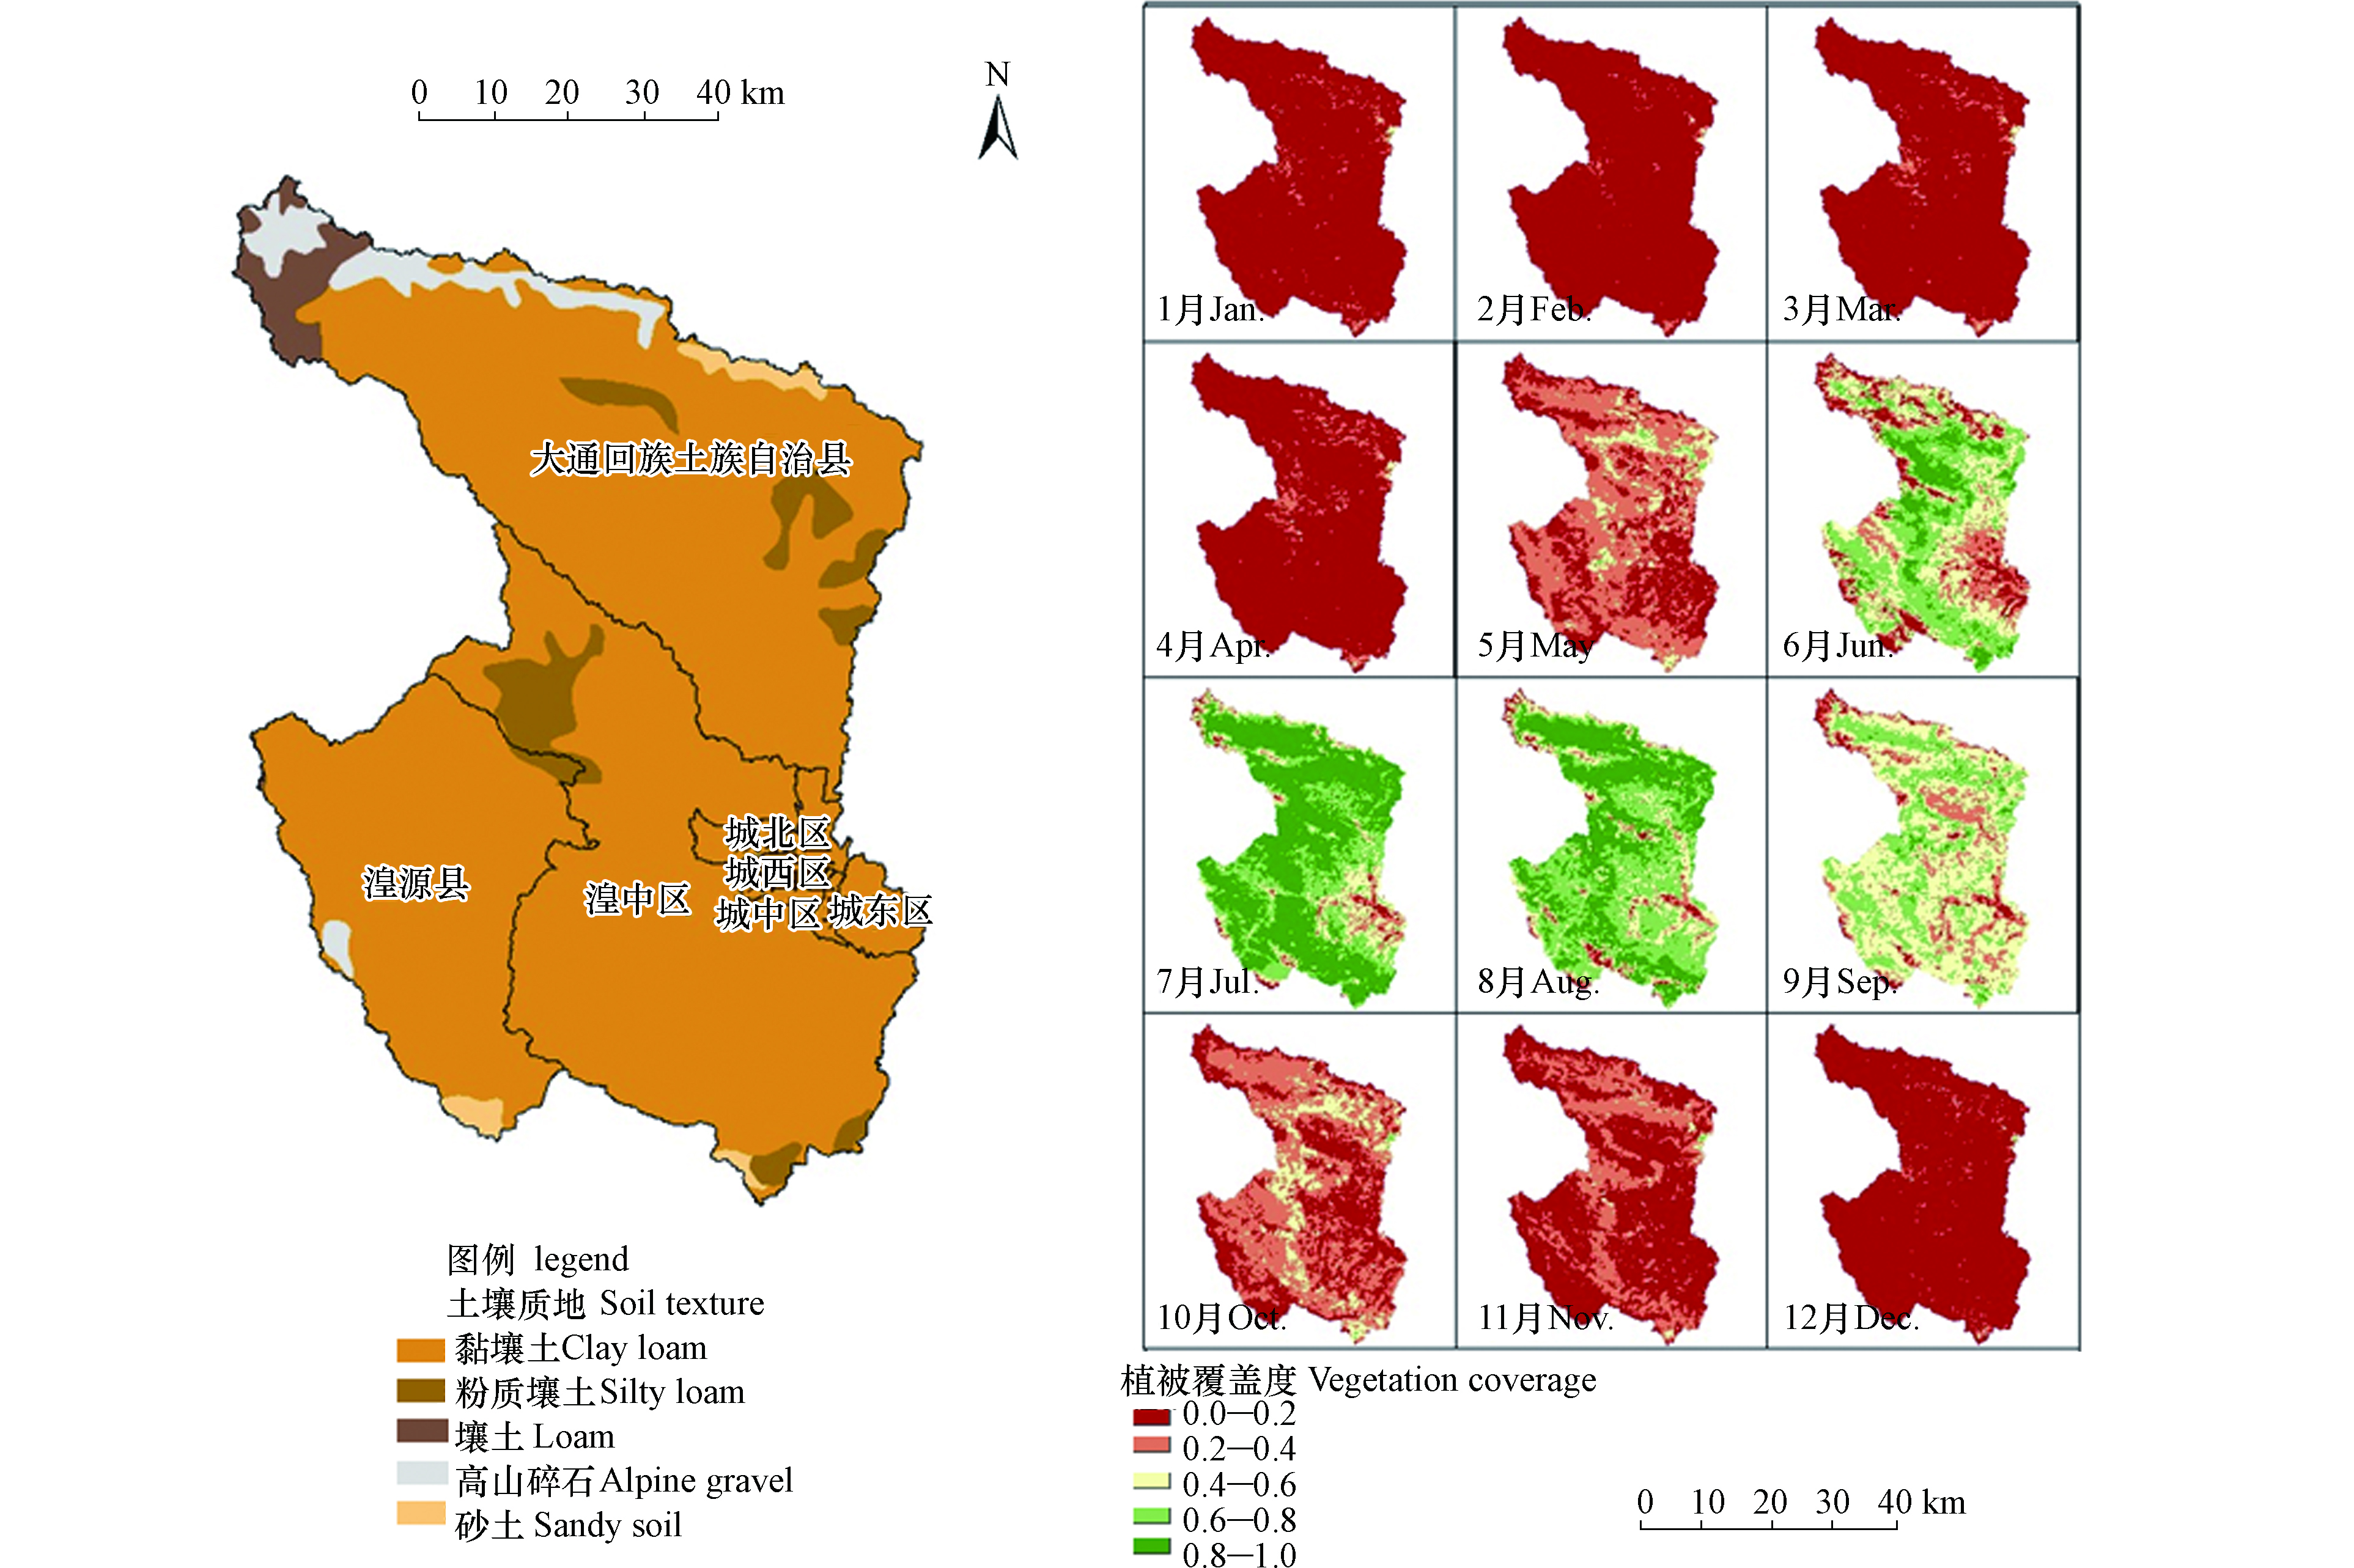
本研究所需的土壤质地图由青海省生态环境监测中心提供,并结合《指南》推荐的土壤风蚀指数和美国制土壤质地划分标准,将本研究中的土壤质地划分为砂土、壤土、粉砂质壤土、黏壤土共4种类型,如图3。为研究土壤扬尘排放量的时间分布特征,在计算土壤扬尘月排放量时,采用月土壤风蚀指数。
-
植被覆盖因子可通过植被覆盖度计算得到,当地面完全没有植被覆盖时V等于1。植被覆盖度是指植被叶、茎、枝垂直向下投影面积占区域总面积的比例或百分数,通过遥感解译获得。本研究采用由美国NASA提供的16 d合成的空间分辨率为500 m的MOD13A1- NDVI产品作为基础数据进行植被覆盖度计算,数据格式为EOS-HDF。首先,利用NASA提供的MRT(MODIS Reprojection Tools)软件将下载的影像转换为UTM投影的tif格式。然后,利用Arcmap中提供的Extract by Mask工具,以研究区域边界矢量文件为掩膜裁剪出研究区域的NDVI数据,利用像元二分法模型来估算研究区域的植被覆盖度,结果见图3。
图3表明,1、2、12月份的植被覆盖度以极低覆盖度为主,6、7、8月份高植被覆盖度所占比例相比其他月份较高。植被季节性枯荣和农业生产直接影响地表裸露状况。夏季雨热同期,植被和农作物生长较为旺盛,植被覆盖度更高;反之冬季植被覆盖度较低。由图3可以看出,9、10月植被覆盖度降低较为显著,这主要是由于植被覆盖度主要受气温及降水影响和植被及农作物生长状况影响,西宁市各月气温及降水变化较大,促使植被覆盖度的月变化较大。与7、8月相比,9、10月的气温及降水均显著下降、农作物收割、森林草原植被等落叶,因此其植被覆盖度显著降低。
-
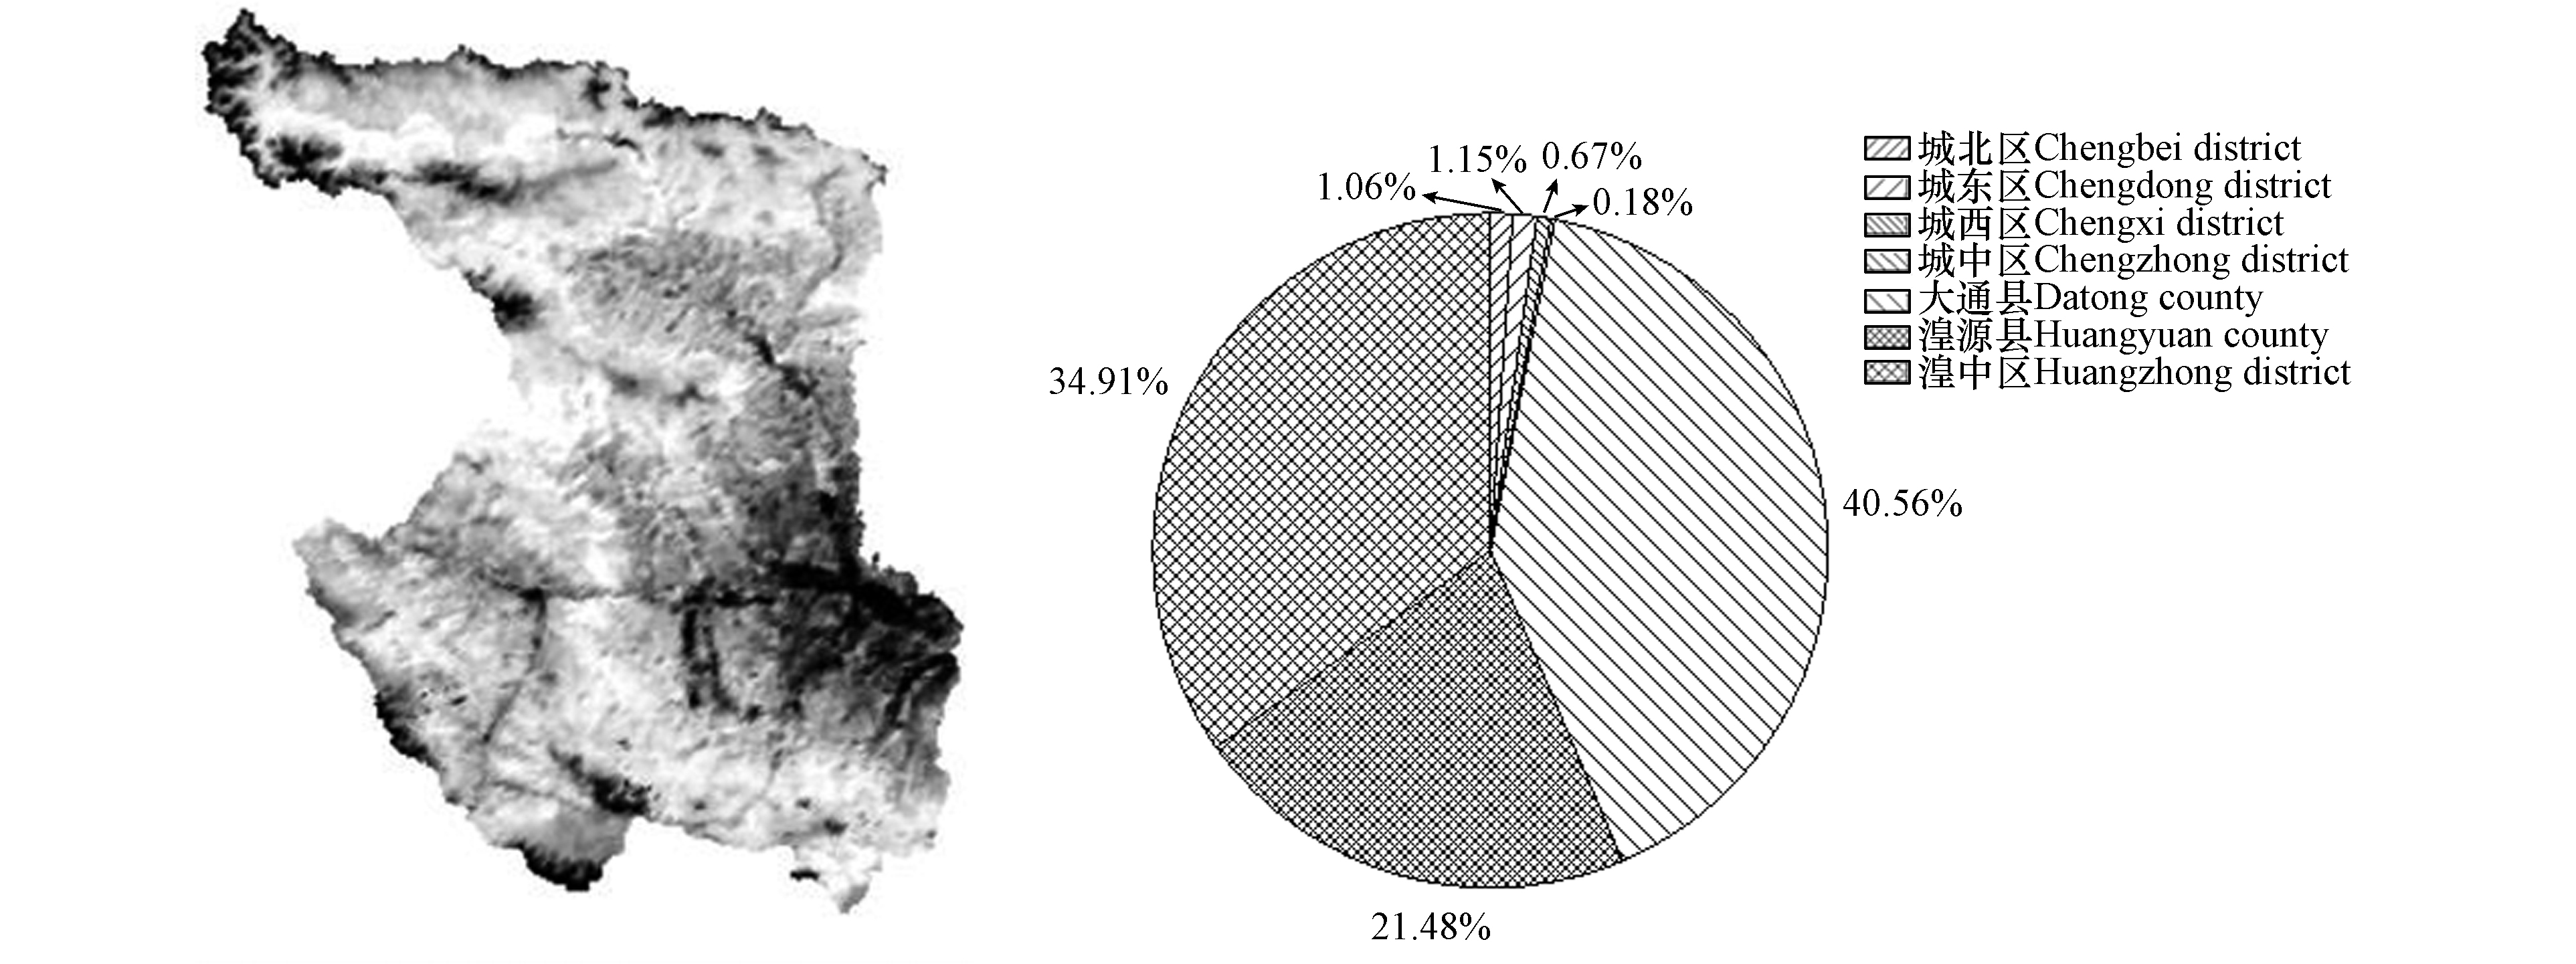
将遥感影像解译并利用Arcgis中几何计算器计算各区县土壤扬尘源面积,结果见图4。西宁市土壤扬尘源总面积为6899.44 km2。其中,大通县土扬扬尘源面积最大,为2798.17 km2,占全市总土壤扬尘源面积的40.56%;其次是湟中区,占全市总土壤扬尘源面积的34.91%;排第三位的是湟源县,占全市总土壤扬尘源面积的21.48%。湟中区、湟源县和大通县拥有最多的土壤扬尘源面积,这与其较小的建成区面积及大面积农田、草地和林地有关。而西宁市市内4个区的土壤扬尘源面积很小,为210.62 km2,仅占总土壤扬尘源面积的3.06%,这主要与其建设用地面积较大有关。
-
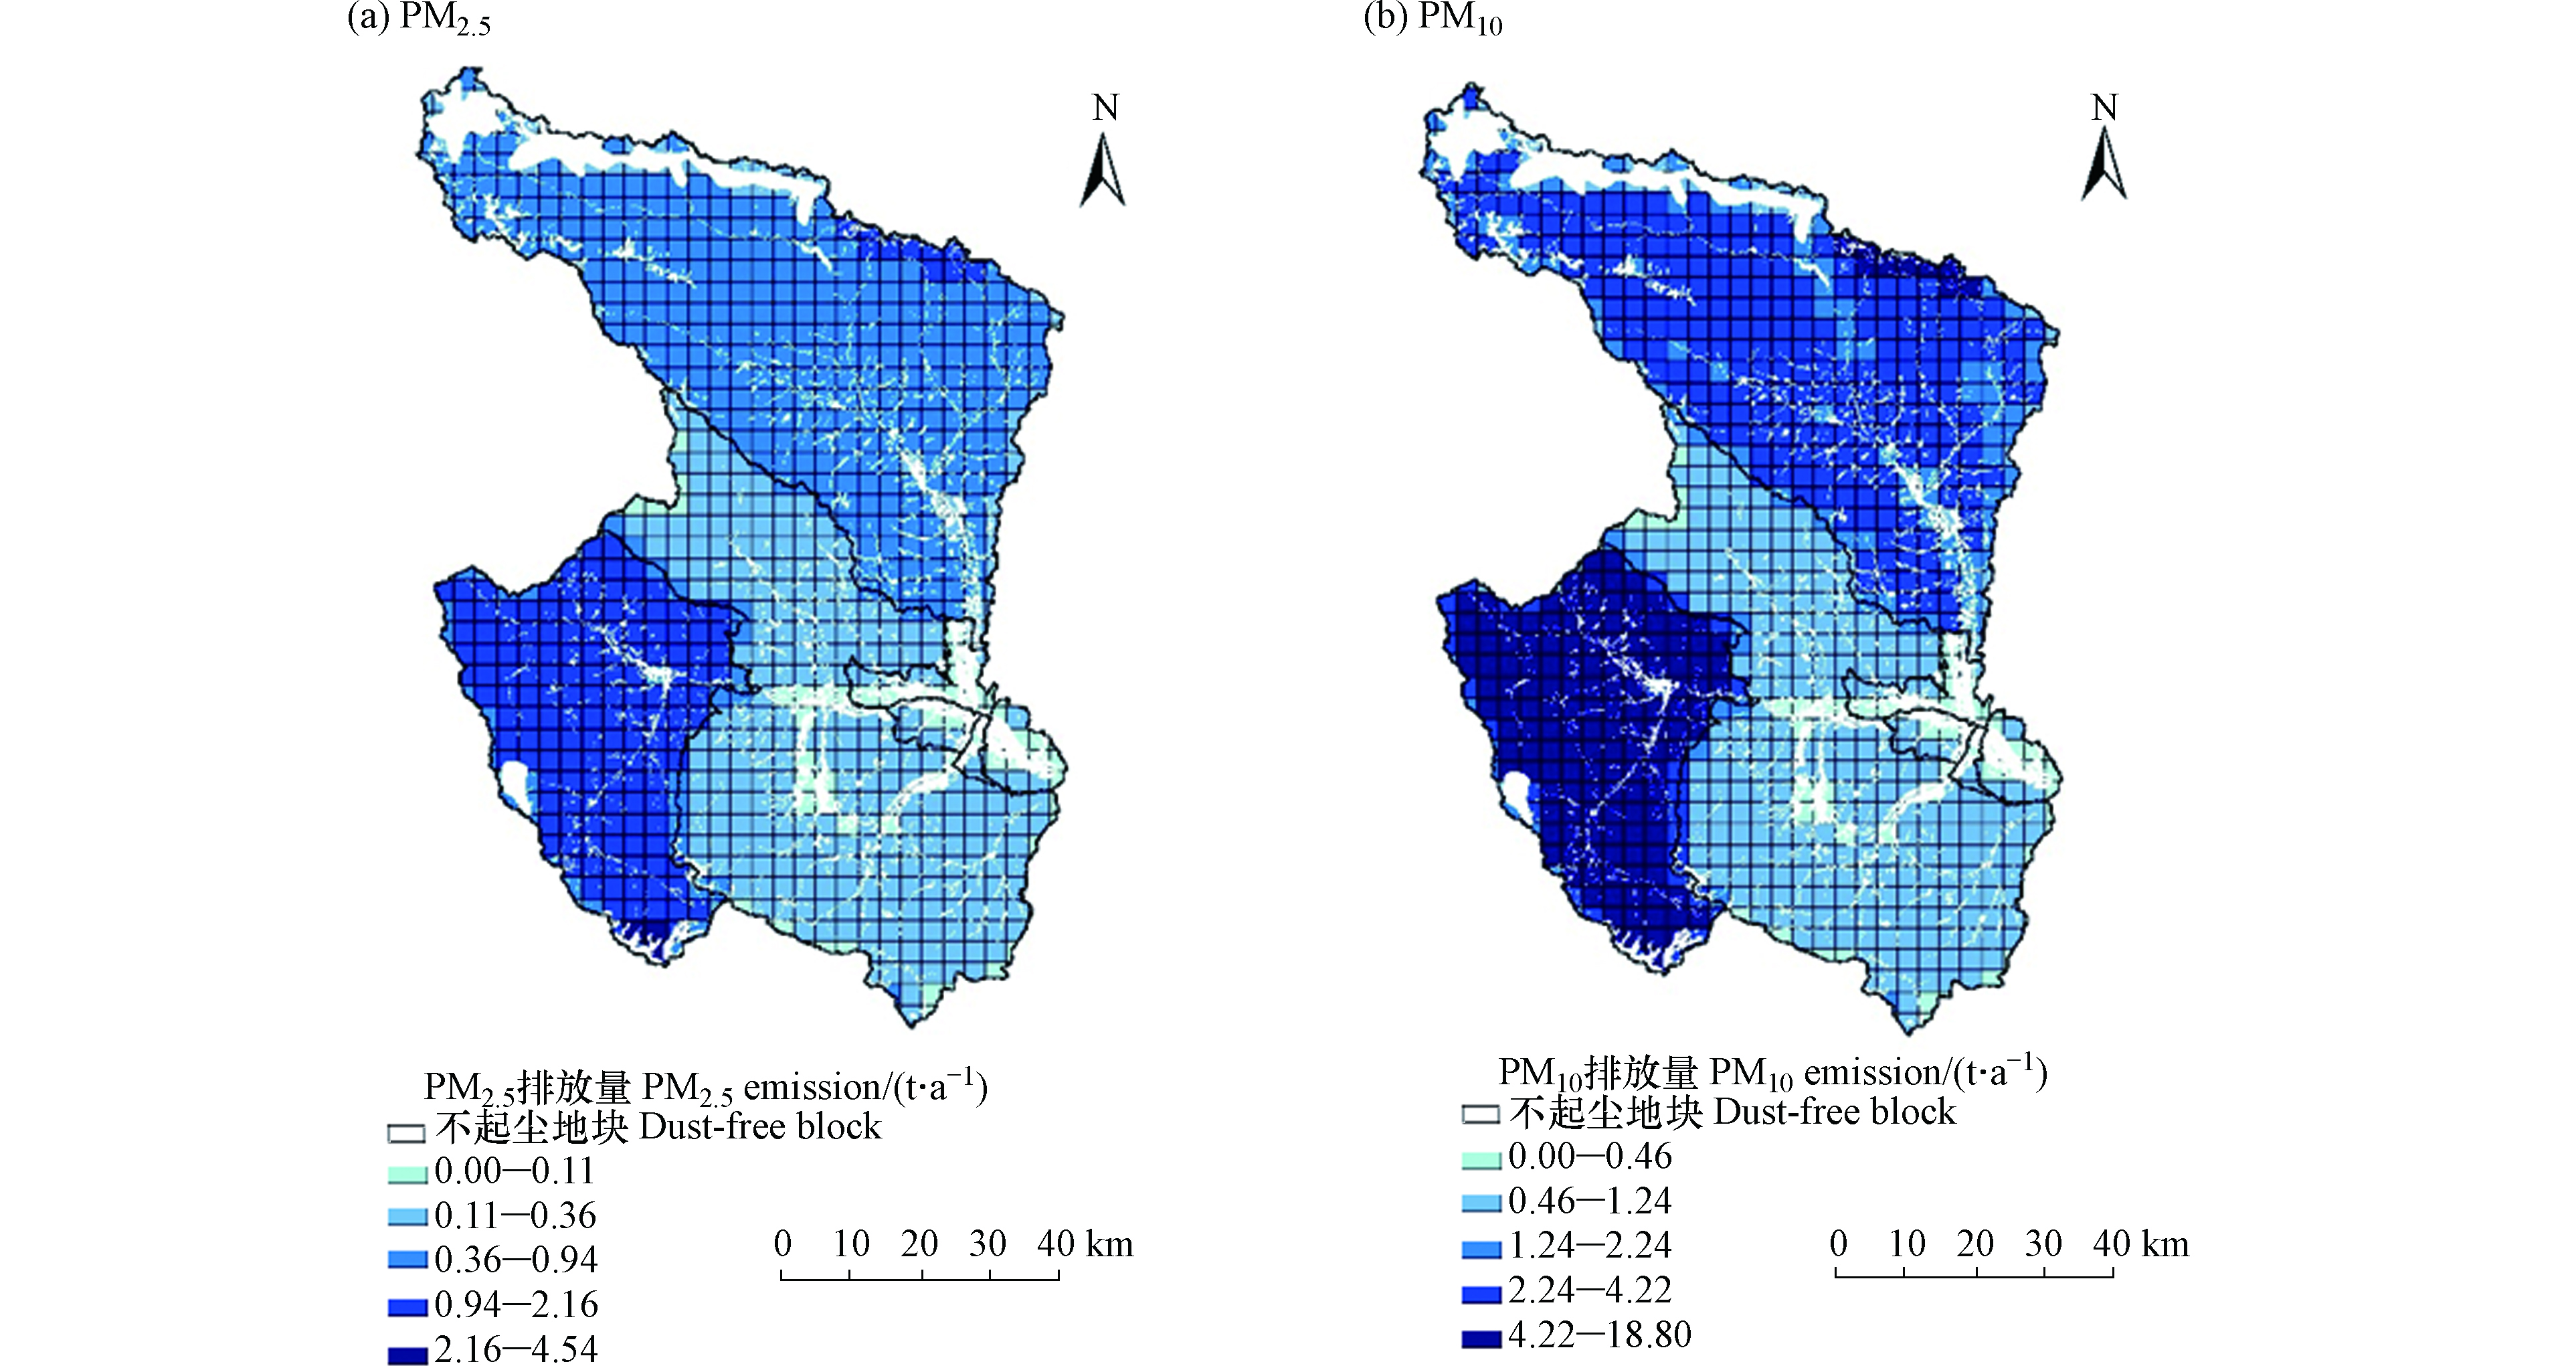
根据公式计算得到每个月的土壤扬尘PM10和PM2.5的月排放量,并计算得到年排放量。2018年西宁市土壤扬尘PM2.5、PM10排放总量分别为353.13 t、1502.46 t。各区县排放量和贡献率见表2,空间分布见图5(网格:3 km ×3 km)。
图5表明,西南地区和北部地区土壤扬尘源排放量高于中部及东南部地区,空间差异较明显。湟源县土壤扬尘PM2.5、PM10排放量最大,分别为172.82 t、729.18 t,占研究区域内土壤扬尘PM2.5、PM10总排放量的48.94%、48.53%;其次,大通县的土壤扬尘排放量也较高,PM2.5、PM10排放量分别为148.09 t、634.15 t,是研究区域土壤扬尘PM2.5、PM10总排放量的41.94%、42.21%。湟源县和大通县土壤扬尘PM2.5、PM10排放量对研究区域内土壤扬尘排放量的贡献均约为90%,而土壤扬尘源面积位居第二位的湟中区土壤扬尘PM2.5、PM10排放量却明显低于湟源县。土壤扬尘排放量与气象因子,土壤扬尘源面积及植被覆盖因子有关。湟中区与湟源县和大通县的平均植被覆盖因子相近,分别为0.71、0.72、0.70,故差异主要源于气象因子。虽然湟中区土壤扬尘源面积位居第二,分别是大通县和湟源县的0.86、1.63倍,但在较小风速和较多降水的综合影响下,湟中区气象因子仅是湟源县和大通县的0.12倍和0.25倍,进而促使湟中区土壤扬尘排放量低于大通县和湟源县。
在西宁市的市内四区中,城中区土壤扬尘PM2.5、PM10排放量最小,分别为0.16 t和0.67 t;城北区和城东区的土壤扬尘排放量相近且较大,城北区PM2.5、PM10的排放量分别为0.88 t、3.79 t,城东区PM2.5、PM10的排放量分别为0.90 t、3.78 t。由于土壤扬尘源面积较小,市内四区的土壤扬尘排放量显著小于大通县、湟源县和湟中区。
排放强度经常作为比较各地区土壤扬尘源排放强弱的指标[20, 22-23]。本研究以国内研究较广泛的土壤扬尘PM2.5为例,与其他城市的排放强度相比较(表3),西宁市土壤扬尘排放强度高于常州,明显低于西安、郑州,以及保定、沧州、承德等京津冀地区城市。总体上看,西宁市土壤扬尘排放强度处于较低水平,一方面,西宁市由于海拔较高,年平均气温低于上述其他城市,促使其气候因子较小;另一方面,京津冀地区城市的土壤质地主要为壤土和砂土[22],风蚀指数较高,而西宁市土壤质地主要为粘壤土,其风蚀指数较低,促使西宁市土壤扬尘排放强度较低。
-
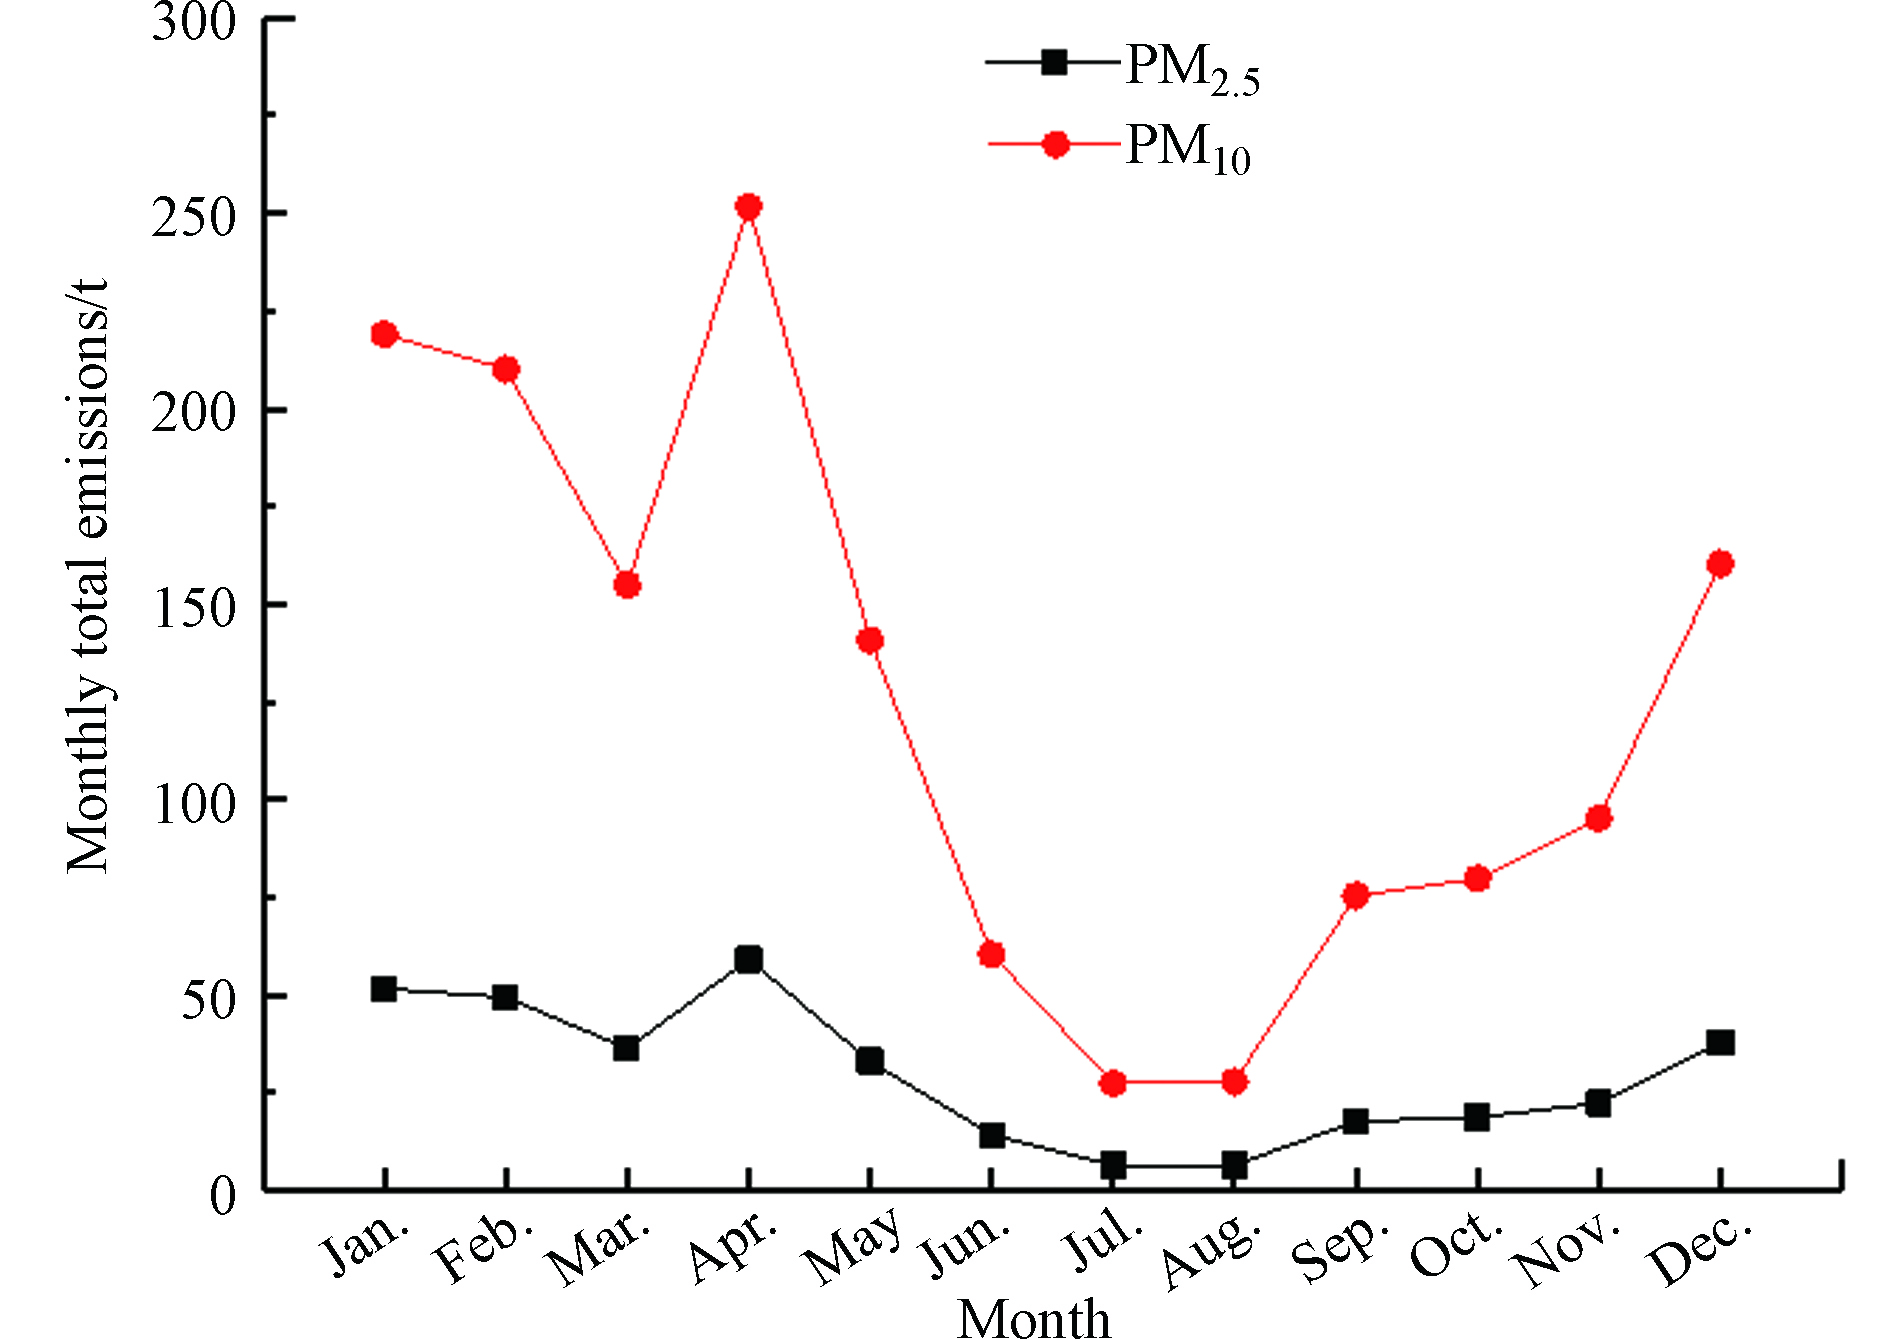
西宁市土壤扬尘月排放量(图6)表明,各月份土壤扬尘PM2.5、PM10排放量存在一定差异。4月份排放量最大,PM2.5、PM10的排放量分别为59.08 t、251.68 t;西宁市4月正处春季,降水较少,地表疏松裸露干燥,风速较大,风速越大扬起的颗粒物越多且粒径范围越广[20],致使4月份西宁市土壤扬尘排放量最大。7月份土壤扬尘排放量最小,PM2.5、PM10排放量分别为6.41 t、27.40 t;这是因为西宁市7月份地表植被覆盖度较高,降水较多且风速不大,使地表颗粒物不易扬起,进而促使土壤扬尘排放量最小。
值得注意的是,虽然湟源县1月份气候因子略高于4月,但4月土壤扬尘总排放量却大于1月。整体上看,西宁市研究区域内1月与4月植被覆盖度相似。而1月湟源县气候因子是4月的1.11倍,因此湟源县1月排放量略高于4月。而其他区县1月的气候因子均显著低于4月,例如排放量较大的湟中和大通的4月气候因子分别是1月的2.35倍和1.15倍,故其他区县土壤扬尘排放量4月比1月的增量和高于湟源县4月比1月的降低量。因此,西宁市研究区域内土壤扬尘排放量1月比4月小。
-
本研究使用Oracle Crystal Ball软件,采用蒙特卡罗方法针对本研究清单进行不确定性分析。设定随机抽样10000次,置信度95%,根据不同月份得到土壤扬尘排放量的不确定性范围,结果见表4。PM10排放量的不确定度范围为-21.90%—24.50%;PM2.5排放量的不确定度范围为-20.15%—22.00%,不确定度较低,表明土壤扬尘排放量的计算值与模拟均值较为接近。其中,不确定度最高是12月份的PM10排放,不确定度为-21.90%—24.50%;不确定度最低是9月份的PM2.5排放,不确定度为-0.75% —0.75%。不确定性来源包括:①由于研究区域较大,每个月份的遥感影像由3张 MOD13A1影像拼接而成,存在一定的色差,使植被覆盖因子的获取存在一定的不确定性。②难以获取准确详尽的无屏蔽宽度因子(L),该研究中选取 0.75 统一进行计算,可能会造成土壤扬尘排放量的低估。
-
(1)2018年西宁市土壤扬尘PM2.5、PM10排放量分别为353.13 t、1502.46 t。
(2)湟源县PM2.5、PM10排放量最大,分别为172.82 t、729.18 t。大通县的土壤扬尘排放量也较高,PM2.5、PM10排放量分别为148.09 t、634.15 t。湟中区土壤扬尘PM2.5、PM10排放量排第三,分别为29.68 t、128.45 t。在西宁市市内四区中,城中区的土壤扬尘PM2.5、PM10排放量最小,分别为0.16 t、0.67 t,城北区和城东区的土壤扬尘排放量相近且最大,城北区PM2.5、PM10的排放量分别为0.88 t、3.79 t,城东区PM2.5、PM10的排放量分别为0.90 t、3.78 t。
(3)4月份土壤扬尘PM2.5、PM10的排放量最大,分别为59.08 t、251.68 t。7月份排放量最小,分别为6.41 t、27.40 t。
(4)不确定性分析结果表明,在95%置信区间下,西宁市土壤扬尘PM2.5和PM10的不确定度均较低,PM10排放量的不确定度范围为-21.90%—24.50%;PM2.5排放量的不确定度范围为-20.15%—22.00%。
西宁市土壤扬尘排放清单构建及时空分布特征
Construction of emission inventory and temporal-spatial distribution of soil fugitive dust in Xining, China
-
摘要: 本研究通过遥感解译获得植被覆盖度,结合土地利用现状、土壤质地和气象数据,获取了西宁市本地化土壤扬尘源计算参数,并据此构建了西宁市2018年土壤扬尘排放清单。结果表明,2018年西宁市土壤扬尘PM2.5、PM10年排放量分别为353.13 t、1502.46 t,其中湟源县土壤扬尘排放量最高,大通县位居第二,市辖区排放量较小。PM2.5、PM10在四月排放量最大,分别为59.08 t、251.68 t;7月份排放量最小,PM2.5、PM10排放量分别为6.41 t、27.40 t。蒙特卡罗模拟结果表明,西宁市土壤扬尘PM2.5和PM10的不确定度均较低,PM10排放量的不确定度范围为-21.90%—24.50%;PM2.5排放量的不确定度范围为-20.15%—22.00%。Abstract: The localization parameters and emission inventory of soil fugitive dust in Xining in 2018 was constructed according to vegetation coverage interpreted by remote sensing, land use, soil texture, and meteorological factors. Results showed that the annual PM2.5 and PM10 emissions from the soil fugitive dust were 353.13 t and 1502.46 t, respectively. The emission of soil fugitive dust in Huangyuan county was the highest, followed by Datong county, and the emissions in municipal districts were low. The emissions of PM2.5 and PM10 were the highest in April with the values of 59.08 t and 251.68 t and lowest in July with the values of 6.41 t and 27.40 t, respectively. The Monte Carlo simulation results showed that the uncertainties of PM2.5 and PM10 of soil fugitive dust in Xining were both low, with the range of -20.15% to 22.00% and -21.90% to 24.50%, respectively.
-
Key words:
- soil fugitive dust /
- localization factor /
- emission inventory /
- Xining /
- uncertainty analysis
-
扬尘源是我国各地区大气颗粒物污染的重要来源,如我国北方地区春季扬尘源对PM2.5的贡献率可达到30%以上[1-5]。《扬尘源颗粒物排放清单编制技术指南(试行)》(以下简称“《指南》”)指出,土壤扬尘是指裸露地面的颗粒物在自然或人力作用下形成的扬尘[6]。土壤扬尘源分布区域广、排放随机性大、瞬时爆发性强,对局地和区域空气质量的季节性影响明显[7-9],会影响大气辐射平衡或作为凝结核促进颗粒物的二次反应[10]。因此,编制土壤扬尘源排放清单对于空气质量模拟和相关研究具有重要意义[11]。
近年来,遥感技术(RS)和地理信息系统技术(GIS)被广泛应用于构建高空间分辨率排放清单[12-14]。运用该类方法,目前已有关于南京[15]、哈尔滨[16]、北京[17]、常州[18]、长沙[19]、武汉[9]和郑州[20]等中国中部及东部城市的土壤扬尘排放清单及本地化排放因子的研究,但有关中国西部城市的相关报道较少[21],尚未发现关于西宁市土壤扬尘排放清单的研究。
作为青海省省会,地处青藏高原河湟谷地的西宁市具有典型的西部城市特征。同时也是兰西城市群中心城市,是西部大开发重要工业基地、资源开发基地和交通网络枢纽。西宁市2018年PM10和PM2.5日均浓度均超过国家二级质量标准,其大气污染不容忽视。西宁市土壤扬尘排放清单研究的缺乏,给当地污染成因分析、预警预报带来了较大的不确定性。
为系统构建西宁市土壤扬尘清单,本研究以2018年为基准年,将遥感技术(RS)与地理信息系统技术(GIS)相结合,并通过实地考察、现场采样以及实验分析,获取了具有西宁市本地化特征的土壤扬尘计算参数,并结合当地气象参数,建立了西宁市土壤扬尘排放清单并获得其时空分配特征,以期为西宁市大气污染防治对策制定提供基础和依据。
1. 材料与方法 (Materials and methods)
1.1 排放清单计算空间尺度的确定
以西宁市行政边界为研究区域(100°54’E—101°54'E,36°13'N—37°24'N),估算西宁市土壤扬尘排放量,研究范围涵盖西宁市城区(城东区、城西区、城北区、城中区)、湟中区、湟源县和大通县。
1.2 土壤扬尘计算方法
土壤扬尘源排放量计算公式(1)如下:
Wi=EFi×A (1) 式中,Wi为土壤扬尘的总排放量(空气动力学当量直径在0—i μm 间的颗粒物,如PM2.5、PM10),t·a−1;EFi为土壤扬尘PMi的排放系数,t·(m2·a)−1;A为土壤扬尘面积,m2。
土壤扬尘PMi的排放系数主要受土壤表层颗粒物粒径分布、土壤质地、地表粗糙度、植被覆盖度、周边屏蔽条件以及气象条件等因素的影响。具体计算方法见式(2)和(3):
EFi=Di×C×(1−η)×10−4 (2) Di=ki×Iwe×f×L×V (3) 式中,EFi为土壤扬尘源的 PMi 排放系数,t·(m2·a)−1或t·(m2·month)−1;Di为 PMi 的起尘因子,t·(104 m2·a)−1 或t·(104 m2·month)−1;C为气候因子,无量纲;η为土壤扬尘控制措施的抑尘效率,%,本研究中统一取值为0;ki为粒度乘数,PMi在土壤扬尘中百分含量,%;Iwe为土壤风蚀指数, t·(104 m2·a)−1或t·(104 m2·month)−1;f为地面粗糙因子,取值为0.5;L为无屏蔽宽度因子,表示研究区域的开阔程度,即没有明显的阻挡物(如建筑物或者高大的树木)的最大范围。当无屏蔽宽度小于等于300 m时,L=0.7;当无屏蔽宽度大于300 m,小于600 m时,L=0.85;当无屏蔽宽度大于等于600 m时,L=1.0,本研究统一取值0.75;V为植被覆盖因子,指裸露土壤面积与总计算面积比例,也就是V=1-植被覆盖度。
1.3 本地参数的确定
1.3.1 气候因子(C)
气候因子是用来表征气象因素对土壤扬尘排放影响的重要指标,主要由风速、降水量、蒸发量和温度共同决定。
相比年气候因子而言,月气候因子能够反映短期的气候条件,因此在计算土壤扬尘排放量时宜选取月气候因子,具体计算公式如下式(4)、(5)和(6):
Cm=0.504×u3m/PE2 (4) 式中,Cm为月平均气候因子;um为月平均风速,m·s−1;PE为桑氏威特降水-蒸发指数,为年降水-蒸发指数。
PE=100×(p/E∗) (5) E∗=[0.5949+(0.1189×Ta)]×365 (6) 式中,p为年降水量,mm;E*为年潜在蒸发量,mm;Ta 为年平均温度,℃。
由于每月的降水-蒸发指数不能够精确评估短时间内土壤中的水分条件,因此,在计算月气候因子时应选择年降水-蒸发指数。
根据西宁气象局提供的2018年气象数据,计算得到了2018年年潜在蒸发量、年降水量和年桑氏威特降水-蒸发指数,如表1所示。结果表明,各站点年潜在蒸发量由小到大为:湟源县 < 湟中区 < 大通县 < 西宁市市区。湟中区的年降水量最大为669.80 mm,大通县的年降水量最小为483.40 mm。湟中区的年桑氏威特降水-蒸发指数最大为151.27,西宁市市区的年桑氏威特降水-蒸发指数最小为102.49。
表 1 各站点年气象资料Table 1. Meteorological data of each station站点名称Site name 年潜在蒸发量/mmAnnual potential evaporation 年降水量/mmAnnual precipitation 年桑氏威特降水-蒸发指数Annual Sandhurst Precipitation - evaporation index 大通县 445.53 483.40 108.50 湟源县 431.47 515.20 119.41 湟中区 442.79 669.80 151.27 西宁市区 506.50 519.10 102.49 气候因子是地区排放季节性变化的决定性因素[22]。计算得到的各地区各月气候因子见图1,湟源县1月份的气候因子值(0.000788)最高,西宁市区11月份的气候因子值(0.000017)最低。湟源县站点的各月份的月气候因子均高于其他站点相应月份的月气候因子。除湟源县外,其余各站点月气候因子最大值均出现在4、5月份。除大通县月气候因子最小值出现在12月份外,其余站点月气候因子最小值均出现在11月份。气候因子对颗粒物排放系数的影响主要来源于平均风速[20],春季4、5月时,风速较大,因此西宁市各区气候因子均处于较高水平。而湟源县的气候因子最高值出现在1月,是4月的1.11倍,这主要是由于当时受局部气象因素影响,湟源县1月份平均风速为2.81 m·s−1,是4月风速的1.03倍,且明显高于其他月份风速,进而导致湟源县1月份气候因子较高。总体看,湟中区的气候因子变化规律和数值与西宁市区接近。
1.3.2 粒度乘数(ki)
土壤粒度乘数是指不同粒径颗粒物在表层土壤中的百分含量。为使粒度乘数参数本地化,本研究通过采集研究区域内不同土地利用类型的土壤样品,通过再悬浮获取粒径信息,然后通过计算得到不同土地利用类型土壤样品的粒度乘数。2019年9月,采集研究区域内不同土地利用现状的表层(0—10 cm)土壤样品84个,采样点如图2所示,将采集到的土壤样品在实验室内自然阴干,过200目泰勒标准筛筛分,再悬浮的同时采用Optical Particle Sizer 3330测定粒度组成(PM2.5、PM10)。
将测定得到的粒度乘数结果依据不同土地利用类型进行分类统计,将各不同地块类型采样点位PM2.5粒度乘数的平均值作为对应地块类型的粒度乘数;对于采样未涉及到的土地利用类型的地块的粒度乘数,使用与其近似类型的地块的粒度乘数进行赋值,PM10粒度乘数采用扬尘指南推荐值。
1.3.3 土壤风蚀指数(Iwe)
本研究所需的土壤质地图由青海省生态环境监测中心提供,并结合《指南》推荐的土壤风蚀指数和美国制土壤质地划分标准,将本研究中的土壤质地划分为砂土、壤土、粉砂质壤土、黏壤土共4种类型,如图3。为研究土壤扬尘排放量的时间分布特征,在计算土壤扬尘月排放量时,采用月土壤风蚀指数。
1.3.4 植被覆盖因子(V)
植被覆盖因子可通过植被覆盖度计算得到,当地面完全没有植被覆盖时V等于1。植被覆盖度是指植被叶、茎、枝垂直向下投影面积占区域总面积的比例或百分数,通过遥感解译获得。本研究采用由美国NASA提供的16 d合成的空间分辨率为500 m的MOD13A1- NDVI产品作为基础数据进行植被覆盖度计算,数据格式为EOS-HDF。首先,利用NASA提供的MRT(MODIS Reprojection Tools)软件将下载的影像转换为UTM投影的tif格式。然后,利用Arcmap中提供的Extract by Mask工具,以研究区域边界矢量文件为掩膜裁剪出研究区域的NDVI数据,利用像元二分法模型来估算研究区域的植被覆盖度,结果见图3。
图3表明,1、2、12月份的植被覆盖度以极低覆盖度为主,6、7、8月份高植被覆盖度所占比例相比其他月份较高。植被季节性枯荣和农业生产直接影响地表裸露状况。夏季雨热同期,植被和农作物生长较为旺盛,植被覆盖度更高;反之冬季植被覆盖度较低。由图3可以看出,9、10月植被覆盖度降低较为显著,这主要是由于植被覆盖度主要受气温及降水影响和植被及农作物生长状况影响,西宁市各月气温及降水变化较大,促使植被覆盖度的月变化较大。与7、8月相比,9、10月的气温及降水均显著下降、农作物收割、森林草原植被等落叶,因此其植被覆盖度显著降低。
1.3.5 土壤扬尘源面积
将遥感影像解译并利用Arcgis中几何计算器计算各区县土壤扬尘源面积,结果见图4。西宁市土壤扬尘源总面积为6899.44 km2。其中,大通县土扬扬尘源面积最大,为2798.17 km2,占全市总土壤扬尘源面积的40.56%;其次是湟中区,占全市总土壤扬尘源面积的34.91%;排第三位的是湟源县,占全市总土壤扬尘源面积的21.48%。湟中区、湟源县和大通县拥有最多的土壤扬尘源面积,这与其较小的建成区面积及大面积农田、草地和林地有关。而西宁市市内4个区的土壤扬尘源面积很小,为210.62 km2,仅占总土壤扬尘源面积的3.06%,这主要与其建设用地面积较大有关。
2. 结果与讨论 (Results and discussion)
2.1 区县排放特征
根据公式计算得到每个月的土壤扬尘PM10和PM2.5的月排放量,并计算得到年排放量。2018年西宁市土壤扬尘PM2.5、PM10排放总量分别为353.13 t、1502.46 t。各区县排放量和贡献率见表2,空间分布见图5(网格:3 km ×3 km)。
表 2 各区县土壤扬尘PM2.5和PM10的年排放量和贡献率Table 2. Annual emissions and contribution rate of PM2.5 and PM10 from soil dust区县名称County PM2.5 PM10 年排放量/t Annual Emissions 贡献率/%Contribution Rate 年排放量/t Annual Emissions 贡献率/%Contribution Rate 城东区 0.90 0.25 3.78 0.25 城中区 0.16 0.05 0.67 0.04 城西区 0.59 0.17 2.44 0.16 城北区 0.88 0.25 3.79 0.25 大通县 148.09 41.94 634.15 42.21 湟中区 29.68 8.40 128.45 8.55 湟源县 172.82 48.94 729.18 48.53 合计 353.13 100.00 1502.46 100.00 图5表明,西南地区和北部地区土壤扬尘源排放量高于中部及东南部地区,空间差异较明显。湟源县土壤扬尘PM2.5、PM10排放量最大,分别为172.82 t、729.18 t,占研究区域内土壤扬尘PM2.5、PM10总排放量的48.94%、48.53%;其次,大通县的土壤扬尘排放量也较高,PM2.5、PM10排放量分别为148.09 t、634.15 t,是研究区域土壤扬尘PM2.5、PM10总排放量的41.94%、42.21%。湟源县和大通县土壤扬尘PM2.5、PM10排放量对研究区域内土壤扬尘排放量的贡献均约为90%,而土壤扬尘源面积位居第二位的湟中区土壤扬尘PM2.5、PM10排放量却明显低于湟源县。土壤扬尘排放量与气象因子,土壤扬尘源面积及植被覆盖因子有关。湟中区与湟源县和大通县的平均植被覆盖因子相近,分别为0.71、0.72、0.70,故差异主要源于气象因子。虽然湟中区土壤扬尘源面积位居第二,分别是大通县和湟源县的0.86、1.63倍,但在较小风速和较多降水的综合影响下,湟中区气象因子仅是湟源县和大通县的0.12倍和0.25倍,进而促使湟中区土壤扬尘排放量低于大通县和湟源县。
在西宁市的市内四区中,城中区土壤扬尘PM2.5、PM10排放量最小,分别为0.16 t和0.67 t;城北区和城东区的土壤扬尘排放量相近且较大,城北区PM2.5、PM10的排放量分别为0.88 t、3.79 t,城东区PM2.5、PM10的排放量分别为0.90 t、3.78 t。由于土壤扬尘源面积较小,市内四区的土壤扬尘排放量显著小于大通县、湟源县和湟中区。
排放强度经常作为比较各地区土壤扬尘源排放强弱的指标[20, 22-23]。本研究以国内研究较广泛的土壤扬尘PM2.5为例,与其他城市的排放强度相比较(表3),西宁市土壤扬尘排放强度高于常州,明显低于西安、郑州,以及保定、沧州、承德等京津冀地区城市。总体上看,西宁市土壤扬尘排放强度处于较低水平,一方面,西宁市由于海拔较高,年平均气温低于上述其他城市,促使其气候因子较小;另一方面,京津冀地区城市的土壤质地主要为壤土和砂土[22],风蚀指数较高,而西宁市土壤质地主要为粘壤土,其风蚀指数较低,促使西宁市土壤扬尘排放强度较低。
表 3 西宁市土壤扬尘排放强度与其他城市对比Table 3. Comparison of soil dust emission intensity between Xining and other cities区域Region 年份Year PM2.5排放量/tPM2.5 emission 土壤扬尘源面积/km2Area of soil dust source 排放强度/(t·km−2)Emission intensity 文献Reference 西宁 2018 353.13 6899.44 0.05 本研究 西安 2014 60.90 360.73 0.17 [21] 常州 2014 0.24 1569.46 0.0002 [18] 郑州 2013 597.00 208.00 2.87 [20] 保定 2015 2889.00 9455.00 0.31 [23] 沧州 2015 4786.00 10112.00 0.47 [23] 承德 2015 1450.00 4789.00 0.30 [23] 邯郸 2015 7409.00 7283.00 1.02 [23] 衡水 2015 2578.00 6753.00 0.38 [23] 廊坊 2015 1056.00 4340.00 0.24 [23] 秦皇岛 2015 1055.00 2468.00 0.43 [23] 石家庄 2015 2424.00 6510.00 0.37 [23] 唐山 2015 2685.00 6753.00 0.40 [23] 邢台 2015 6593.00 7691.00 0.86 [23] 张家口 2015 6774.00 11473.00 0.59 [23] 2.2 各月排放特征
西宁市土壤扬尘月排放量(图6)表明,各月份土壤扬尘PM2.5、PM10排放量存在一定差异。4月份排放量最大,PM2.5、PM10的排放量分别为59.08 t、251.68 t;西宁市4月正处春季,降水较少,地表疏松裸露干燥,风速较大,风速越大扬起的颗粒物越多且粒径范围越广[20],致使4月份西宁市土壤扬尘排放量最大。7月份土壤扬尘排放量最小,PM2.5、PM10排放量分别为6.41 t、27.40 t;这是因为西宁市7月份地表植被覆盖度较高,降水较多且风速不大,使地表颗粒物不易扬起,进而促使土壤扬尘排放量最小。
值得注意的是,虽然湟源县1月份气候因子略高于4月,但4月土壤扬尘总排放量却大于1月。整体上看,西宁市研究区域内1月与4月植被覆盖度相似。而1月湟源县气候因子是4月的1.11倍,因此湟源县1月排放量略高于4月。而其他区县1月的气候因子均显著低于4月,例如排放量较大的湟中和大通的4月气候因子分别是1月的2.35倍和1.15倍,故其他区县土壤扬尘排放量4月比1月的增量和高于湟源县4月比1月的降低量。因此,西宁市研究区域内土壤扬尘排放量1月比4月小。
2.3 不确定性分析
本研究使用Oracle Crystal Ball软件,采用蒙特卡罗方法针对本研究清单进行不确定性分析。设定随机抽样10000次,置信度95%,根据不同月份得到土壤扬尘排放量的不确定性范围,结果见表4。PM10排放量的不确定度范围为-21.90%—24.50%;PM2.5排放量的不确定度范围为-20.15%—22.00%,不确定度较低,表明土壤扬尘排放量的计算值与模拟均值较为接近。其中,不确定度最高是12月份的PM10排放,不确定度为-21.90%—24.50%;不确定度最低是9月份的PM2.5排放,不确定度为-0.75% —0.75%。不确定性来源包括:①由于研究区域较大,每个月份的遥感影像由3张 MOD13A1影像拼接而成,存在一定的色差,使植被覆盖因子的获取存在一定的不确定性。②难以获取准确详尽的无屏蔽宽度因子(L),该研究中选取 0.75 统一进行计算,可能会造成土壤扬尘排放量的低估。
表 4 不确定性分析结果Table 4. Uncertainty analysis月份Month PM2.5 PM10 中位值/tMedian 平均值/tMean 95%置信区间/t95% Confidence Interval 不确定度/%Uncertainty 中位值/tMedian 平均值/tMean 95%置信区间/t95% Confidence Interval 不确定度/%Uncertainty 1 6.31 6.31 6.13—6.52 −2.85—3.33 25.95 25.96 25.18—26.82 −3.00—3.31 2 5.38 5.39 5.17—5.63 −4.08—4.45 22.09 22.10 21.25—23.14 −3.85—4.71 3 2.76 2.76 2.71—2.82 −1.81—2.17 11.35 11.35 11.14—11.57 −1.85—1.94 4 5.52 5.52 5.44—5.62 −1.45—1.81 22.69 22.69 22.32—23.04 −1.63—1.54 5 3.24 3.24 3.21—3.27 −0.93—0.93 13.30 13.30 13.18—13.42 −0.90—0.90 6 1.00 1.00 0.99—1.01 −1.00—1.00 4.10 4.10 4.07—4.14 −0.73—0.98 7 0.44 0.44 0.43—0.44 −2.27—0.00 1.80 1.80 1.78—1.82 −1.11—1.11 8 0.50 0.50 0.5—0.51 0.00—2.00 2.07 2.07 2.05—2.08 −0.97—0.48 9 1.33 1.33 1.32—1.34 −0.75—0.75 5.48 5.48 5.43—5.53 −0.91—0.91 10 1.61 1.61 1.57—1.66 −2.48—3.11 6.61 6.61 6.41—6.84 −3.03—3.48 11 1.81 1.81 1.73—1.9 −4.42—4.97 7.42 7.43 7.12—7.76 −4.17—4.44 12 5.37 5.41 4.32—6.6 −20.15—22.00 22.18 22.33 17.44—27.8 −21.90—24.50 3. 结论(Conclusion)
(1)2018年西宁市土壤扬尘PM2.5、PM10排放量分别为353.13 t、1502.46 t。
(2)湟源县PM2.5、PM10排放量最大,分别为172.82 t、729.18 t。大通县的土壤扬尘排放量也较高,PM2.5、PM10排放量分别为148.09 t、634.15 t。湟中区土壤扬尘PM2.5、PM10排放量排第三,分别为29.68 t、128.45 t。在西宁市市内四区中,城中区的土壤扬尘PM2.5、PM10排放量最小,分别为0.16 t、0.67 t,城北区和城东区的土壤扬尘排放量相近且最大,城北区PM2.5、PM10的排放量分别为0.88 t、3.79 t,城东区PM2.5、PM10的排放量分别为0.90 t、3.78 t。
(3)4月份土壤扬尘PM2.5、PM10的排放量最大,分别为59.08 t、251.68 t。7月份排放量最小,分别为6.41 t、27.40 t。
(4)不确定性分析结果表明,在95%置信区间下,西宁市土壤扬尘PM2.5和PM10的不确定度均较低,PM10排放量的不确定度范围为-21.90%—24.50%;PM2.5排放量的不确定度范围为-20.15%—22.00%。
-
表 1 各站点年气象资料
Table 1. Meteorological data of each station
站点名称Site name 年潜在蒸发量/mmAnnual potential evaporation 年降水量/mmAnnual precipitation 年桑氏威特降水-蒸发指数Annual Sandhurst Precipitation - evaporation index 大通县 445.53 483.40 108.50 湟源县 431.47 515.20 119.41 湟中区 442.79 669.80 151.27 西宁市区 506.50 519.10 102.49 表 2 各区县土壤扬尘PM2.5和PM10的年排放量和贡献率
Table 2. Annual emissions and contribution rate of PM2.5 and PM10 from soil dust
区县名称County PM2.5 PM10 年排放量/t Annual Emissions 贡献率/%Contribution Rate 年排放量/t Annual Emissions 贡献率/%Contribution Rate 城东区 0.90 0.25 3.78 0.25 城中区 0.16 0.05 0.67 0.04 城西区 0.59 0.17 2.44 0.16 城北区 0.88 0.25 3.79 0.25 大通县 148.09 41.94 634.15 42.21 湟中区 29.68 8.40 128.45 8.55 湟源县 172.82 48.94 729.18 48.53 合计 353.13 100.00 1502.46 100.00 表 3 西宁市土壤扬尘排放强度与其他城市对比
Table 3. Comparison of soil dust emission intensity between Xining and other cities
区域Region 年份Year PM2.5排放量/tPM2.5 emission 土壤扬尘源面积/km2Area of soil dust source 排放强度/(t·km−2)Emission intensity 文献Reference 西宁 2018 353.13 6899.44 0.05 本研究 西安 2014 60.90 360.73 0.17 [21] 常州 2014 0.24 1569.46 0.0002 [18] 郑州 2013 597.00 208.00 2.87 [20] 保定 2015 2889.00 9455.00 0.31 [23] 沧州 2015 4786.00 10112.00 0.47 [23] 承德 2015 1450.00 4789.00 0.30 [23] 邯郸 2015 7409.00 7283.00 1.02 [23] 衡水 2015 2578.00 6753.00 0.38 [23] 廊坊 2015 1056.00 4340.00 0.24 [23] 秦皇岛 2015 1055.00 2468.00 0.43 [23] 石家庄 2015 2424.00 6510.00 0.37 [23] 唐山 2015 2685.00 6753.00 0.40 [23] 邢台 2015 6593.00 7691.00 0.86 [23] 张家口 2015 6774.00 11473.00 0.59 [23] 表 4 不确定性分析结果
Table 4. Uncertainty analysis
月份Month PM2.5 PM10 中位值/tMedian 平均值/tMean 95%置信区间/t95% Confidence Interval 不确定度/%Uncertainty 中位值/tMedian 平均值/tMean 95%置信区间/t95% Confidence Interval 不确定度/%Uncertainty 1 6.31 6.31 6.13—6.52 −2.85—3.33 25.95 25.96 25.18—26.82 −3.00—3.31 2 5.38 5.39 5.17—5.63 −4.08—4.45 22.09 22.10 21.25—23.14 −3.85—4.71 3 2.76 2.76 2.71—2.82 −1.81—2.17 11.35 11.35 11.14—11.57 −1.85—1.94 4 5.52 5.52 5.44—5.62 −1.45—1.81 22.69 22.69 22.32—23.04 −1.63—1.54 5 3.24 3.24 3.21—3.27 −0.93—0.93 13.30 13.30 13.18—13.42 −0.90—0.90 6 1.00 1.00 0.99—1.01 −1.00—1.00 4.10 4.10 4.07—4.14 −0.73—0.98 7 0.44 0.44 0.43—0.44 −2.27—0.00 1.80 1.80 1.78—1.82 −1.11—1.11 8 0.50 0.50 0.5—0.51 0.00—2.00 2.07 2.07 2.05—2.08 −0.97—0.48 9 1.33 1.33 1.32—1.34 −0.75—0.75 5.48 5.48 5.43—5.53 −0.91—0.91 10 1.61 1.61 1.57—1.66 −2.48—3.11 6.61 6.61 6.41—6.84 −3.03—3.48 11 1.81 1.81 1.73—1.9 −4.42—4.97 7.42 7.43 7.12—7.76 −4.17—4.44 12 5.37 5.41 4.32—6.6 −20.15—22.00 22.18 22.33 17.44—27.8 −21.90—24.50 -
[1] GENG N B, WANG J, XU Y F, et al. PM2.5 in an industrial district of Zhengzhou, China: Chemical composition and source apportionment [J]. Particuology, 2013, 11(1): 99-109. doi: 10.1016/j.partic.2012.08.004 [2] 肖致美, 徐虹, 李立伟, 等. 基于在线观测的天津市PM2.5污染特征及来源解析 [J]. 环境科学, 2020, 41(10): 4355-4363. XIAO Z M, XU H, LI L W, et al. Characterization and source apportionment of PM2.5 based on the online observation in Tianjin [J]. Environmental Science, 2020, 41(10): 4355-4363(in Chinese).
[3] 韩力慧, 张鹏, 张海亮, 等. 北京市大气细颗粒物污染与来源解析研究 [J]. 中国环境科学, 2016, 36(11): 3203-3210. doi: 10.3969/j.issn.1000-6923.2016.11.001 HAN L H, ZHANG P, ZHANG H L, et al. Pollution and source apportionment of atmospheric fine particles in Beijing [J]. China Environmental Science, 2016, 36(11): 3203-3210(in Chinese). doi: 10.3969/j.issn.1000-6923.2016.11.001
[4] 陈国磊, 周颖, 程水源, 等. 承德市大气污染源排放清单及典型行业对PM2.5的影响 [J]. 环境科学, 2016, 37(11): 4069-4079. CHEN G L, ZHOU Y, CHENG S Y, et al. Air pollutant emission inventory and impact of typical industries on PM2.5 in Chengde [J]. Environmental Science, 2016, 37(11): 4069-4079(in Chinese).
[5] HAO Y F, MENG X P, YU X P, et al. Quantification of primary and secondary sources to PM2.5 using an improved source regional apportionment method in an industrial city, China [J]. Science of the Total Environment, 2020, 706: 135715. doi: 10.1016/j.scitotenv.2019.135715 [6] 环境保护部. 扬尘源颗粒物排放清单编制技术指南[EB/OL]. [2021-4-17]. 北京: 环境保护部, [7] 方小珍, 孙列, 毕晓辉, 等. 宁波城市扬尘化学组成特征及其来源解析 [J]. 环境污染与防治, 2014, 36(1): 55-59, 79. doi: 10.3969/j.issn.1001-3865.2014.01.012 FANG X Z, SUN L, BI X H, et al. The chemical compositions and sources apportionment of re-suspended dust in Ningbo [J]. Environmental Pollution & Control, 2014, 36(1): 55-59, 79(in Chinese). doi: 10.3969/j.issn.1001-3865.2014.01.012
[8] 张琦. 基于卫星遥感的河南省中原城市群扬尘源颗粒物排放及空间分异研究[D]. 郑州: 郑州大学, 2019. ZHANG Q. Emission inventory and spatial distribution of particulate matter from dust sources in the central Plains urban agglomeration of China[D]. Zhengzhou: Zhengzhou University, 2019(in Chinese).
[9] 黄宇, 虎彩娇, 成海容, 等. 武汉市扬尘源颗粒物排放清单及空间分布特征 [J]. 武汉大学学报(理学版), 2018, 64(4): 354-362. doi: 10.14188/j.1671-8836.2018.04.011 HUANG Y, HU C J, CHENG H R, et al. Emission inventory and spatial distribution characteristics of particulate matters from dust source in Wuhan, China [J]. Journal of Wuhan University (Natural Science Edition), 2018, 64(4): 354-362(in Chinese). doi: 10.14188/j.1671-8836.2018.04.011
[10] PARK S H, GONG S L, GONG W, et al. Relative impact of windblown dust versus anthropogenic fugitive dust in PM2.5on air quality in North America [J]. Journal of Geophysical Research Atmospheres, 2010, 115(D16): D16210. doi: 10.1029/2009JD013144 [11] LÓPEZ-APARICIO S, GUEVARA M, THUNIS P, et al. Assessment of discrepancies between bottom-up and regional emission inventories in Norwegian urban areas [J]. Atmospheric Environment, 2017, 154: 285-296. doi: 10.1016/j.atmosenv.2017.02.004 [12] LI T K, BI X H, DAI Q L, et al. Improving spatial resolution of soil fugitive dust emission inventory using RS-GIS technology: An application case in Tianjin, China [J]. Atmospheric Environment, 2018, 191: 46-54. doi: 10.1016/j.atmosenv.2018.07.051 [13] PIANALTO F S, YOOL S R. Monitoring fugitive dust emission sources arising from construction: A remote-sensing approach [J]. GIScience & Remote Sensing, 2013, 50(3): 251-270. [14] PIANALTO F S, MEYANRT R, NEECK S P, et al. A remote sensing model of construction-related soil disturbance in southern Arizona [J]. International Society for Optics and Photonics, 2010, 7826: 782629. [15] 王社扣, 王体健, 石睿, 等. 南京市不同类型扬尘源排放清单估计 [J]. 中国科学院大学学报, 2014, 31(3): 351-359. doi: 10.7523/j.issn.2095-6134.2014.03.009 WANG S K, WANG T J, SHI R, et al. Estimation of different fugitive dust emission inventory in Nanjing [J]. Journal of University of Chinese Academy of Sciences, 2014, 31(3): 351-359(in Chinese). doi: 10.7523/j.issn.2095-6134.2014.03.009
[16] 李莉莉. 哈尔滨市高分辨率扬尘源排放清单及控制对策的研究[D]. 哈尔滨: 哈尔滨工业大学, 2018. LI L L. A highly resolved fugitive dust emission inventory in Harbin and assessment of control strategies[D]. Harbin: Harbin Institute of Technology, 2018(in Chinese).
[17] 李贝贝, 黄玉虎, 毕晓辉, 等. 北京市土壤风蚀扬尘排放因子本地化 [J]. 环境科学, 2020, 41(6): 2609-2616. doi: 10.13227/j.hjkx.201908243 LI B B, HUANG Y H, BI X H, et al. Localization of soil wind erosion dust emission factor in Beijing [J]. Environmental Science, 2020, 41(6): 2609-2616(in Chinese). doi: 10.13227/j.hjkx.201908243
[18] 杨卫芬, 程钟, 张洁, 等. 常州市裸露地面风蚀扬尘排放清单及分布特征研究 [J]. 环境监测管理与技术, 2020, 32(2): 56-60. doi: 10.3969/j.issn.1006-2009.2020.02.014 YANG W F, CHENG Z, ZHANG J, et al. Research on emission inventory and distribution characteristics of wind erosion dust from bare ground in Changzhou [J]. The Administration and Technique of Environmental Monitoring, 2020, 32(2): 56-60(in Chinese). doi: 10.3969/j.issn.1006-2009.2020.02.014
[19] 秦建新, 朱柯颖, 吴涛, 等. 长沙市城区施工扬尘和土壤扬尘污染时空特征研究 [J]. 中国环境监测, 2020, 36(4): 69-79. doi: 10.19316/j.issn.1002-6002.2020.04.09 QIN J X, ZHU K Y, WU T, et al. Study on spatial and temporal characteristics of construction dust and soil dust pollution sources in urban areas of Changsha [J]. Environmental Monitoring in China, 2020, 36(4): 69-79(in Chinese). doi: 10.19316/j.issn.1002-6002.2020.04.09
[20] 徐媛倩, 姜楠, 燕启社, 等. 郑州市裸露地面风蚀扬尘排放清单研究 [J]. 环境污染与防治, 2016, 38(4): 22-27. doi: 10.15985/j.cnki.1001-3865.2016.04.005 XU Y Q, JIANG N, YAN Q S, et al. Research on emission inventory of bareness wind erosion dust in Zhengzhou [J]. Environmental Pollution & Control, 2016, 38(4): 22-27(in Chinese). doi: 10.15985/j.cnki.1001-3865.2016.04.005
[21] 闫东杰, 丁毅飞, 玉亚, 等. 西安市人为源一次PM2.5排放清单及减排潜力研究 [J]. 环境科学研究, 2019, 32(5): 813-820. YAN D J, DING Y F, YU Y, et al. Inventory and reduction potential of anthropogenic PM2.5 emission in Xi'an city [J]. Research of Environmental Sciences, 2019, 32(5): 813-820(in Chinese).
[22] 宋立来, 李廷昆, 毕晓辉, 等. 京津冀地区高空间分辨率土壤扬尘清单构建及动态化方法 [J]. 环境科学研究, 2021, 34(8): 1771-1781. doi: 10.13198/j.issn.1001-6929.2021.05.03 SONG L L, LI T K, BI X H, et al. Construction and dynamic method of soil fugitive dust emission inventory with high spatial resolution in Beijing-Tianjin-Hebei region [J]. Research of Environmental Sciences, 2021, 34(8): 1771-1781(in Chinese). doi: 10.13198/j.issn.1001-6929.2021.05.03
[23] 郭祥, 冯海波, 陆雅静. 河北省土壤扬尘源PM2.5排放量估算 [J]. 河北工业科技, 2017, 34(6): 477-482. doi: 10.7535/hbgykj.2017yx06015 GUO X, FENG H B, LU Y J. Estimation of emissions of PM2.5 from soil dust in Hebei Province [J]. Hebei Journal of Industrial Science and Technology, 2017, 34(6): 477-482(in Chinese). doi: 10.7535/hbgykj.2017yx06015
-


 DownLoad:
