

-
磷(P)是海洋生态系统初级生产的限制性营养物质之一,影响着海洋浮游植物的生长、群落结构组成和固氮[1-2]。P通过大气沉降、河流和深海等途径进入表层海水,在营养贫乏的开阔海域,海洋浮游植物所需的营养盐主要来源于大气[3-4]。由于P没有稳定的气态形式[5],主要以固态形式存在于气溶胶中,且主要以粗颗粒形式存在[4-6]。P的自然来源主要为矿物风化[7],Mahowald等[8]认为矿物气溶胶对全球大气P的贡献约为82%,而人为来源对全球大气P的贡献仅为5%。但最近的研究发现,北印度洋孟加拉湾大气气溶胶中的P 有75%是来自农业化肥和生物质燃烧等人为排放[9]。王荣等[10]近期研究表明,人为和自然燃烧相关的磷排放占全球大气磷排放的50%以上。因此,近年来由于经济的迅速发展,人为排放的磷可能大幅增加。
与湿沉降的偶然性不同,干沉降是大气净化过程中持续而可靠的过程[11]。即使在降水量高的地区,从长期来看,干沉降作为一种清洁机制与湿沉降同样重要[12]。此外,大气干沉降是重要的外部营养源,支持相当一部分初级生产[13],如:大气干沉降贡献了孟加拉湾[14]约10%的初级生产力。含磷气溶胶沉降到海洋表面后,由于气溶胶在海水中的高沉降速率和低溶解度,不容易被生物利用[15]。但水溶性无机磷(DIP)沉降到表层海水后可直接被海洋浮游植物利用,是水溶性磷(TDP)的主要组成部分[8]。
南海位于西北太平洋的热带亚热带边缘,是世界上最大的边缘海之一,与中国、菲律宾、越南、印度尼西亚等几个快速发展的亚洲经济体相邻[16]。因此,南海从这些周边国家接收了大量的人为磷[13]。在冬季和春季南海以东北季风为主导风向,受到来自东北亚(如中国、日本)沙尘和人为污染的影响,夏季和秋季在西南季风的主导下,南海接受来自南海西南部(如马来西亚和印度尼西亚)生物质燃烧产生的颗粒物[17-18]。南海相对于其他相邻的边缘海域(如东海和黄海)浮游植物生产力较低[16],这是因为南海位于亚热带,深海的养分通量较低[19]。高水平的大气磷输入与低水平的海洋生产力的相结合,使得南海对人为磷沉降的敏感性增强,对研究人为大气磷沉降对海洋生产力的影响具有重要研究价值。
本研究在2012—2014年夏、秋和冬季利用科考船在南海采集了大气总悬浮颗粒物(TSP)样品,分析了水溶性离子及溶解性无机磷酸盐(DIP)浓度,结合后向轨迹模型讨论南海DIP的空间和季节分布特征、来源、沉降通量及对南海初级生产力的贡献。
-
2012年夏季(2012年7月17日至2012年9月4日)与2012年秋季(2012年8月29日至2012年10月11日)和2013年冬季(2013年12月4日至2014年1月6日),搭载“南海水体综合调查航次”在南海海域进行走航采样(图1)。在开船时用KC-1000大流量采样器采集TSP,夏季(37个)、秋季(30个)和冬季(28个)采样共收集TSP样品95个,采样流量为1.05 m3·min−1,采样器安置在甲板顶层,距离海平面约为15 m,单个样品采样时间不少于10 h,采样结束后将滤膜对折放入自封袋置于−20 ℃冰箱中保存。采样前将玻璃纤维滤膜用锡箔纸包裹置于425 ℃的马弗炉中烧4 h,去除滤膜中的杂质,用万分之一天平称量后对折放入自封袋后放置在4 ℃的冰箱中保存。
-
用干净的不锈钢剪刀剪取1/8的样品膜,加入50 mL超纯水冰水浴超声提取30 min,3500 r·min−1离心15 min后上清液用0.22 μm的微孔滤膜过滤。分析期间滤液保存在-20 ℃冰箱中直到分析结束。用离子色谱法测定水溶性磷酸盐及其他水溶性离子,Al采用氧化亚氮-乙炔火焰原子吸收法测定。离子浓度以水溶性离子标准储备液作为测定标准。
-
后向轨迹是指空气微团在大气中移动的实际轨迹,常用做大气沉降源的来源分析手段。本文利用美国空气质量实验室(NOAA ARL)提供的GDAS数据,用TrajStat软件进行模拟(http://ready.arl.noaa.gov/HYSPLIT.php),得到每个采样期间开始时到达该位置气团120 h的后向轨迹用来确定大气磷酸盐的远距离传输,模拟起始时间为中午12:00。
-
南海气溶胶中TSP浓度为2.56—168.56 μg·m−3,平均浓度为(63.4±44.1)μg·m−3,比西北太平洋[20]高,TSP浓度为44.8 μg·m−3,但低于中国边缘海之一的黄渤海[21],TSP浓度为78.2 μg·m−3。中国边缘海及西北太平洋TSP浓度均低于华南大陆[22]清洁点平均值(92.9 μg·m−3)及大中城市(161.6 μg·m−3)。
南海TSP中DIP的平均浓度为(9.8±16.7)ng·m−3,夏季和秋季DIP浓度分别为(0.14±0.07) ng·m−3(0.04—0.34 ng·m−3)和(0.9±0.6) ng·m−3(0.03—37.0 ng·m−3),均低于冬季(31.5±15.9) ng·m−3 (17.70—84.10 ng·m−3),夏秋季浓度间无显著性差异,但与冬季存在显著性差异(t-检验,P<0.05),可能与TSP中DIP来源的季节差异有关。夏、秋和冬季DIP浓度的最高值分别出现在越南近海、中沙群岛和越南近海(图2),秋季和冬季DIP浓度最高值出现期间,气团经过了东北亚沿海发达城市,受人为排放的影响较大。南海西部TSP中DIP的浓度更高,在西南季风时期,南海南部DIP浓度普遍高于北部(图2、图3),表明南海TSP中DIP的浓度分布与气团来源有关。与其他边缘海对比发现(表1),南海TSP中的DIP浓度小于黄渤海(夏季:(5.2±2.6) ng·m−3)、东海(年平均:(13.6±11.2) ng·m−3),海洋气溶胶中DIP浓度普遍低于受人为活动影响较大发达城市或海湾地区,如新加坡((110.0±40.0) ng·m−3)、秦皇岛((40.9±27.6) ng·m−3)和大亚湾(24.2 ng·m−3)等。
-
由于气溶胶中各参数间存在相同来源或大气过程,均会呈现一定的相关性。为了探讨南海气溶胶中DIP的主要来源,本研究运用了SPASS软件对气溶胶样品进行了DIP与其他各参数间的相关性分析(表2)。分析结果显示,夏季气溶胶DIP与二次离子NO3−呈正相关关系,r=0.7,P<0.01,与Al3+、Na+、NH4+、TC不存在相关性(P>0.05),表明DIP可能与NO3−具有相似来源。NO3−主要来源于化石燃料以及生物质燃烧释放的前体物NOX的二次转化[36],且NO3−和地壳源Al3+存在相关关系,r=0.5,P<0.01。所以夏季在西南季风的主导下,南海大气磷可能来源于气团经过东南亚后携带的少量陆地气溶胶。秋季DIP与NO3−和NH4+显著相关(r=0.9,0.9,P<0.01),NO3−和NH4+之间具有相关性(r=0.9,P<0.01),且均与Al3+呈负相关关系(r=-0.4,0.01<P<0.05和r=-0.5,P<0.01),而DIP与Al3+不存在相关性(r=-0.3,P>0.05)。表明DIP可能与NO3−、NH4+具有相似来源,来源于燃煤燃烧和机动车尾气等人为排放。冬季DIP与Al3+、NO3−、Na+、NH4+、TC均显著相关,相关系数r分别为0.6、0.8、0.7、0.9、0.5,P<0.01。与夏秋季相比,冬季在东北季风的影响下,气溶胶DIP受陆地排放源的影响显著,可能与Al3+、NO3−、Na+、NH4+和TC具有同源性。但这几种参数的可能来源差异较大,如Al3+主要来源于地壳(矿物粉尘和土壤等),Na+主要来源于海洋,而TC主要来源于生物质燃烧和汽车尾气等人为排放。冬季NO3−与NH4+显著相关,且相关性系数接近1,来源高度一直。与其他离子相比,DIP与NO3−和NH4+具有较高的相关性,冬季南海以东北季风为主导风向,气团经过了东北亚沿海发达城市,携带了大量城市污染物(如汽车尾气)进入南海上空,导致冬季DIP浓度远高于其他季节。此外冬季DIP与TSP浓度呈显著正相关(r=0.9,P<0.01),说明DIP可能是冬季气溶胶的主要组成成分之一或者具有相同来源[25],因为DIP在气溶胶中的含量相对较低(0.6 mg·g−1),所以冬季DIP与TSP可能具有相同来源。
-
由于气团输送对大气磷沉降的影响,对采样期间的气团输送进行了后向轨迹分析。从2012年夏季和秋季到2013年冬季南海海域后向轨迹分析分析可以看到(图4),南海海域气团来源存在明显的时空差异。夏季,研究海域主要受海洋气团(53.9%)的影响,除来自西北太平洋(10.5%)和来自爪哇海穿过卡里马塔海峡到达南海(26.3%)的纯海洋气团,还包含来自西南地区混合气团(印度洋海洋气团与东南亚陆地气团),假设其中一半是海洋气团(17.1%)一半是陆地气团(17.1%)。在夏季除来自西北太平洋的气团(0.2 ng·m−3)外,来自不同气团的DIP的值相接近。秋季,气团主要来自东印度洋与东南亚,来自南海本地的纯海洋气团(16.7%),东印度洋海洋气团与东南亚陆地的混合气团(40%),东南亚陆地气团(30%)以及西北太平洋海洋气团与东北亚陆地气团的混合气团(13.3%)的DIP浓度分别为0.5 ng·m−3、0.6 ng·m−3、0.8 ng·m−3和18.6 ng·m−3.可以看出秋季气团输送对南海大气磷酸盐影响显著。冬季,研究海域主要受东北亚陆地气团的影响,占研究期间气团输送的60.7%,除此之外还受西北太平洋与菲律宾混合气团(32.1%)和中南半岛及马来群岛陆地气团(7.2%)的影响。其中来自东北亚陆地气团的DIP浓度最高,为33.7 ng·m−3,不同气团的DIP浓度无显著性差异。
-
大气干沉降作为海洋的一个重要磷源,本研究估算了采样期间气溶胶水溶性无机磷酸盐的干沉降通量。影响干沉降的主要因素为气象条件和污染物本身的浓度水平,即海洋水溶性无机磷酸盐的干沉降通量计算公式如下:
F=86.4×Vd×Cp
式中,F为干沉降通量(μg·m−2·d−1);Vd表示干沉降速率(m·s−1);Cp是气溶胶中水溶性无机磷酸盐浓度(ng·m−3). 沉降速率受风速,空气湿度,温度等气象因素、颗粒粒径和采样方式等影响[37]。祁建华等人[24]在中国边缘海及西北太平洋通过结合模拟速率、测得的气溶胶颗粒尺寸分布和磷酸盐在气溶胶中的分布特征得到了南海磷酸盐平均沉降速率Vd=0.76 cm·s−1 .
计算得到夏、秋、冬季气溶胶水溶性无机磷酸盐DIP的干沉降通量分别为(0.1±0.05)、(0.6±0.4)、(20.7±10.5) μg·m−2·d−1,年平均为(6.4±11.0) μg·m−2·d−1,高于西北太平洋(2.5 μg·m−2·d−1)、大西洋(0.2 μg·m−2·d−1)等偏远海域,远低于黄渤海(50.2 μg·m−2·d−1),与埃拉特(6.2 μg·m−2·d−1)、胶州湾(8.4 μg·m−2·d−1)等海湾地区干沉降通量相近。海洋气溶胶DIP沉降量通常低于沿海发达城市,如中国青岛(96.1 μg·m−2·d−1)、中国台湾(26 μg·m−2·d−1)、新加坡(149.3 μg·m−2·d−1)和以色列(27.4 μg·m−2·d−1)等城市(表3)。在生物利用方面,总溶解性磷(TDP)被称作生物有效磷,包含了溶解性无机磷(DIP)和溶解性有机磷(DOP)。但本研究对总溶解性磷的测定条件有限,可利用DIP/TDP的值来估算TDP。rDIP/TDP取值52%[24],估算得到夏、秋、冬季气溶胶总溶解性磷TDP的干沉降通量分别为0.2、1.1、39.8 μg·m−2·d−1,夏秋冬季气溶胶TDP平均浓度为12.4 μg·m−2·d−1。假设大气干沉降的TDP可完全被海洋浮游植物利用,根据Redfield比值(C:N:P=106:16:1)估算得到由干沉降进入南海的TDP可支持南海1.3 mgC·m−2·d−1的海洋浮游植物碳生产。
-
(1)南海海域,气溶胶中DIP浓度冬季((31.50±15.93) ng·m−3)远高于夏季((0.14±0.07) ng·m−3)和秋季((0.87±0.61) ng·m−3),存在明显的季节变化特征。在夏秋冬季气溶胶DIP浓度由中南半岛往马来群岛依次递减的趋势,在夏季和秋季的过渡时期,南部海域的DIP浓度普遍高于北部海域,存在鲜明的空间分布特征。
(2)冬季节气溶胶DIP与Al3+、NO3−、NH4+等离子显著相关(P<0.01),表明其可能受陆地排放源的影响较大,如矿物粉尘、生物质燃烧和农业活动等,夏季(P>0.05)受陆地排放源的影响较小。后向轨迹分析表明,夏季和秋季气团以西南海陆混合气团为主,来自日本海,西北太平洋的气团具有最高的DIP浓度。冬季气团受中国南方城市及东南沿海城市排放的影响明显,DIP浓度较高。
(3)南海DIP的干沉降通量为(6.44±10.70) μg·m−2·d−1,冬季>秋季>夏季,大气TDP的干沉降可支持南海1.311 mg·m−2·d−1C的初级生产力。
南海气溶胶中溶解性无机磷的空间和季节分布特征
Spatial and seasonal distribution characteristics of dissolved inorganic phosphate of atmospheric aerosols over the South China Sea
-
摘要: 于2012年夏季、秋季和2013年冬季,利用科考船在南海海域对大气总悬浮颗粒物(TSP)样品进行采集。通过分析TSP水溶性离子及溶解性无机磷酸盐(DIP),对DIP在南海气溶胶中的浓度、空间及季节分布特征进行探讨,同时估算了DIP的干沉降通量。结果表明,冬季气溶胶DIP浓度为(31.50±15.93)ng·m−3,夏季为(0.14±0.07)ng·m−3,秋季为(0.87±0.61)ng·m−3,冬季远高于夏秋季;夏、秋和冬季南海气溶胶DIP干沉降通量分别为(0.1±0.05)、(0.6±0.4)、(20.7±10.5)μg·m−2·d−1,年平均沉降通量为(6.4±11.0)μg·m−2·d−1。根据Redfield比值C∶N∶P = 106∶16∶1,估算得到由干沉降进入南海的溶解性磷(TDP)可支持南海1.3mg·m−2·d−1C的海洋浮游植物碳生产。夏、秋季气溶胶DIP浓度由南海南部向北部递减,南海西部DIP浓度高于东部,冬季中南半岛附近海域DIP浓度较高,DIP浓度的季节变化和空间分布可能是因为夏秋季在西南季风的主导下,南海主要受印度洋海洋性气团影响,导致DIP浓度较低,而冬季则受东北季风携带的东北亚沿海城市污染物的影响,导致冬季DIP浓度更高。DIP与Al3+、NO3−、NH4+等离子相关性,表明南海冬季(P<0.01)可能受东北亚人为排放源影响较大,夏季(P>0.05)受人为排放源影响较小。
-
关键词:
- 南海 /
- 气溶胶 /
- 溶解性无机磷酸盐(DIP) /
- 干沉降通量 /
- 初级生产力
Abstract: Total suspended particulate matter (TSP) samples were collected over the South China Sea in the summer and autumn of 2012 and winter of 2013. Water-soluble ions and dissolved inorganic phosphate (DIP) were analyzed to discuss spatial and seasonal distribution characteristics of DIP over the South China Sea aerosol. The results show that the DIP concentration in winter、summer and autumn aerosol were (31.50±15.93) ng·m−3, (0.14±0.07) ng·m−3 and (0.87±0.61) ng·m−3, respectively, with high in winter and low in summer and autumn. The DIP deposition fluxes were (0.1±0.05), (0.6±0.4) and (20.7±10.5) μg·m−2·d−1 over the South China Sea in summer, autumn and winter, respectively, while the average annual deposition flux was (6.4±11.0) μg·m−2·d−1. According to Redfield ratio C∶N∶P=106∶16∶1, the deposition of total dissolved phosphate into surface sea over the South China Sea could produce 1.3 mg·m−2·d−1 Cvia marine phytoplankton. In summer and autumn, the DIP concentration decreased from the south and west to the north and east of the South China Sea. In winter, the DIP concentration was the highest near Indochina Peninsula. The correlations between DIP and Al3+, NO3− and NH4+ showed the DIP was greatly and little affected by anthropogenic emission sources in Northeast Asia in winter (P<0.01) and summer (P>0.05), respectively. -

-

图 1 南海气溶胶采样区域和走航路线示意
Figure 1. Aerosol sampling area and cruise lines over the South China Sea (dots represent the starting position of each sample, the lines represent the cruise lines)

图 2 南海各季节气溶胶中DIP浓度的空间分布
Figure 2. Spatial distribution of DIP concentration in three seasons over the South China Sea

图 3 夏秋过渡时期南海南北海域气溶胶DIP对比
Figure 3. Comparison of aerosol DIP between south and north over the South China Sea during transition of summer and autumn
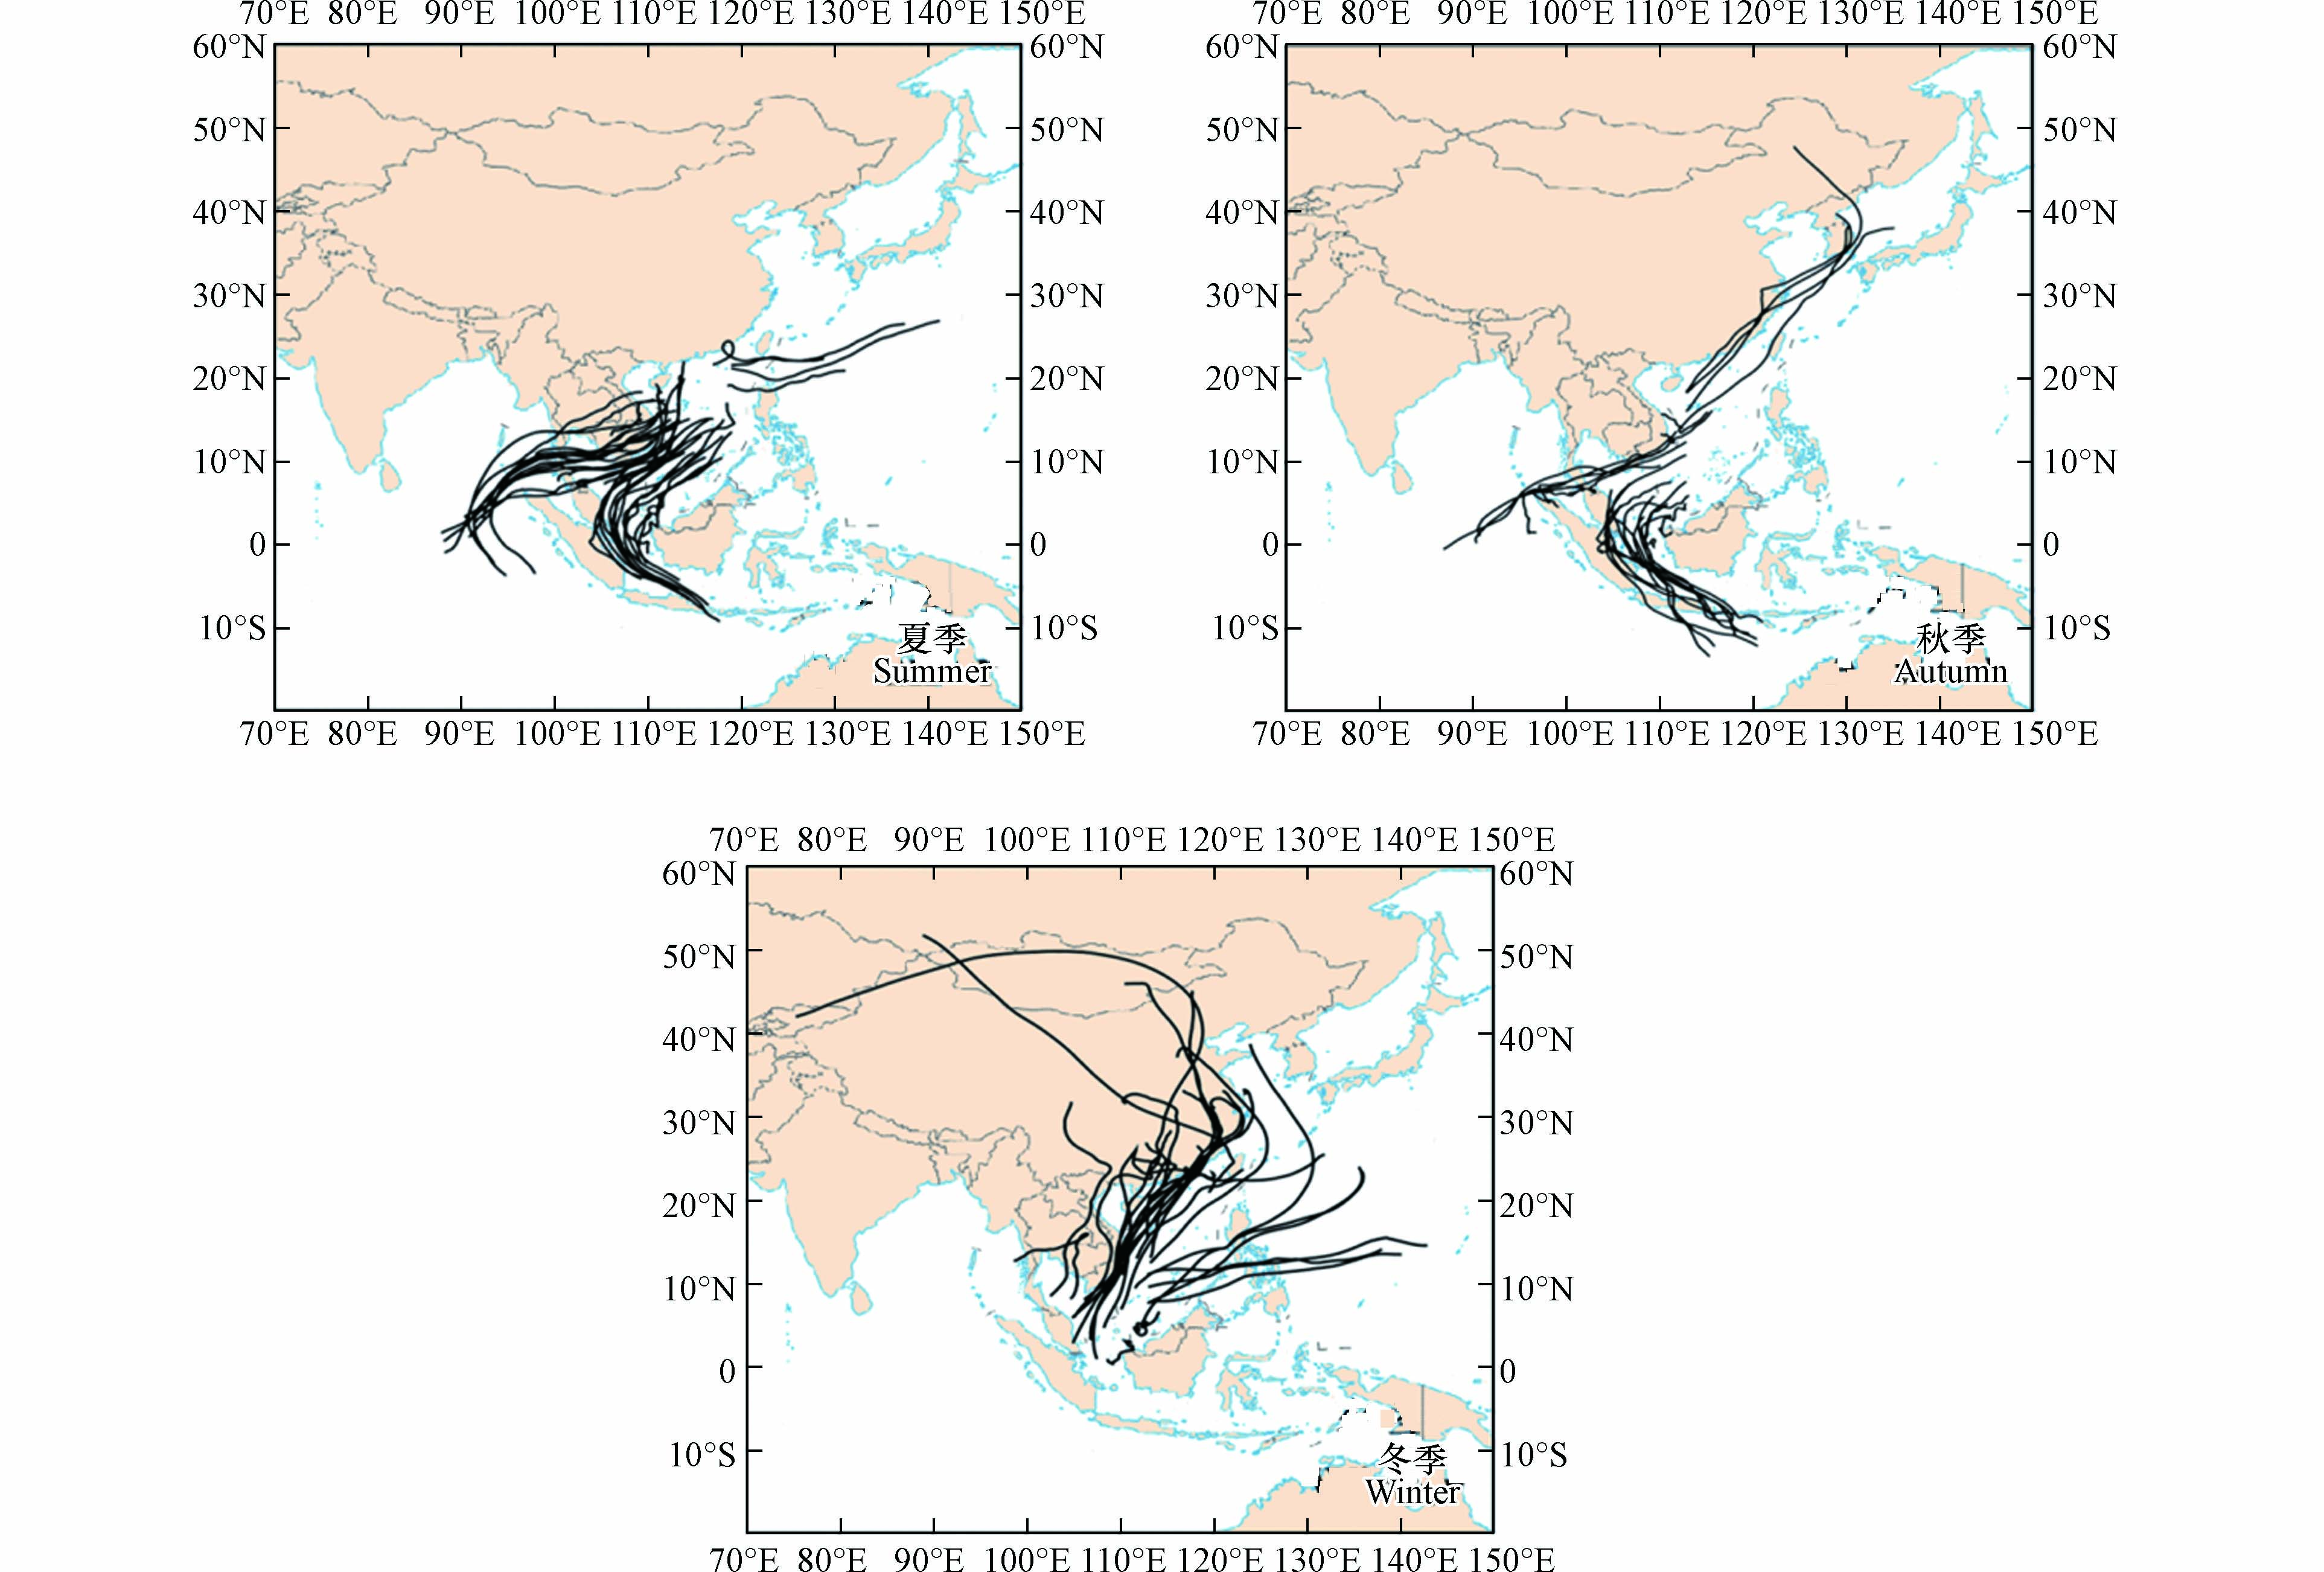
图 4 2012年夏季和秋季,2013年冬季南海海域后向轨迹分析
Figure 4. The backward trajectories over the South China Sea in summer and autumn of 2012, winter of 2013
表 1 南海TSP中DIP浓度与其他地区的研究对比
Table 1. Comparison of DIP concentrations in TSP in the South China Sea compared with other regions
采样地点
Study area采样时间
Sampling date分析方法
Analysis methodDIP/(ng·m−3) 数据来源
Reference南海 北部 2012年7—9月 离子色谱 0.14±0.07 本研究 南部 2012年8—10月 0.87±0.61 2013年12月—2014年1月 31.50±15.93 西北太平洋 2008年7—9月 磷钼蓝法 1.27±0.63 [23] 中国边缘海与西北太平洋 2005—2017年 离子色谱 35.03±34.10 [24] 东海 2005年1—12月 分光法 13.64±11.16 [25] 黄渤海 2016年6—7月 磷钼蓝法 5.24±2.55 [26] 阿拉伯海 2006年4—5月 吸光度法 12.40±3.10 [27] 孟加拉湾a 2009年1月 吸光度法 40.30±15.50 [14] 青岛 2011年8月 离子色谱 55.47 [28] 2012年12月—2013年4月 磷钼蓝法 21.80±21.40 [29] 2016年6—7月 磷钼蓝法 9.60±7.10 [30] 2017年11月—-2018年1月 磷钼蓝法 22.33 [31] 秦皇岛 2015年8月—2016年8月 连续流标准比色法 40.92±27.59 [32] 新加坡 2007年4月—2008年3月 磷钼蓝法 110.00±40.00 [33] 大亚湾 2015年9月—2017年3月 磷钼蓝法 24.18 [13] 胶州湾 2015年6月—2016年5月 连续流分光光度法 24.80±16.43 [34] 青藏高原贡嘎山b 2015年5月—2016年5月 磷钼蓝法 20.00±13.00 [35] 注:aPM10,bPM2.5.  下载: 导出CSV
表 2 DIP与气溶胶各参数的相关性
Table 2. Correlation between DIP and other ions and TC in three seasons
时间 Al3+ NO3− NO2− Na+ NH4+ TC 夏季 0.389 0.680** −0.167 0.149 0.232 −0.021 秋季 −0.334 0.909** 0.426* 0.160 0.902** −0.009 冬季 0.550** 0.828** 0.605** 0.738** 0.870** 0.492** 注: *表示在0.05水平上显著相关,**表示在0.01水平上显著相关.
Note: * correlation is significant at the 0.05 level,**correlation is significant at the 0.01 level.
下载: 导出CSV
表 3 南海与各地区DIP沉降通量对比
Table 3. Atmospheric dry deposition fluxes of DIP over the South China Sea and other regions
采样区域
Study area区域类型
Regional types时间
Sampling date沉降类型
Deposition types沉降通量/(μg·m−2·d−1)
Deposition fluxes文献
Reference南海 海洋 2012—2014 干沉降 6.4 本研究 青岛 沿海城市 2011—08 干沉降 96.1 [28] 伊比利亚 林地 1996—2008 湿沉降 17.7 [38] 西北太平洋 海洋 2014—2016 干沉降 2.5 [24] 黄渤海 海洋 2012—2017 干沉降 50.2 青藏高原 高寒森林 2015-05—2016-05 干沉降 174.7 [35] 埃拉特 海湾 2003-08—2005-09 干沉降 6.2 [39] 中国台湾 沿海城市 2005-01—2005-12 干沉降 26 [25] 大西洋 海洋 2001—2005 干沉降 0.2 [40] 新加坡 沿海城市 2007-04—2008-03 干沉降 149.3 [33] 湿沉降 59.7 胶州湾 海湾 2015-06—2016-05 干沉降 8.4 [34] 湿沉降 23.3 [41] 卡普费拉 半岛 2010—2013 干沉降 54.4 [42] 湿沉降 9.3 大亚湾 海湾 2015-09—2017-03 干沉降 4.3 [13] 以色列 沿海城市 1992—1998 干沉降 27.4 [43]
下载: 导出CSV
-
[1] VITOUSEK P M, PORDER S, HOULTON B Z, et al. Terrestrial phosphorus limitation: Mechanisms, implications, and nitrogen-phosphorus interactions [J]. Ecological Applications, 2010, 20(1): 5-15. doi: 10.1890/08-0127.1 [2] GRAHAM W F, DUCE R A. Atmospheric pathways of the phosphorus cycle [J]. Geochimica et Cosmochimica Acta, 1979, 43(8): 1195-1208. doi: 10.1016/0016-7037(79)90112-1 [3] CHEN H Y, HUNG C C, FANG T H, et al. Dry deposition and particle-size distribution of phosphorus in the marine atmosphere over the northeastern Coast of Taiwan [J]. Continental Shelf Research, 2008, 28(6): 756-766. doi: 10.1016/j.csr.2007.12.008 [4] DUCE R A, LISS P S, MERRILL J T, et al. The atmospheric input of trace species to the world ocean [J]. Global Biogeochemical Cycles, 1991, 5(3): 193-259. doi: 10.1029/91GB01778 [5] BENITEZ-NELSON C R. The biogeochemical cycling of phosphorus in marine systems [J]. Earth-Science Reviews, 2000, 51(1/2/3/4): 109-135. [6] FURUTANI H, MEGURO A, IGUCHI H, et al. Geographical distribution and sources of phosphorus in atmospheric aerosol over the North Pacific Ocean [J]. Geophysical Research Letters, 2010, 37(3): 32. doi: 10.1029/2009gl041367 [7] VET R, ARTZ R S, CAROU S, et al. A global assessment of precipitation chemistry and deposition of sulfur, nitrogen, sea salt, base cations, organic acids, acidity and pH, and phosphorus [J]. Atmospheric Environment, 2014, 93: 3-100. doi: 10.1016/j.atmosenv.2013.10.060 [8] MAHOWALD N, JICKELLS T D, BAKER A R, et al. Global distribution of atmospheric phosphorus sources, concentrations and deposition rates, and anthropogenic impacts [J]. Global Biogeochemical Cycles, 2008, 22(4): 485. doi: 10.1029/2008gb003240 [9] SRINIVAS B, SARIN M J C S. Atmospheric deposition of phosphorus to the Northern Indian Ocean [J]. Current Science, 2015: 1300-1305. [10] WANG R, BALKANSKI Y, BOUCHER O, et al. Significant contribution of combustion-related emissions to the atmospheric phosphorus budget [J]. Nature Geoscience, 2015, 8(1): 48-54. doi: 10.1038/ngeo2324 [11] LOUGHNER C P, TZORTZIOU M, SHRODER S, et al. Enhanced dry deposition of nitrogen pollution near coastlines: A case study covering the Chesapeake Bay estuary and Atlantic Ocean coastline [J]. Journal of Geophysical Research:Atmospheres, 2016, 121(23): 14221-14238. doi: 10.1002/2016JD025571 [12] QI J H, SHI J H, GAO H W, et al. Atmospheric dry and wet deposition of nitrogen species and its implication for primary productivity in coastal region of the Yellow Sea, China [J]. Atmospheric Environment, 2013, 81: 600-608. doi: 10.1016/j.atmosenv.2013.08.022 [13] WU Y C, ZHANG J P, LIU S L, et al. Aerosol concentrations and atmospheric dry deposition fluxes of nutrients over Daya Bay, South China Sea [J]. Marine Pollution Bulletin, 2018, 128: 106-114. doi: 10.1016/j.marpolbul.2018.01.019 [14] SRINIVAS B, SARIN M M. Atmospheric pathways of phosphorous to the Bay of Bengal: Contribution from anthropogenic sources and mineral dust [J]. Tellus B:Chemical and Physical Meteorology, 2012, 64(1): 17174. doi: 10.3402/tellusb.v64i0.17174 [15] STOCKDALE A, KROM M D, MORTIMER R J G, et al. Understanding the nature of atmospheric acid processing of mineral dusts in supplying bioavailable phosphorus to the oceans [J]. PNAS, 2016, 113(51): 14639-14644. doi: 10.1073/pnas.1608136113 [16] KIM T W, LEE K, DUCE R, et al. Impact of atmospheric nitrogen deposition on phytoplankton productivity in the South China Sea [J]. Geophysical Research Letters, 2014, 41(9): 3156-3162. doi: 10.1002/2014GL059665 [17] ATWOOD S A, REID J S, KREIDENWEIS S M, et al. Size resolved measurements of springtime aerosol particles over the northern South China Sea [J]. Atmospheric Environment, 2013, 78: 134-143. doi: 10.1016/j.atmosenv.2012.11.024 [18] XIAO H W, XIAO H Y, LUO L, et al. Atmospheric aerosol compositions over the South China Sea: Temporal variability and source apportionment [J]. Atmospheric Chemistry and Physics, 2017, 17(4): 3199-3214. doi: 10.5194/acp-17-3199-2017 [19] WONG G T F, TSENG C M, WEN L S, et al. Nutrient dynamics and N-anomaly at the SEATS station [J]. Deep Sea Research Part II:Topical Studies in Oceanography, 2007, 54(14/15): 1528-1545. [20] 曾梓琪, 肖红伟, 毛东阳, 等. 西北太平洋冬季气溶胶中稳定碳同位素组成特征 [J]. 环境科学学报, 2020, 40(7): 2384-2390. ZENG Z Q, XIAO H W, MAO D Y, et al. Stable carbon isotope composition in marine aerosols over the western North Pacific in winter [J]. Acta Scientiae Circumstantiae, 2020, 40(7): 2384-2390(in Chinese).
[21] 袁帅, 王艳, 刘汝海, 等. 黄渤海气溶胶中砷的分布特征和季节变化 [J]. 环境科学, 2021, 42(9): 4151-4157. YUAN S, WANG Y, LIU R H, et al. Distribution characteristics and seasonal variations of arsenic in atmospheric aerosols over the Yellow Sea and Bohai sea [J]. Environmental Science, 2021, 42(9): 4151-4157(in Chinese).
[22] 吴兑. 南海北部大气气溶胶水溶性成分谱分布特征 [J]. 大气科学, 1995, 19(5): 615-622. doi: 10.3878/j.issn.1006-9895.1995.05.11 WU D. The distribution characteristics of water-soluble composition of atmospheric aerosol over north of the South China sea [J]. Scientia Atmospherica Sinica, 1995, 19(5): 615-622(in Chinese). doi: 10.3878/j.issn.1006-9895.1995.05.11
[23] 孙晨. 中国第三次北极考察航线海洋边界层气溶胶中磷元素的分布与来源分析[D]. 合肥: 中国科学技术大学, 2015. SUN C. Characterization and sources of phosphorus in the aerosol during the 3rd Chinese arctic research expediton[D]. Hefei: University of Science and Technology of China, 2015(in Chinese).
[24] QI J H, YU Y, YAO X H, et al. Dry deposition fluxes of inorganic nitrogen and phosphorus in atmospheric aerosols over the Marginal Seas and Northwest Pacific [J]. Atmospheric Research, 2020, 245: 105076. doi: 10.1016/j.atmosres.2020.105076 [25] CHEN H Y, CHEN L D. Importance of anthropogenic inputs and continental-derived dust for the distribution and flux of water-soluble nitrogen and phosphorus species in aerosol within the atmosphere over the East China Sea [J]. Journal of Geophysical Research Atmospheres, 2008, 113(D11): D11303. doi: 10.1029/2007JD009491 [26] 张瑞峰, 祁建华, 丁雪, 等. 青岛近海及黄渤海大气气溶胶中不同形态氮磷质量浓度及组成特征 [J]. 环境科学, 2018, 39(1): 38-48. ZHANG R F, QI J H, DING X, et al. Concentrations and compositions of different forms of nitrogen and phosphorus in atmospheric aerosols in the Qingdao coastal region and over the yellow and Bohai sea [J]. Environmental Science, 2018, 39(1): 38-48(in Chinese).
[27] SRINIVAS B, SARIN M M. Atmospheric deposition of N, P and Fe to the northern Indian ocean: Implications to C- and N-fixation [J]. Science of the Total Environment, 2013, 456/457: 104-114. doi: 10.1016/j.scitotenv.2013.03.068 [28] 祁建华, 王玉珏, 刁明亚, 等. 青岛夏季不同天气下气溶胶中无机氮磷的浓度及沉降研究 [J]. 中国海洋大学学报(自然科学版), 2013, 43(10): 88-96. QI J H, WANG Y J, DIAO M Y, et al. Distribution and deposition of inorganic nitrogen and phosphorus in aerosol in different weather conditions in summer in Qingdao [J]. Periodical of Ocean University of China, 2013, 43(10): 88-96(in Chinese).
[29] SHI J H, WANG N, GAO H W, et al. Phosphorus solubility in aerosol particles related to particle sources and atmospheric acidification in Asian continental outflow [J]. Atmospheric Chemistry and Physics, 2019, 19(2): 847-860. doi: 10.5194/acp-19-847-2019 [30] 王楠, 马淼, 石金辉, 等. 夏季青岛大气气溶胶中不同形态磷的浓度、来源及沉降通量 [J]. 环境科学, 2018, 39(9): 4034-4041. WANG N, MA M, SHI J H, et al. Concentrations, sources, and dry deposition fluxes of different forms of phosphorus in Qingdao aerosols in summer [J]. Environmental Science, 2018, 39(9): 4034-4041(in Chinese).
[31] 马淼, 石金辉, 高会旺, 等. 冬季青岛不同气团来源气溶胶中磷浓度及溶解度 [J]. 中国环境科学, 2020, 40(9): 3748-3755. doi: 10.3969/j.issn.1000-6923.2020.09.005 MA M, SHI J H, GAO H W, et al. Concentration and solubility of airborne particulate phosphorus at Qingdao in winter related to various types of air mass [J]. China Environmental Science, 2020, 40(9): 3748-3755(in Chinese). doi: 10.3969/j.issn.1000-6923.2020.09.005
[32] YU L M, MA X D, GAO H W, et al. Distribution and source identification of nitrogen and phosphorus in aerosols in the Qinhuangdao Coast, North China [J]. Atmospheric Environment, 2020, 234: 117475. doi: 10.1016/j.atmosenv.2020.117475 [33] HE J, BALASUBRAMANIAN R, BURGER D F, et al. Dry and wet atmospheric deposition of nitrogen and phosphorus in Singapore [J]. Atmospheric Environment, 2011, 45(16): 2760-2768. doi: 10.1016/j.atmosenv.2011.02.036 [34] XING J W, SONG J M, YUAN H M, et al. Water-soluble nitrogen and phosphorus in aerosols and dry deposition in Jiaozhou Bay, North China: Deposition velocities, origins and biogeochemical implications [J]. Atmospheric Research, 2018, 207: 90-99. doi: 10.1016/j.atmosres.2018.03.001 [35] MENG Y, LI R, FU H B, et al. The sources and atmospheric pathway of phosphorus to a high alpine forest in eastern Tibetan Plateau, China [J]. Journal of Geophysical Research:Atmospheres, 2020, 125(4): 3. doi: 10.1029/2019jd031327 [36] 张永运, 王宏青, 肖浩, 等. 东北亚冬季PM2.5水溶性离子空间分布特征及来源 [J]. 中国环境科学, 2019, 39(6): 2291-2298. doi: 10.3969/j.issn.1000-6923.2019.06.007 ZHANG Y Y, WANG H Q, XIAO H, et al. Winter spatial distribution and source apportionment of water-soluble ions in PM2.5, Northeast Asia [J]. China Environmental Science, 2019, 39(6): 2291-2298(in Chinese). doi: 10.3969/j.issn.1000-6923.2019.06.007
[37] 赵雄飞, 王体健, 黄满堂, 等. 大气污染物干沉降速度和通量的计算方法比较: 以南京仙林地区为例 [J]. 装备环境工程, 2019, 16(6): 129-137. ZHAO X F, WANG T J, HUANG M T, et al. Comparison of methods for dry deposition velocity and flux estimation of atmospheric pollutants—A case study in Xianlin district, Nanjing [J]. Equipment Environmental Engineering, 2019, 16(6): 129-137(in Chinese).
[38] IZQUIERDO R, BENÍTEZ-NELSON C R, MASQUÉ P, et al. Atmospheric phosphorus deposition in a near-coastal rural site in the NE Iberian Peninsula and its role in marine productivity [J]. Atmospheric Environment, 2012, 49: 361-370. doi: 10.1016/j.atmosenv.2011.11.007 [39] CHEN Y, MILLS S, STREET J, et al. Estimates of atmospheric dry deposition and associated input of nutrients to Gulf of Aqaba seawater [J]. Journal of Geophysical Research Atmospheres, 2007, 112(D4): D04309. [40] BAKER A R, LESWORTH T, ADAMS C, et al. Estimation of atmospheric nutrient inputs to the Atlantic Ocean from 50°N to 50°S based on large-scale field sampling: Fixed nitrogen and dry deposition of phosphorus [J]. Global Biogeochemical Cycles, 2010, 24(3): 78. doi: 10.1029/2009gb003634 [41] XING J W, SONG J M, YUAN H M, et al. Fluxes, seasonal patterns and sources of various nutrient species (nitrogen, phosphorus and silicon) in atmospheric wet deposition and their ecological effects on Jiaozhou Bay, North China [J]. Science of the Total Environment, 2017, 576: 617-627. doi: 10.1016/j.scitotenv.2016.10.134 [42] de FOMMERVAULT O P, MIGON C, DUFOUR A, et al. Atmospheric input of inorganic nitrogen and phosphorus to the Ligurian Sea: Data from the Cap Ferrat coastal time-series station [J]. Deep Sea Research Part I:Oceanographic Research Papers, 2015, 106: 116-125. doi: 10.1016/j.dsr.2015.08.010 [43] HERUT B, KROM M D, PAN G, et al. Atmospheric input of nitrogen and phosphorus to the Southeast Mediterranean: Sources, fluxes, and possible impact [J]. Limnology and Oceanography, 1999, 44(7): 1683-1692. doi: 10.4319/lo.1999.44.7.1683 -
 点击查看大图
计量
- 文章访问数: 3769
- HTML全文浏览数: 3769
- PDF下载数: 68
- 施引文献: 0
