-
全球海洋上部及近岸水域同时发生着有机物的自养生产和异养降解两个方向相反的生物地球化学过程,自养生产即自养细菌和浮游植物利用无机态营养盐合成生产并最终释放有机物到水体中[1-2],而异养降解则是异养细菌选择性地降解水体中有机物并转化为无机态,这两个过程驱动着全球海洋营养物质循环[3]. 自生DON是指浮游生物食物网中病毒与死亡细胞自溶、海藻、浮游植物与细菌直接分泌和摄食浮游植物的原始与多细胞动物排泄释放的DON[4]. 外来DON是指通过大气沉降[5]、沉积物释放[6]和陆源输入[7]等方式进入到水体的DON.
本文采用2000—2014年在珠江口牛尾海每月水质调查监测结果,采用DIN和总溶解氮(TDN)浓度系列子集导出的数据来分析湾中DON浓度的时空变化,结合叶绿素-a (Chl-a)的实测结果,确定湾中DON滞留时间(TDON),利用二元混合质量平衡模式[8-9],结合盐度(S)实测数据,探讨研究自养生产和异养降解过程产生的剩余DON(ΔDON),研究湾中生物活动驱动氮循环机制及其碳源/汇特征.
-
牛尾海西邻珠江口、东靠大鹏湾,是半封闭的小海湾. 该海湾集水区(包括湾中的海岛)约73 km2,水域面积约为42.3 km2,平均水深14.2 m,容积约为6×10⁸ m3,且湾顶较浅、湾口较深,无大的径流输入;潮差平均为1.0 m,水动力较弱,是弱潮区[10]. 牛尾海受季风影响明显,4—9月为湿季,盛行西南季风,10月—翌年3为干季,盛行东北季风,降雨总量约为2398.5 mm·a−1,总蒸发量约为1227.3 mm·a−1,降雨主要集中在湿季,湿、干季总雨量之差约为每月290.0 mm,而湿、干季总蒸发量相差较小,约为每月35.0 mm.
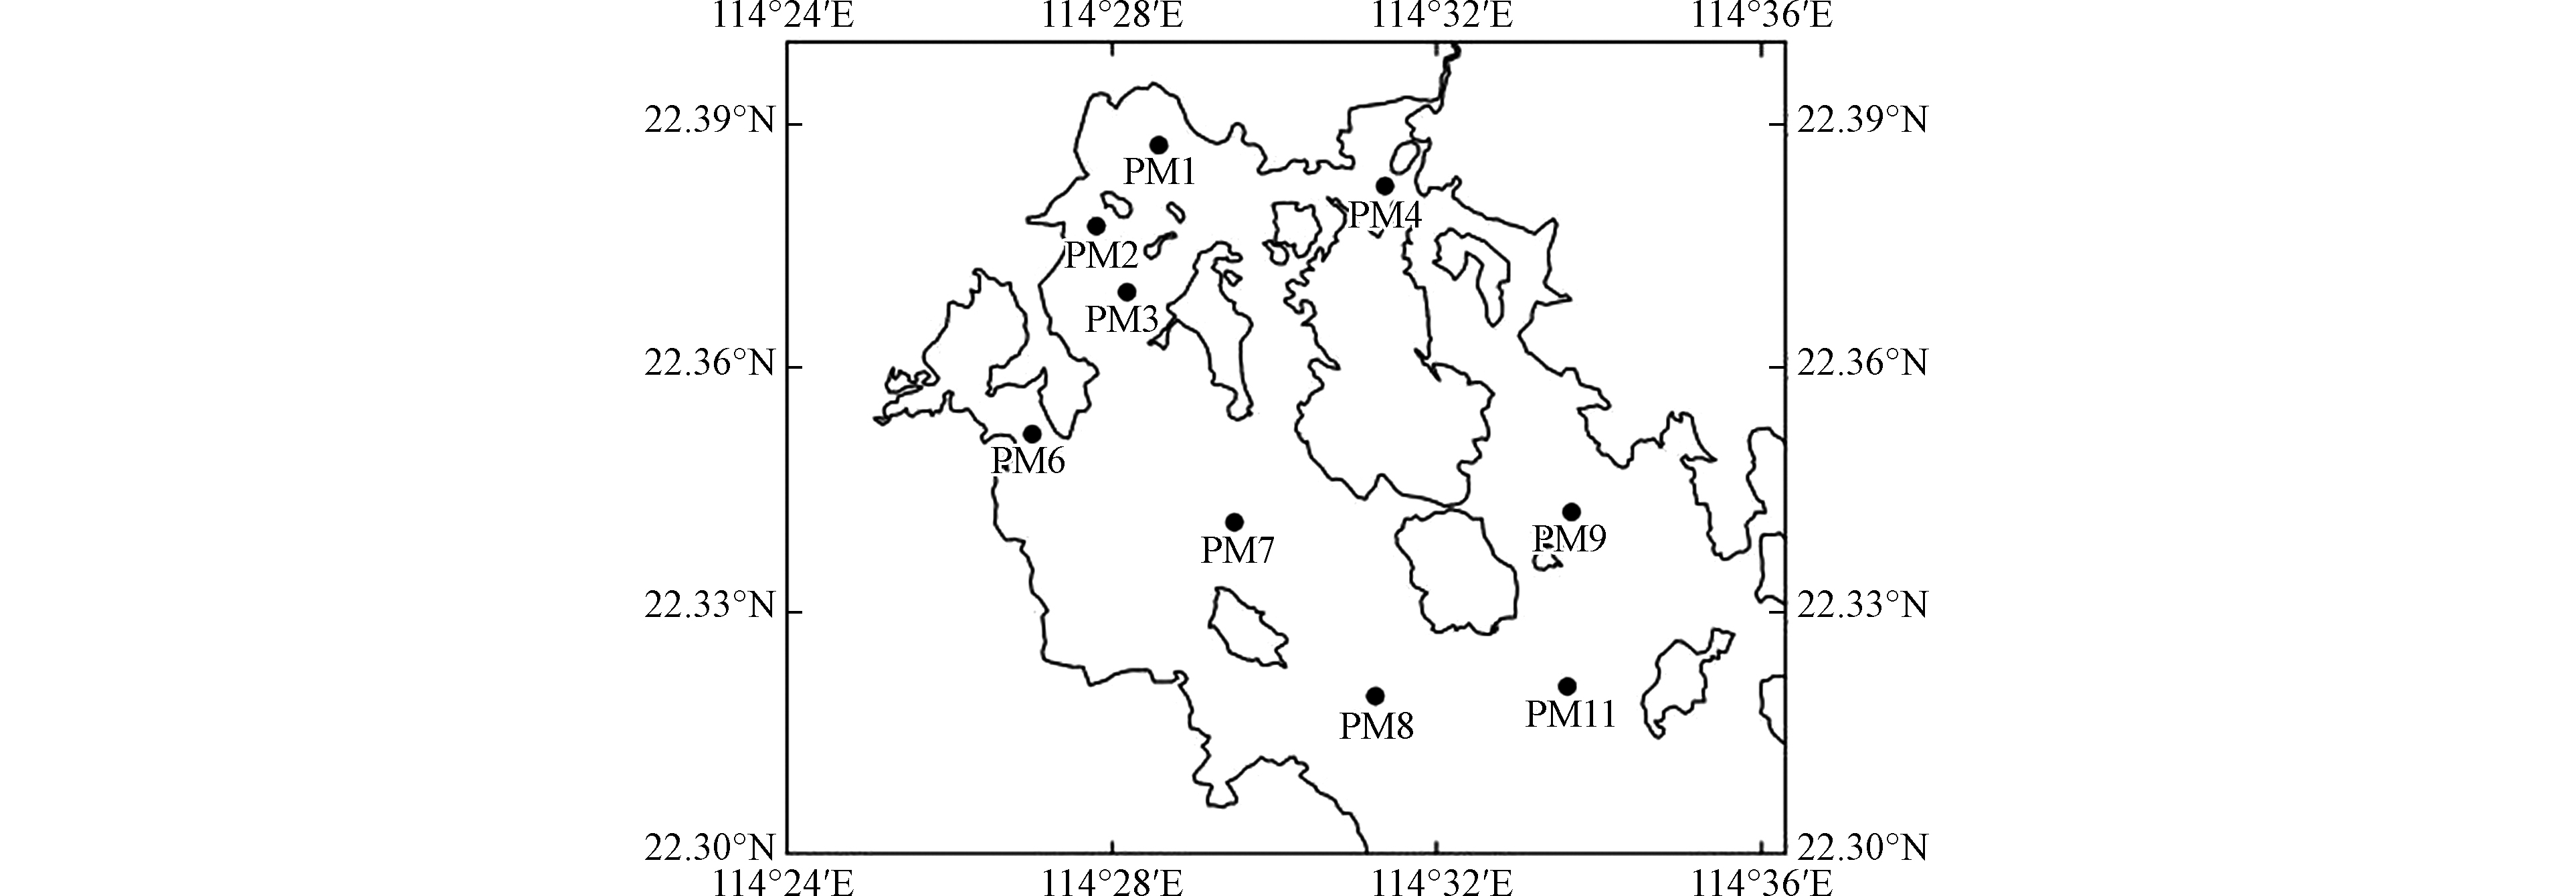
在牛尾海布设了9个水质调查监测站位,分别是PM1—PM4、PM6—PM9和PM11, 其中,PM1—PM4和PM6调查站位于湾顶,PM7—PM9和PM11站位处于海湾的主区域(图1).
在湾附近观测到的大气中无机氮(IN)和有机氮(ON)干湿沉降总量分别为2.23 t·(km2·a)−1和1.34 t·(km2·a)−1[11]. 依据2000—2014年注入湾的小河溪水中盐度(S)、DIN和DON的实测数据,估算的盐度(S)接近于零的入湾淡水(FW)中DIN和DON浓度分别约为1.340 mg·L−1和0.323 mg·L−1. 依据中国深圳和中国香港合作研究组的报告,没有污水排放入牛尾海(unpublished data). 利用湾的集水区面积、水域面积、年总雨量和年总蒸发量计算的FW量为135×106 m3·a−1,并利用小河溪中DIN和DON浓度以及IN和ON年沉降总量(所有沉降的IN和ON分别被当作水域中的DIN和DON),求出的排放入湾淡水中DIN和DON浓度分别为1.545 mg·L−1和0.624 mg·L−1.
-
采用CTD原位观测海水温度(T)和盐度(S),同时采集水样,当水深(H)<4 m时仅取表层样品(海面下1 m);当4 m≤H<6 m时采集表、底层(离底1 m)样品;H≥6 m时,采集表层、中层(0.6H)和底层样品. 营养盐(包括DIN和DON)样品采用孔径0.45 μm滤膜真空过滤,样品瓶置于−20 ℃冷柜中保存;采用直径47 mm孔径0.45 μm滤膜真空(最大0.3 bar)过滤500 mL Chl-a水样,将对折并包好的滤膜放入密实袋中避光冷藏保存,上述营养盐和Chl-a样品均带回室内实验室测试. 采用SBE18 pH和SBE32Y溶解氧传感器现场测量pH和溶解氧(DO).
-
采用分光光度计测定Chl-a,流动注射自动分析仪测定氨氮(NH3-N)、亚硝酸盐氮(NO−2-N)、硝酸盐氮(NO−3-N)或凯氏氮(TKN). DIN由等式ρ[DIN]=ρ[NH3-N]+ρ[NO−2-N]+ρ[NO−3-N]计算;DON由等式ρ[DON]=ρ[TKN]-ρ[NH3-N]计算[12-13],自养生产和异养降解过程产生的ΔDON计算方法[14]为:ΔDON=ρ[DON– (1–SBW/SSW)×ρ[DONFW]–SBW/SSW×ρ[DONSW],式中ρ[DONFW]、ρ[DONSW]和ρ[DON]分别是排放入湾淡水(FW包含雨水,S≈0)、湾口外附近海水(SW)和湾内水(BW)中的DON;SSW和SBW分别是SW和BW中的S. 观测数据的T、S、pH、DO、透明度、NH3-N、NO−2-N、NO−3-N、TKN和Chl-a的不确定度或检出限分别为0.1 °C、0.1、0.1、0.1 mg·L−1、0.1 m、0.005 mg·L−1、0.002 mg·L−1、0.002 mg·L−1、0.05 mg·L−1和0.2 μg·L−1 [15].
根据实测数据,求出各站位水柱(包括表层、中层和底层)月平均DON浓度. 选取冬季(1月)、春季(4月)、夏季(7月)和秋季(10月)分析DON的时空变化;根据所有监测站表、中、底层海水中月平均DON浓度分析年度变化;采用各航次平均DON浓度研究年际变化.
-
干季表层T(约20.8 °C)略高于底层T(约20.5 °C),湿季表层T(约27.1 °C)明显高于底层T(约24.7 °C)(表1). 相反,干季表层S(约32.6)略低于底层S(约32.7),湿季表层S(约31.1)明显低于底层S(约33.1)(表1). 干季表、底层pH和DO没有太大差别,分别约为8.1 mg·L−1和7.1 mg·L−1,但湿季表层pH(约8.2)和DO(约6.4 mg·L−1)高于底层pH(约8.1)和DO(约5.3 mg·L−1)(表1). 干、湿季Chl-a差别不大,表层和底层Chl-a分别约为2.6 μg·L−1和2.4 μg·L−1. 干季表层和底层DIN分别约为0.062 mg·L−1和0.069 mg·L−1,而湿季表层和底层DIN分别约为0.047 mg·L−1和0.069 mg·L−1(表1). 湿季水柱层化明显,干季水体混合均匀,且干、湿季环境因子差别明显,主要是受到季风的影响.
无论在湿季还是在干季,湾顶水域中Chl-a和DIN浓度均明显高于湾主区水域(表1),显示中国香港城市生产生活用水向海排放的影响. 湿季表层DIN浓度明显低于底层(表1),表明自养生产主要发生在水柱的上部,表层水体DIN被同化消耗. 此外,水柱中的密度层化限制了表、底水中DIN的交换,且夏季西南季风驱动南海北部沿岸陆架底层水侵入本湾,把高DIN底层水带入湾内[9].
-
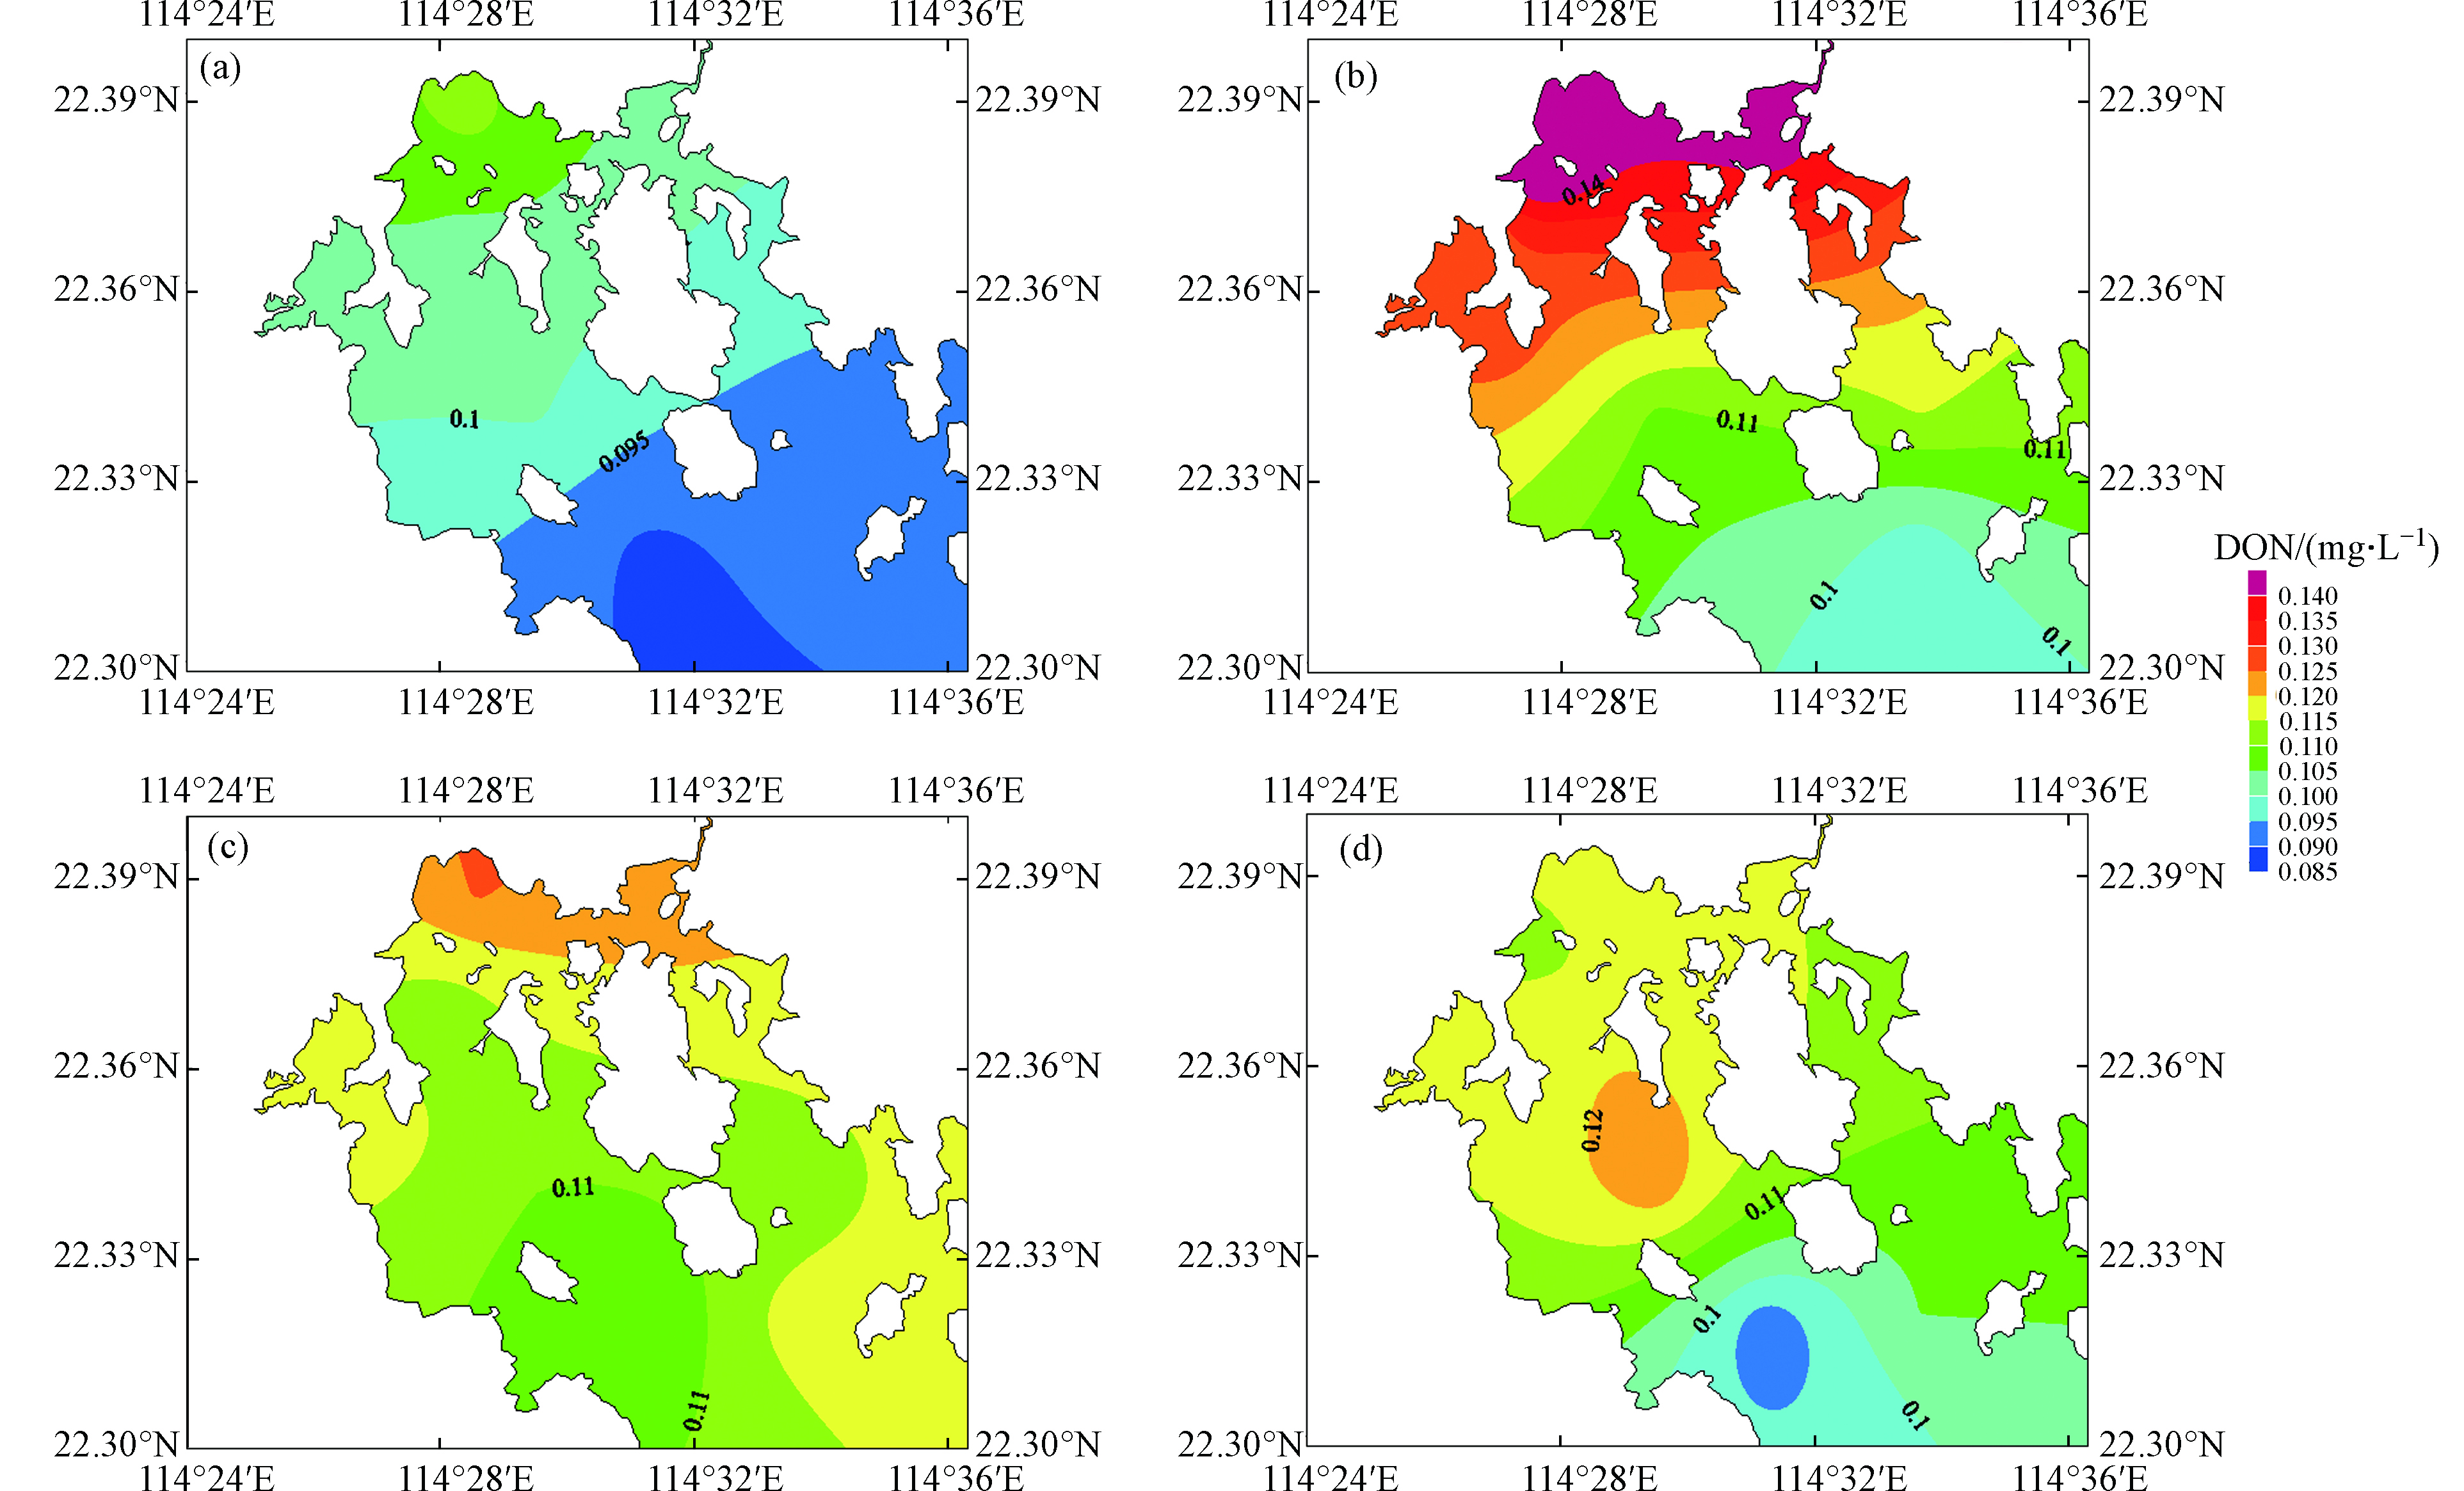
2000—2014年湾中DON平均浓度为(0.118±0.056)mg·L−1. 春、夏、秋、冬季DON的浓度范围分别为0.089—0.110、0.098—0.145、0.105—0.125、0.092—0.123 mg·L−1,平均分别为0.100、0.124、0.116、0.112 mg·L−1. 四季DON空间分布趋势相同,从湾顶向湾口逐步降低,整体上季节变化不大,在夏季较高,而春季较低(图2). 年际周期性变化方面,表、中、底层的DON浓度年内变化均不大,3—9月表层均值均高于底层(图3a),8月DON浓度最高,约为0.127 mg·L−1,3月最低,约为0.107 mg·L−1,表层DON浓度从4—8月不断增加,表明该期间DON在表层水中积累(图3a). DON浓度呈逐年上升趋势,从2000年初的0.086 mg·L−1上升至2014年底的0.151 mg·L−1(图3b).
四季湾顶DON浓度均明显高于湾的主区(图2),主要是由于:1)湾顶水域受陆源输入影响较大;2)湾顶水深较浅,且湾中部有岛屿分布,易于藻源性DON产生且不易扩散等因素影响. 同时,表层DON浓度高于底层,主要因为:1)自养生产主要发生在水柱的上部;2)夏季水柱中存在着强密度跃层,阻碍上下层水的垂直混合;3)陆源排放DON也对高表层DON浓度有所贡献. 另外,4—8月DON浓度不断增加,并达到一年中的最大值(图3a),表明该期间DON在湾中积累. 在最大值之后,DON浓度在9月有较大幅度的降低,之后保持在较低浓度水平(约0.116 mg·L−1)直至翌年3月,显示其他期间DON在湾中没有积累. DON浓度的季节变化和年变化不大,显示湾中的生态系统稳定,而且具有高自净化能力. DON浓度的年际变化呈上升趋势(图3b),说明近十几年湾中陆源DON输入呈逐年增加趋势,与深圳湾、珠江口和大鹏湾中研究结果相近[16-17],也与我国近岸海域近几十年来氮输入不断增加趋势一致[18].
-
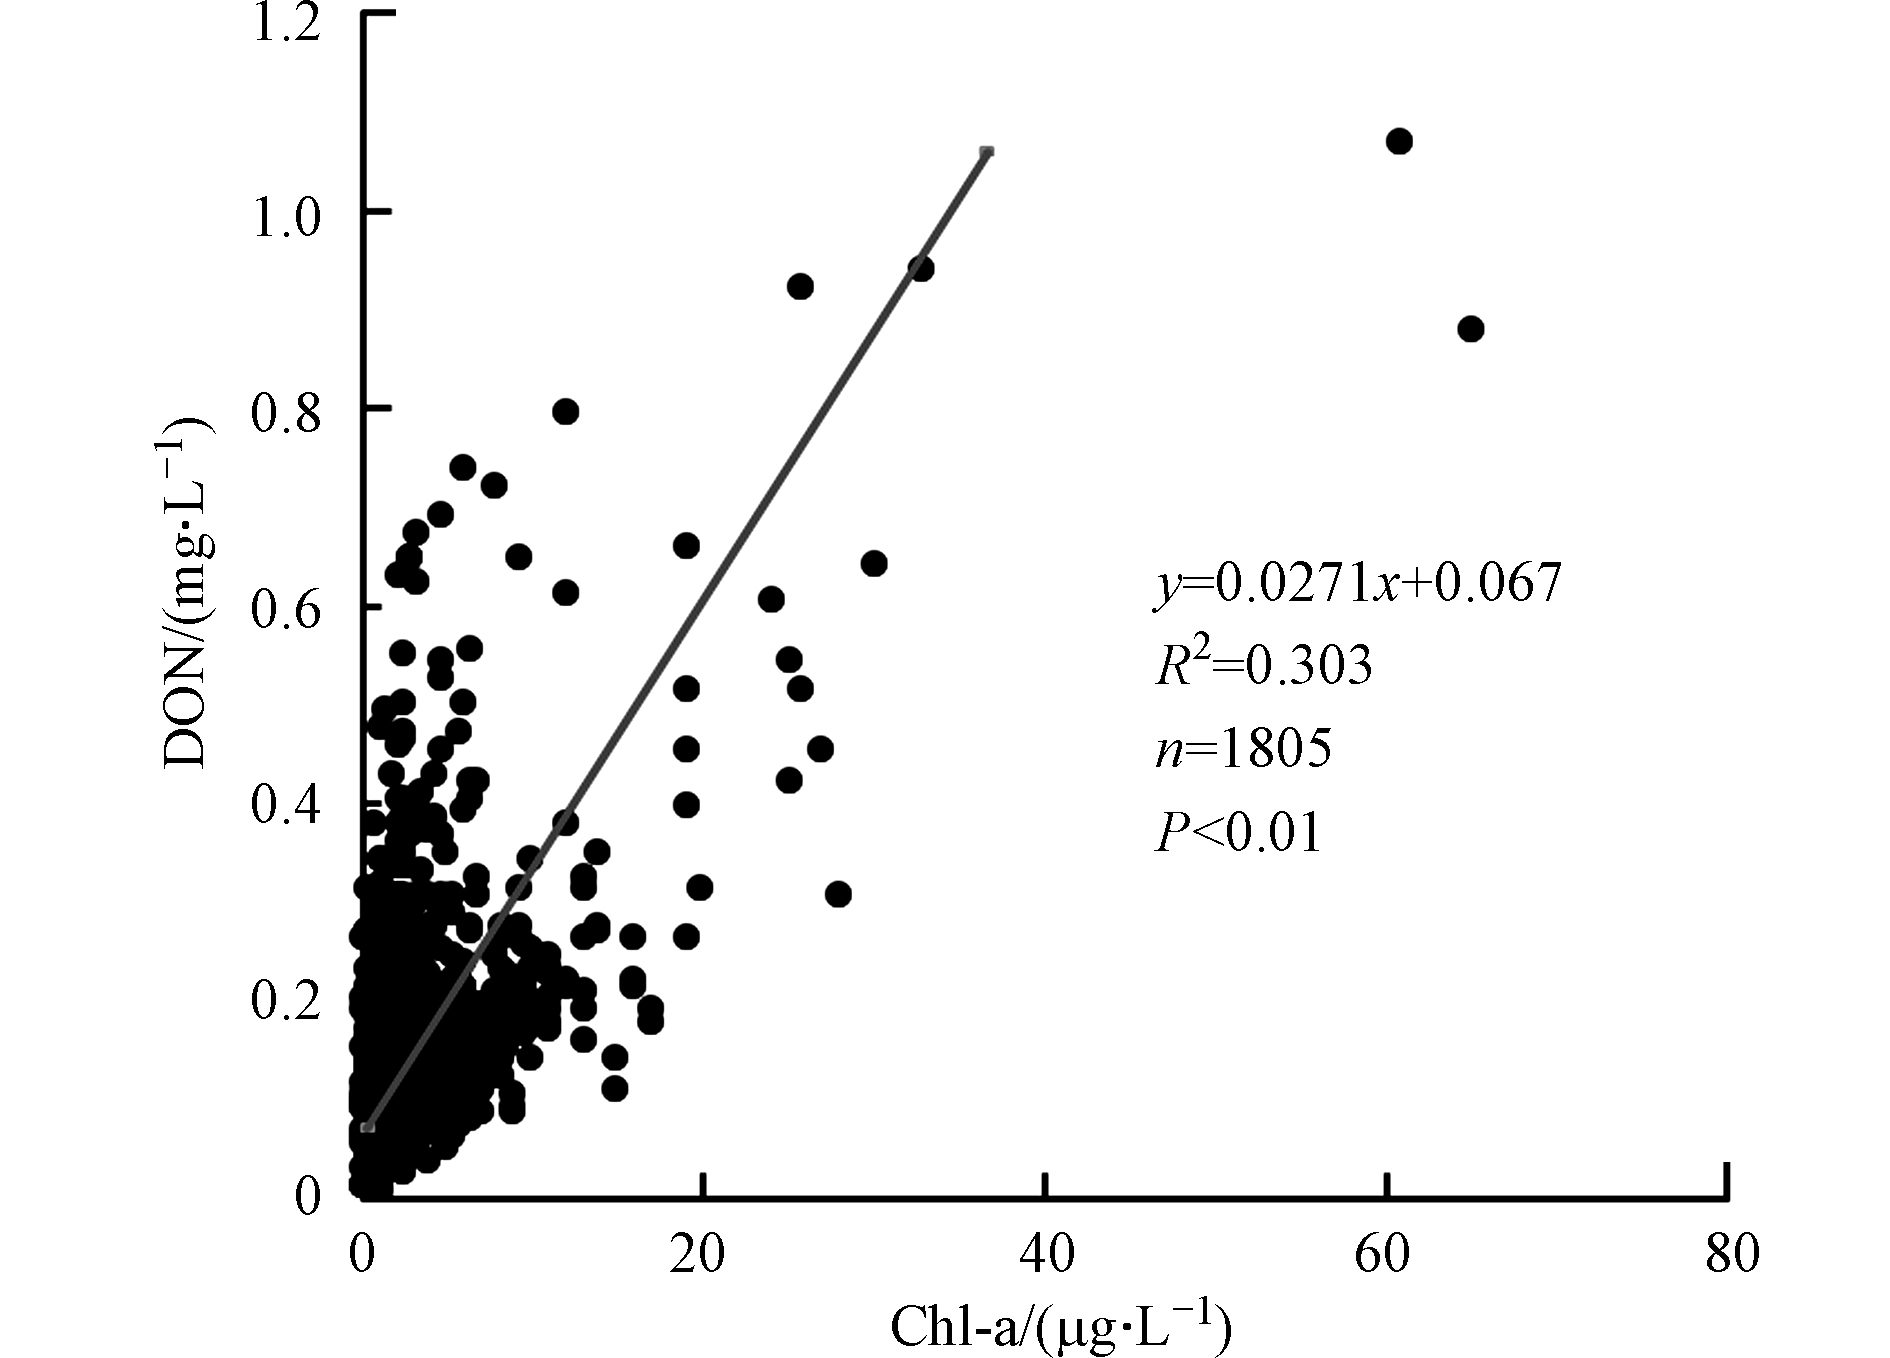
浮游植物的生长繁殖释放DON,而Chl-a浓度代表浮游植物现存量,也与初级生产率(PP)高度相关[19]. 2000—2014年牛尾海表层DON与Chl-a显著正相关,线性相关系数(R2)为0.30 (图4),说明DON与浮游植物现存量密切相关,且浮游植物的现场生产是湾中颗粒有机物(POM)的主要来源,这与大鹏湾中的结果相似[16]. 如图4所示,回归线斜率×1000约为27.1 g·g−1 (N /Chl-a),表示湾中自养生产过程的DON释放率与Chl-a浓度成正比. 回归线在x-轴上的截距为0.067 mg·L−1,代表较少被浮游生物利用的难降解DON,约为DON总量的47%,表明湾中只有53%的DON被浮游生物(包括细菌等)快速循环利用. 依据POM与Chl-a实测数据导出的湾中自养生产过程产生的颗粒有机碳(POC)释放率为53.1 g·g−1 (C /Chl-a),由此并依据Redfield比率[20]求出颗粒有机氮(PON)的释放率为9.35 g·g−1 (N /Chl-a). 比较DON和PON释放率可知,自养生产过程产生的DON释放率是PON释放率的2.90倍.
-
由上述研究结果可知,研究海区自养生产过程中DON释放率是PON释放率的2.90倍. 并依据[14]的方法,求出TDON结果见表2.
式中,IDON(gN·m−2)是水柱中的累积DON;PP(gC·(m2∙d)−1)是初级生产率;224和1272分别是浮游植物分子式中的总氮和总碳原子量[20]. 牛尾海TDON变化范围为3.6—9.1 d,平均为5.9 d,与水深成正比(表2),湾中DON被快速循环.
需要说明的是,TDON的估算结果是在假设生态系统稳定且自养生产是DON的唯一来源的前提下求得的,但陆源输入和大气沉降等也是海水DON的其他来源. 为了确定其他来源对TDON的贡献,结合牛尾海的平均PP、Redfield比率和水域面积,求得自养生产DON总量为4.00×10³ t ·a−1 N. 依据集水区面积、总雨量、总蒸发量和河溪平均DON,估算河流输出DON总量约为27.6 t N·a−1,占自养生产DON总量的0.69%,另因周边无污水直排牛尾海,污水输入DON的量为0 t N·a−1. 依据ON干湿沉降和湾的面积,计算获得大气沉降DON总量约为56.7 t ·a−1 N,占自养生产DON总量的1.42%. 尽管浅水域中沉积有机物(SOM)释放相当可观[21],但它们多以无机物形态通过沉积物-水界面释放至水溶液中[22]. SOM通过沉积物-水界面释放的DON很小,远小于自养生产DON总量的1%. 所以,TDON的估算结果具有96%以上的可信度.
-
为了确定DON的异养降解速率,根据ΔDON的计算方法,2000—2014年湾口外附近的SSW和ρ[DONSW]分别约为32.8 mg·L−1和0.105 mg·L−1,排入湾的ρ[DONFW]约为0.624 mg·L−1. 假定自养生产被异养降解完全平衡,那么SW和FW的两个S-DON数点的连线可被认为是FW和SW在湾内的理论混合线. 湾中DON随S的上升而降低(图5),DON被外海水稀释;湾顶水域S-DON数点位于混合线的上方呈正偏差,且各站位平均ΔDON为0.010 mg·L−1(表3),自养生产占主导地位;湾主区S-DON数点位于理论混合线的周围(图5),且各站位平均ΔDON接近于零(表3),自养生产的DON几乎被异养降解平衡. 总体上,牛尾海ΔDON的变化范围为-0.006—0.013 mg·L−1,平均ΔDON为0.006 mg·L−1,自养生产强于异养降解.
研究期间湾中DIN浓度为(0.060±0.050)mg·L−1,SW和FW中DIN浓度分别约为0.069和1.544 mg·L−1. 如果不考虑湾中自养生产和异养降解过程对DIN的影响,可得到SW与FW混合时的S与DIN浓度的理论混合线,所有S-DIN数点都在混合线的下方,呈负偏差(图5b). 用DIN代替ΔDON计算方程中的DON,可得到下式:
式中,ρ[DINFW]、ρ[DINSW]和ρ[DIN]分别是FW、SW和BW中的DIN浓度. 由等式(2)计算的湾中各监测站的平均ΔDIN列于表3;ΔDIN的变化范围为-0.051— -0.002 mg·L−1,平均为-0.027 mg·L−1,湾中DIN出现亏损,而且DIN亏损值比DON盈余值大得多,大部分亏损的DIN被转化为PON,并可能沉积至海床被埋藏或由水交换输送至外海.
2000—2014年湾中表层沉积物有机物(SOM)质量分数约为9.29 g·kg−1(湿重),利用文献报道的方法[23],求得湾中SOM水生源分数约为77.2%. 并由湾中水域面积、湾口沉积速率2.69—3.18 mm·a−1[24-25]、沉积物含水率和比重及Redfield比率,求得沉积物中水生源SON总量约为119 t ·a−1 N,被埋藏的SON大于陆源输入DON总量(27.6 t N·a−1)与大气沉降ON总量(56.7 t N·a−1)的总和,所以部分DIN亏损是其转化成PON并沉积至海床所致.
总之,牛尾海自养生产的PON的部分沉积至海底,另一部分PON同剩余DON被输出至外海,同时,水交换又把外海DIN带入湾中,湾中大部分DIN亏损是通过水交换从外海中获得补充. 湾内生物活动利用DIN和CO2进行光合作用及生长繁殖,将无机氮转化为有机氮,同时吸收CO2,是大气CO2的“汇”.
-
2000—2014年牛尾海湾顶水域DON浓度四季均较高,主要受陆源输入和海湾自身水深地形等因素影响;表层DON浓度高于底层,尤其是在夏季水柱存在强密度跃层,阻碍上下层水的垂直混合,且自养生产主要发生在水柱上部. 总体而言,牛尾海DON浓度的季节变化和年变化小,生态系统稳定并具有高自净化能力.
表层DON与Chl-a呈密切正相关关系,DON释放率约为27.1 g·g−1 (N /Chl-a),大约是PON释放率的2.90倍,TDON约为5.9 d,DON被快速循环利用. 湾主区水域ΔDON约为0.000 mg·L−1,而湾顶水域ΔDON约为0.010 mg·L−1,湾主区中自养生产和异养降解过程基本处于平衡状态,而湾顶水域中DON自养生产占优势. 总体而言,牛尾海自养生产强于异养降解,湾内生物活动利用DIN和CO2进行光合作用及生长繁殖,将无机氮转化为有机氮,同时吸收CO2,是大气CO2的“汇”.
致谢:感谢中国香港特别行政区环境保护署提供并允许使用相关数据.
珠江口牛尾海中DON的自养生产和异养降解
Autotrophic production and heterotrophic degradation of DON at the Niuweihai (Ngau Mei Hoi) area of the Pearl River Estuary
-
摘要: 本文研究了珠江口牛尾海海域2000—2014年期间溶解有机氮(DON)月际变化与空间分布;并基于二维混合质量平衡模式,结合叶绿素a(Chl-a)估算该海域的DON滞留时间(TDON),评估自养生产和异养降解作用所产生的余量DON(ΔDON).结果显示,牛尾海海域中DON浓度约(0.118±0.056) mg·L−1,浮游植物生产的DON释放率约为27.1 g·g−1 (N /Chl-a),其TDON约为6 d,证实牛尾海海域是一个DON循环速率相对较快海域.牛尾海主湾区水域ΔDON接近于零,说明其DON的自养生产与异养降解接近平衡;湾顶水域ΔDON约0.010 mg·L−1,说明其DON自养生产占主导地位.总体上,牛尾海海域DON自养生产明显强于异养降解作用.Abstract: In the paper the monthly variations and spatial distributions of dissolved organic nitrogen (DON) were analyzed at the Niuweihai (Ngau Mei Hoi) area of Pearl River Estuary during 2000—2014.Based on the two-component mixing mass-balance model, the residence time of the DON (TDON) was also estimated combining with the data of chlorophyll a (Chl-a), in order to assess the net DON (ΔDON) from autotrophic production and heterotrophic degradation at the Niuweihai area, our results showed the DON concentration was (0.118±0.056) mg·L−1, and the DON release rate from the phytoplankton production was ~27.1 g·g−1 (N /Chl-a).The residence time (TDON) was about 6 days, suggesting that the DON cycle rate was fast at the Niuweihai area.The ΔDON concentration was close to zero, indicating the DON in main body waters was close to equilibrium between the autotrophic production and heterotrophic degradation.The ΔDON concentration was ~0.010 mg·L−1, indicating the autotrophic production of DON was stronger than the heterotrophic degradation at the bay’s top waters.In general, the autotrophic production of DON at the Niuweihai sea area was significantly stronger than heterotrophic degradation.
-
Key words:
- DON /
- autotrophic production /
- heterotrophic degradation /
- the Pearl River Estuary /
- the Niuweihai area
-

-
表 1 2000—2014年牛尾海中干季和湿季各监测站表层和底层平均T、S、pH、DO、Chl-a和DIN浓度a
Table 1. T,S,pH,DO,Chl-a and DIN concentrations averaged for surface- and bottom-waters at various sites for the dry and wet seasonsa at the Niuweihai area between 2000 and 2014
季节
Period站号
SiteT/°C S pH DO/(mg·L−1) Chl-a/(μg·L−1) DIN/(mg·L−1) 表层 底层 表层 底层 表层 底层 表层 底层 表层 底层 表层 底层 干季 PM1 20.9 20.6 32.6 32.6 8.1 8.1 6.9 7.4 3.3 3.0 0.053 0.054 PM2 20.9 20.7 32.5 32.6 8.1 8.1 6.9 7.2 3.0 2.9 0.059 0.062 PM3 20.9 20.5 32.6 32.7 8.1 8.1 7.1 7.1 2.9 2.5 0.055 0.067 PM4 20.7 20.5 32.6 32.6 8.1 8.1 6.8 7.3 2.8 3.0 0.050 0.052 PM6 20.9 20.6 32.4 32.6 8.1 8.1 7.0 7.1 3.1 2.4 0.064 0.070 PM7 20.8 20.5 32.6 32.8 8.1 8.1 7.1 7.1 2.2 2.1 0.061 0.075 干季 PM8 20.7 20.5 32.6 32.8 8.1 8.1 7.1 7.1 2.1 1.6 0.070 0.082 PM9 20.6 20.3 32.6 32.7 8.1 8.1 7.0 7.2 2.1 2.2 0.068 0.078 PM11 20.6 20.5 32.6 32.8 8.1 8.1 7.0 7.1 1.9 1.6 0.075 0.085 平均值 20.8 20.5 32.6 32.7 8.1 8.1 7.0 7.2 2.6 2.4 0.062 0.069 湿季 PM1 27.5 25.7 30.7 32.4 8.2 8.1 6.5 5.9 3.1 3.5 0.053 0.053 PM2 27.4 25.9 30.7 32.2 8.2 8.1 6.1 5.9 3.5 2.9 0.059 0.063 PM3 27.4 24.6 30.9 33.1 8.2 8.1 6.4 5.2 2.9 2.5 0.055 0.068 PM4 27.3 25.7 30.7 32.5 8.2 8.1 6.2 5.9 2.6 3.4 0.050 0.053 PM6 27.1 24.8 30.8 32.9 8.1 8.1 6.4 5.1 3.9 2.9 0.064 0.079 PM7 27.0 24.0 31.2 33.5 8.2 8.0 6.6 4.9 2.0 1.7 0.061 0.080 PM8 26.8 23.6 31.4 33.7 8.2 8.0 6.6 4.9 1.9 1.3 0.070 0.080 PM9 26.8 24.1 31.6 33.5 8.2 8.1 6.3 5.2 1.9 1.9 0.068 0.069 PM11 26.7 23.7 31.6 33.7 8.2 8.1 6.5 5.0 1.8 1.5 0.075 0.077 平均值 27.1 24.7 31.1 33.1 8.2 8.1 6.4 5.3 2.6 2.4 0.047 0.069 a干季指10月—翌年3月,湿季指4—9月. The dry season is Oct–Mar and the wet season is Apr–Sep. 表 2 2000—2014年牛尾海中DON的平均滞留时间
Table 2. Average residence times for DON at the Niuweihai area between 2000 and 2014
站号
Site水深/m
Water depthIDON/(g·m−2N) PP/(g·(m2∙d)−1C) TDON/d PM1 6 0.772 0.415 3.6 PM2 8 1.020 0.493 4.1 PM3 13 1.629 0.535 6.0 PM4 6 0.749 0.386 3.8 PM6 11 1.338 0.553 4.7 PM7 17 1.924 0.526 7.2 PM8 20 2.001 0.492 8.0 PM9 15 1.600 0.487 6.4 PM11 21 2.220 0.477 9.1 表 3 2000—2014年牛尾海中各测站的平均ΔDON和ΔDIN
Table 3. Average ΔDON and ΔDIN at various sites at the Niuweihai area between 2000 and 2014
站号
Site水深/m
Water depthΔDON/(mg·L−1) ΔDIN/(mg·L−1) PM1 6 0.013 −0.051 PM2 8 0.009 −0.043 PM3 13 0.013 −0.031 PM4 6 0.009 −0.050 PM6 11 0.008 −0.031 PM7 17 0.005 −0.016 PM8 20 −0.006 −0.006 PM9 15 −0.000 −0.013 PM11 21 0.000 −0.002 -
[1] COTNER J B, BIDDANDA B A. Small players, large role: Microbial influence on biogeochemical processes in pelagic aquatic ecosystems [J]. Ecosystems, 2002, 5(2): 105-121. doi: 10.1007/s10021-001-0059-3 [2] WARD B B, BRONK D A. Net nitrogen uptake and DON release in surface waters: Importance of trophic interactions implied from size fractionation experiments [J]. Marine Ecology Progress Series, 2001, 219: 11-24. doi: 10.3354/meps219011 [3] 林梵, 李绪录, 许春玲, 等. 2000—2015年大鹏湾中5日生化需氧量的时空分布 [J]. 生态环境学报, 2017, 26(5): 883-889. LIN F, LI X L, XU C L, et al. Temporal and spatial distributions of 5-day biochemical oxygen demand in the mirs bay [J]. Ecology and Environmental Sciences, 2017, 26(5): 883-889(in Chinese).
[4] BERMAN T, BRONK DA. Dissolved organic nitrogen: A dynamic participant in aquatic ecosystems [J]. Aquatic Microbial Ecology, 2003, 31: 279-305. [5] CORNELL S, RANDELL A, JICKELLS T. Atmospheric inputs of dissolved organic nitrogen to the oceans [J]. Nature, 1995, 376(6537): 243-246. doi: 10.1038/376243a0 [6] LOMSTEIN JEN B, JENSEN A, HANSEN J W, et al. Budgets of sediment nitrogen and carbon cycling in the shallow water of Knebel Vig, Denmark [J]. Aquatic Microbial Ecology, 1998, 14: 69-80. doi: 10.3354/ame014069 [7] KROEGER K D, COLE M L, VALIELA I. Groundwater-transported dissolved organic nitrogen exports from coastal watersheds [J]. Limnology and Oceanography, 2006, 51(5): 2248-2261. doi: 10.4319/lo.2006.51.5.2248 [8] LEE E S, KROTHE N C. A four-component mixing model for water in a Karst terrain in south-central Indiana, USA. Using solute concentration and stable isotopes as tracers [J]. Chemical Geology, 2001, 179(1/2/3/4): 129-143. [9] LI X L, SHI H M, XIA H Y, et al. Seasonal hypoxia and its potential forming mechanisms in the Mirs Bay, the northern South China Sea [J]. Continental Shelf Research, 2014, 80: 1-7. doi: 10.1016/j.csr.2014.03.003 [10] 黄小平, 黄良民. 大鹏湾水动力特征及其生态环境效应 [J]. 热带海洋学报, 2003, 22(5): 47-54. doi: 10.3969/j.issn.1009-5470.2003.05.007 HUANG X P, HUANG L M. Hydrodynamic characteristics of Dapeng Bay and its ecological and environmental effects [J]. Journal of Tropical Oceanography, 2003, 22(5): 47-54(in Chinese). doi: 10.3969/j.issn.1009-5470.2003.05.007
[11] WANG X M, WU Z Y, SHAO M, et al. Atmospheric nitrogen deposition to forest and estuary environments in the Pearl River Delta region, Southern China [J]. Tellus B: Chemical and Physical Meteorology, 2013, 65(1): 20480. doi: 10.3402/tellusb.v65i0.20480 [12] APHA. 5210B, Standard methods for the examination of water and wastewater(20th Edition) [S]. New York: American Public Health Association(APHA), 1998 [13] 李绪录, 周毅频, 夏华永. 2000—2010年大鹏湾颗粒有机物的年变化和年际变化 [J]. 环境科学, 2013, 34(3): 857-863. LI X L, ZHOU Y P, XIA H Y. Intra-and inter-annual variabilities of particulate organic matter in the Mirs Bay from 2000 to 2010 [J]. Environmental Science, 2013, 34(3): 857-863(in Chinese).
[14] SHI H M, MA Y, LI X L, et al. Distribution, residence time, autotrophic production, and heterotrophic removal of DOP in the Mirs Bay, northern South China Sea [J]. Acta Oceanologica Sinica, 2019, 38(8): 17-26. [15] EPD (Environmental Protection Department, the Government of the Hong Kong Special Administrative Region). Marine water quality in Hong Kong in 2015.2016,http://wqrc.epd.gov.hk/pdf/water-quality/annual-report/MarineReport2015eng.pdf [16] 李绪录, 张军晓, 周毅频, 等. 2000—2010年大鹏湾溶解有机氮的时空分布 [J]. 中国环境科学, 2013, 33(10): 1799-1807. LI X L, ZHANG J X, ZHOU Y P, et al. Temporal and spatial distributions of dissolved organic nitrogen in the Mirs Bay from 2000 to 2010 [J]. China Environmental Science, 2013, 33(10): 1799-1807(in Chinese).
[17] 李绪录, 许春玲, 林梵, 等. 深圳湾及邻近水域中的溶解有机氮: 其时空分布、来源和生物利用率 [J]. 中国环境科学, 2016, 36(9): 2757-2764. doi: 10.3969/j.issn.1000-6923.2016.09.034 LI X L, XU C L, LIN F, et al. Dissolved organic nitrogen in the Shenzhen Bay and adjacent coastal waters: Its temporal and spatial distributions, sources and bioavailability [J]. China Environmental Science, 2016, 36(9): 2757-2764(in Chinese). doi: 10.3969/j.issn.1000-6923.2016.09.034
[18] 金杰, 刘素美. 海洋浮游植物对磷的响应研究进展 [J]. 地球科学进展, 2013, 28(2): 253-261. doi: 10.11867/j.issn.1001-8166.2013.02.0253 JIN J, LIU S M. Advances in studies of phosphorus utilization by marine phytoplankton [J]. Advances in Earth Science, 2013, 28(2): 253-261(in Chinese). doi: 10.11867/j.issn.1001-8166.2013.02.0253
[19] HU S H, SMITH W O Jr. The effects of irradiance on nitrate uptake and dissolved organic nitrogen release by phytoplankton in the Ross Sea [J]. Continental Shelf Research, 1998, 18(9): 971-990. doi: 10.1016/S0278-4343(98)00021-1 [20] REDFIELD A C, KETCHUM B H, RICHARDS F A. The influence of organisms on the composition of sea-water[M]. In: Hill, M. N. (ed. ). The Sea: The Composition of Sea-Water, Vol. 2. Harvard University Press, London, 1963. [21] 潘建明, 周怀阳, 扈传昱, 等. 夏季珠江口沉积物中营养盐剖面分布和界面交换通量 [J]. 海洋学报(中文版), 2002, 24(3): 52-59. PAN J M, ZHOU H Y, HU C Y, et al. Nutrient profiles in interstitial water and flux in water-sediment in terface of Zhujiang Estuary of China in summer [J]. Acta Oceanologica Sinica, 2002, 24(3): 52-59(in Chinese).
[22] 何桐, 谢健, 余汉生, 等. 春季大亚湾海域沉积物-海水界面营养盐的交换速率 [J]. 海洋环境科学, 2010, 29(2): 179-183. doi: 10.3969/j.issn.1007-6336.2010.02.004 HE T, XIE J, YU H S, et al. Exchange rates of nutrients at sediment-seawater interface in Daya Bay in spring [J]. Marine Environmental Science, 2010, 29(2): 179-183(in Chinese). doi: 10.3969/j.issn.1007-6336.2010.02.004
[23] 许春玲, 李绪录, 林梵. 深圳湾及邻近沿岸沉积物中碳、氮和磷的分布 [J]. 中国环境科学, 2017, 37(7): 2691-2698. doi: 10.3969/j.issn.1000-6923.2017.07.034 XU C L, LI X L, LIN F. Distributions of carbon, nitrogen and phosphorus in the surface sediments of the Shenzhen Bay and adjacent coastal area [J]. China Environmental Science, 2017, 37(7): 2691-2698(in Chinese). doi: 10.3969/j.issn.1000-6923.2017.07.034
[24] 关祖杰, 杨健明, 余君岳, 等. 用γ谱方法测定大鹏湾的沉积速率 [J]. 中山大学学报(自然科学版), 1995, 34(2): 32-37. GUAN Z J, YANG J M, YU J Y, et al. Determination of sedimentation rates in the mirs bay sea areas with gamma spectrometry [J]. Acta Scientiarum Naturalium Universitatis Sunyatseni, 1995, 34(2): 32-37(in Chinese).
[25] 黄向青, 梁开, 刘雄. 深圳大鹏湾表层沉积物碎屑矿物空间分布特征 [J]. 海洋湖沼通报, 2007(1): 74-82. doi: 10.3969/j.issn.1003-6482.2007.01.011 HUANG X Q, LIANG K, LIU X. Spatial distribution characteristics of surface sediment debris minerals in Shenzhen Dapeng Bay, Guangdong [J]. Transactions of Oceanology and Limnology, 2007(1): 74-82(in Chinese). doi: 10.3969/j.issn.1003-6482.2007.01.011
-


 下载:
下载:


