-
《中国生态环境状况公报》2020年发布的数据显示,我国的城市大气污染状况相较于2019年有所好转,细颗粒物(PM2.5)、可吸入颗粒物(PM10)、二氧化硫(SO2)、二氧化氮(NO2)、一氧化碳(CO)、臭氧(O3)六项指标浓度超标比例呈现下降趋势,但空气质量状况仍十分严峻。目前细颗粒物(PM2.5)和臭氧(O3)仍是影响我国空气质量最主要的两大污染物。国内学者对京津冀、长江三角洲和珠江三角洲地区的PM2.5和O3展开了大量研究,结果表明,PM2.5的浓度主要由气象条件和污染源排放共同决定[1-2],而O3的浓度主要由前体物VOCs、NOx浓度及气象条件决定[3],不同地区的PM2.5和O3浓度分布具有不同的时空分布特征[4-5]。李名升等分析了中国大陆城市的PM2.5污染的时空分布规律[6],发现冬季污染较重,PM2.5的日变化呈现不太明显的双峰分布。周明卫等研究分析了中国城市O3的时空变化规律[7],发现O3浓度空间分布呈现北高南低的规律,O3浓度的高值主要出现在夏季。张亮等利用WRF-Chem空气质量模式对长江三角洲的一次O3高污染事件进行了模拟[8],研究发现长江三角洲地区O3的时空分布主要受气象场、地理位置、区域输送和化学生成所影响。余钟奇等使用WRF-Chem和WRF-FLEXPART模式定量研究了长江三角洲PM2.5来源贡献[9],发现长江三角洲内部排放及污染相互传输的影响比外部的跨区域输送贡献更大。近年来,利用后向轨迹分析模型来判断污染物的传输路径,并通过聚类分析对传输路径进行分类分析,再结合PSCF方法等来判断确定污染物的潜在来源,已经成为了研究某个区域大气污染输送特征及潜在源区的常用方法[10-11]。国内外学者利用此方法展开了许多研究,如高晋徽等利用后向轨迹模式分析了O3、NO2和SO2的区域传输对南京北郊地区污染的影响[12]。
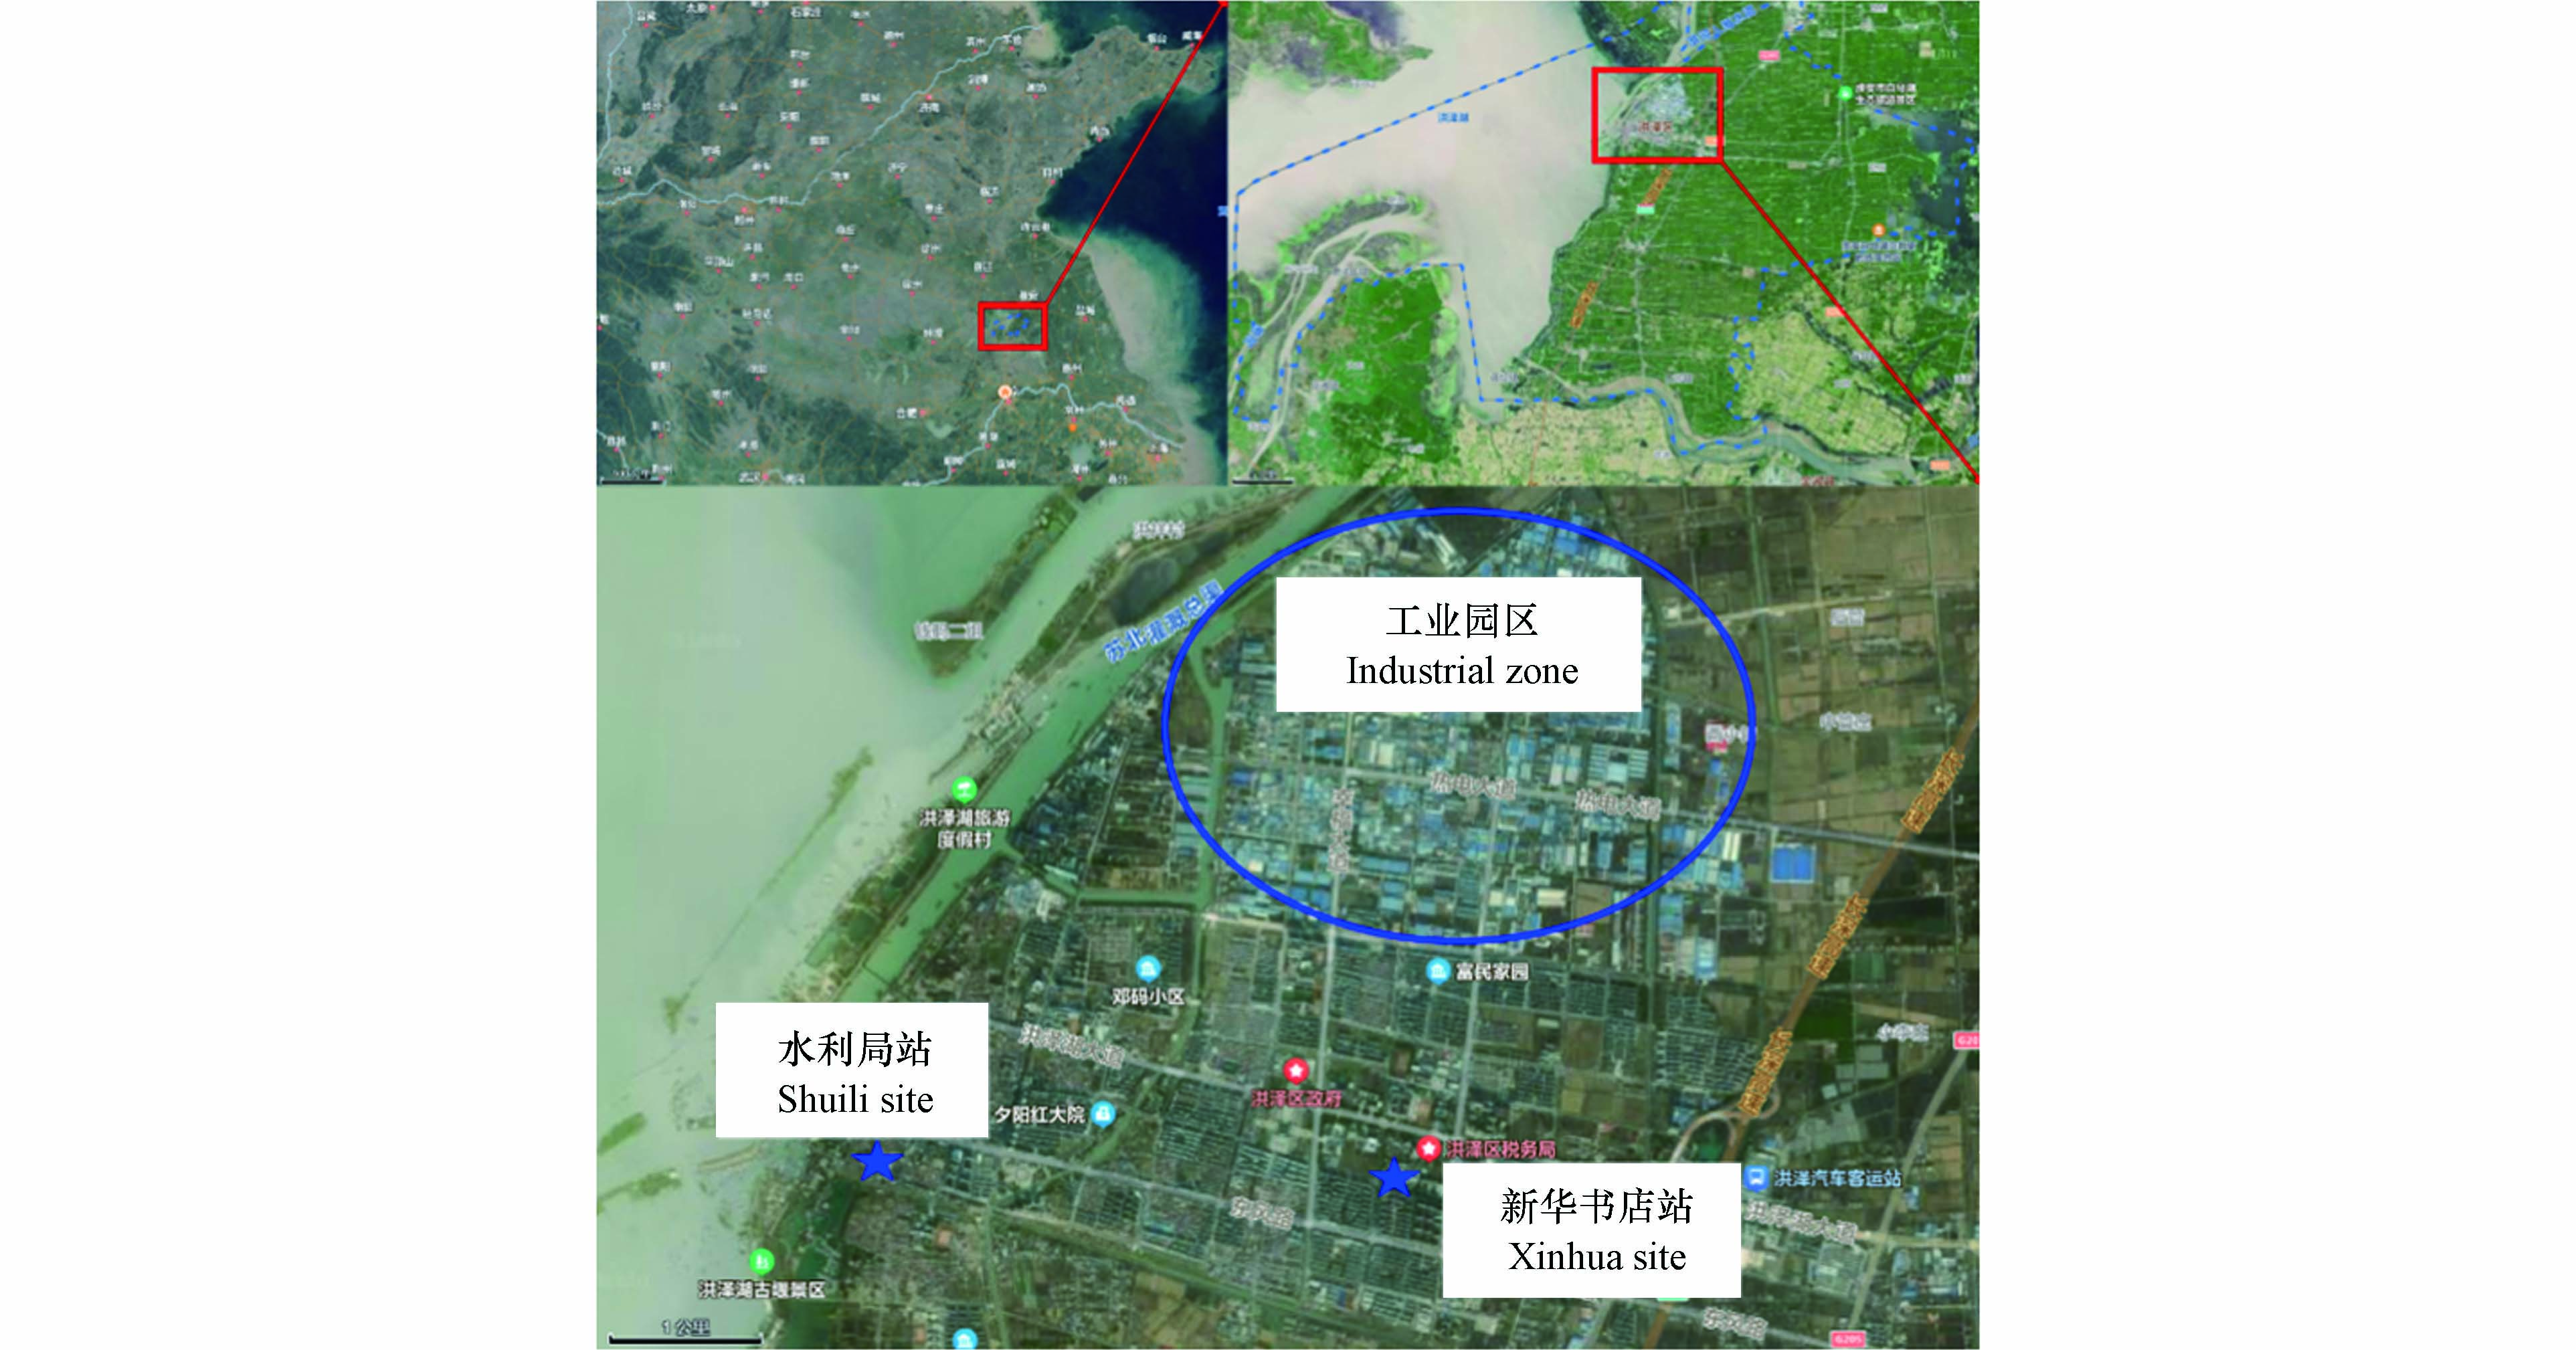
洪泽湖,是中国第四大淡水湖,位于江苏省西部淮河下游,苏北平原中部西侧,淮安、宿迁两市境内。在正常水位12.5 m时,水面面积为1597 km2,平均水深1.9 m,最大水深4.5 m,湖底浅平,高出洪泽湖大堤以东地区3—5 m,由此称之为“悬湖”。辽阔的湖面形成的局地气候,如湖陆风环流等,将会显著影响周边城市的空气质量。淮安市洪泽区(东经118°28'-119°9'、北纬33°02'-34°24'间)位于洪泽湖东侧(如图1所示),主要工业格局为盐化新材料、机械制造、现代纺织以及电子信息等,年产值在2000万以上的规上企业约185家,其中盐化新材料约55户,为区内第一大产业,产品主要以元明粉、工业盐、纯碱、硝酸、合成氨、三氯氰胺、医药中间体等,其产值约占区内总产值的40%。独特的地理环境以及较大的盐化工业比重将会对本地的空气污染产生何种效应值得探究。
本研究基于2019年12月至2020年11月我国生态环境部空气质量自动监测站的PM2.5、O3数据、2020年多次洪泽区可挥发性有机物(VOCs)监测以及2020年12月洪泽区在线源解析数据,结合Hysplit后向轨迹聚类和PSCF的方法,洪泽湖东侧的洪泽区大气污染的时空变化特征以及PM2.5的潜势来源区以及行业来源。此外,还对比了洪泽区不同离湖区距离下空气质量的特征。该结果对洪泽湖东侧凹地的空气污染防治具有重要的指导意义,也将使我们更加深入地认识湖陆交接区以及湖畔凹地空气质量特征。
-
PM2.5和O3的浓度数据来自于我国生态环境部空气质量自动监测站的小时监测数据,时间区间为2019年12月1日至2021年11月30日。其中,江苏省13个城市空气质量自动监测数据的平均值作为江苏省的整体状况,淮安市5个城市空气质量自动监测数据的平均值代表淮安市的PM2.5及O3水平。淮安市洪泽区内有两个监测站点,一个为洪泽水利局站,位于洪泽湖畔,距离湖区东侧约10 m,属于省控点;另一个为新华书店站,位于洪泽城区中心,2020年1月设为国控点。为保证数据的可信度,本研究选取的起始时段为新华书店站设为国控点前1个月,即2019年12月。
GDAS数据来自NCEP(美国国家环境预报中心)(https://ready.arl.noaa.gov/archives.php)的全球资料同化系统2019—2020年数据,时间分辨率为一天4次,即世界标准时间00、06、12和18,空间分辨率为1°×1°,垂直方向分为23层,气象要素变量包括温度、气压、相对湿度、地面降水、纬向风速、经向风速等。GDAS数据主要用于驱动Hysplit模型进行轨迹计算。
人为排放源数据来自MEIC(中国多尺度排放清单模型),由清华大学自2010年起开发并维护,该模型覆盖了中国大陆地区700多种人为排放源,包括10种主要大气污染物和二氧化碳。本研究采用2018年开发完成的v1.3版本,2017年PM2.5的人为排放源数据[13-14]。MEIC排放清单结合轨迹计算结果用于潜在源区的确定。
2020年7月、9月以及11月共开展9次的高时空分辨率VOCs移动监测,监测设备为SPIMS 2000,其目的为获取洪泽区VOCs空间分布特征以及主要组分;2020年12月17日至2020年12月24日,在新华书店站附近采用在线单颗粒气溶胶质谱仪(SPAMS 05系列)进行高精度连续观测,并进行在线源解析,时间精度为小时分辨率。
-
后向轨迹模式以某一位置为基点,通过气象参数等计算示踪粒子的空间位移,从而得出气团到达该位置的轨迹,同时计算气团沿途经过的污染源,直到选定位置[15]。本文基于HYSPLIT(Hybrid Single-particle Lagrangian Integrated Trajectory model)混合单粒子拉格朗日综合轨迹模式,该模式由美国国家海洋和大气管理局NOAA(National Oceanicand Atmospheric Administration)和空气资源实验室ARL(Air Resources Laborotory)开发[16],该模式可以模拟气团扩散轨迹,分析污染物来源和传输路径等。本研究中模拟时段选取2020年1月、4月、7月和10 月4个月份作为4个季节的代表月份,分析这4个月份的24小时后向轨迹,轨迹模拟起始高度为500 m。后向轨迹聚类分析法,又名簇分析法[17],根据气团的移动速度和方向对大量轨迹进行分组,得到不同的轨迹输送组。本文使用嵌套有TrajStat的Meteoinfo软件对前述的后向轨迹利用Euclidean Distance算法进行聚类分析。
-
潜在污染源贡献函数PSCF(Potential Source Contribution Function)是基于条件概率函数发展而来的一种判断污染潜在源区的方法[18-19],本文将指定区域划分成0.1°×0.1°的网格,在不考虑污染源的情况下,将《环境空气质量标准》(GB3095—2012)PM2.5的24 h平均一级标准限值35 μg·m−3作为条件阈值[20],PSCF值为受体点超过规定阈值时落在该网格点内的轨迹数(mij)与落在该网格点内的轨迹总数(nij)的比值,即
某网格点的PSCF值越大,表明受体点的浓度超过规定浓度比例越多,故该网格点对受体点的污染潜在贡献较高[21]。PSCF是一种条件概率,PSCF的误差会随着网格与采样点的距离增加而增加,当nij较小时,会有很大的不确定性,因此引入权重函数W(nij)来减少不确定性[22],计算WPSCF。
-
江苏省、淮安市及洪泽地区3个不同区域范围内PM2.5质量浓度及O3日最大8 h滑动平均(MDA8-O3)浓度逐月变化,如图2所示。
由图2(a)可以看出,洪泽地区PM2.5浓度呈现很明显的单峰分布,冬季的PM2.5的浓度较高,在夏季PM2.5浓度较低,峰值出现在1月份,达74 μg·m−3,谷值出现在7月份,约19 μg·m−3,该变化特征主要与冬季静稳天以及夏季有利的扩散条件、强降水有关。洪泽地区PM2.5浓度与江苏省和淮安市区域平均PM2.5浓度月变化趋势类似,但比江苏省和淮安市区域平均值低,这说明在江苏省整个区域以及淮安市范围内,洪泽区的细颗粒物污染相对较轻。由图2(b)可以看出,O3的变化趋势与PM2.5趋势不同,呈双峰分布,分别于5月和9月出现峰值,其中5月最高,达150 μg·m−3,冬季O3浓度最低,约65 μg·m−3,其中冬季低值主要与弱的光化学过程有关,夏季谷值可能与降水等对O3前体物的清除等作用有关。洪泽地区与江苏省及淮安市的O3浓度月变化趋势大致相同,均呈现双峰型分布,但相比于江苏省和淮安市区域平均O3浓度偏高,O3污染相对较重。
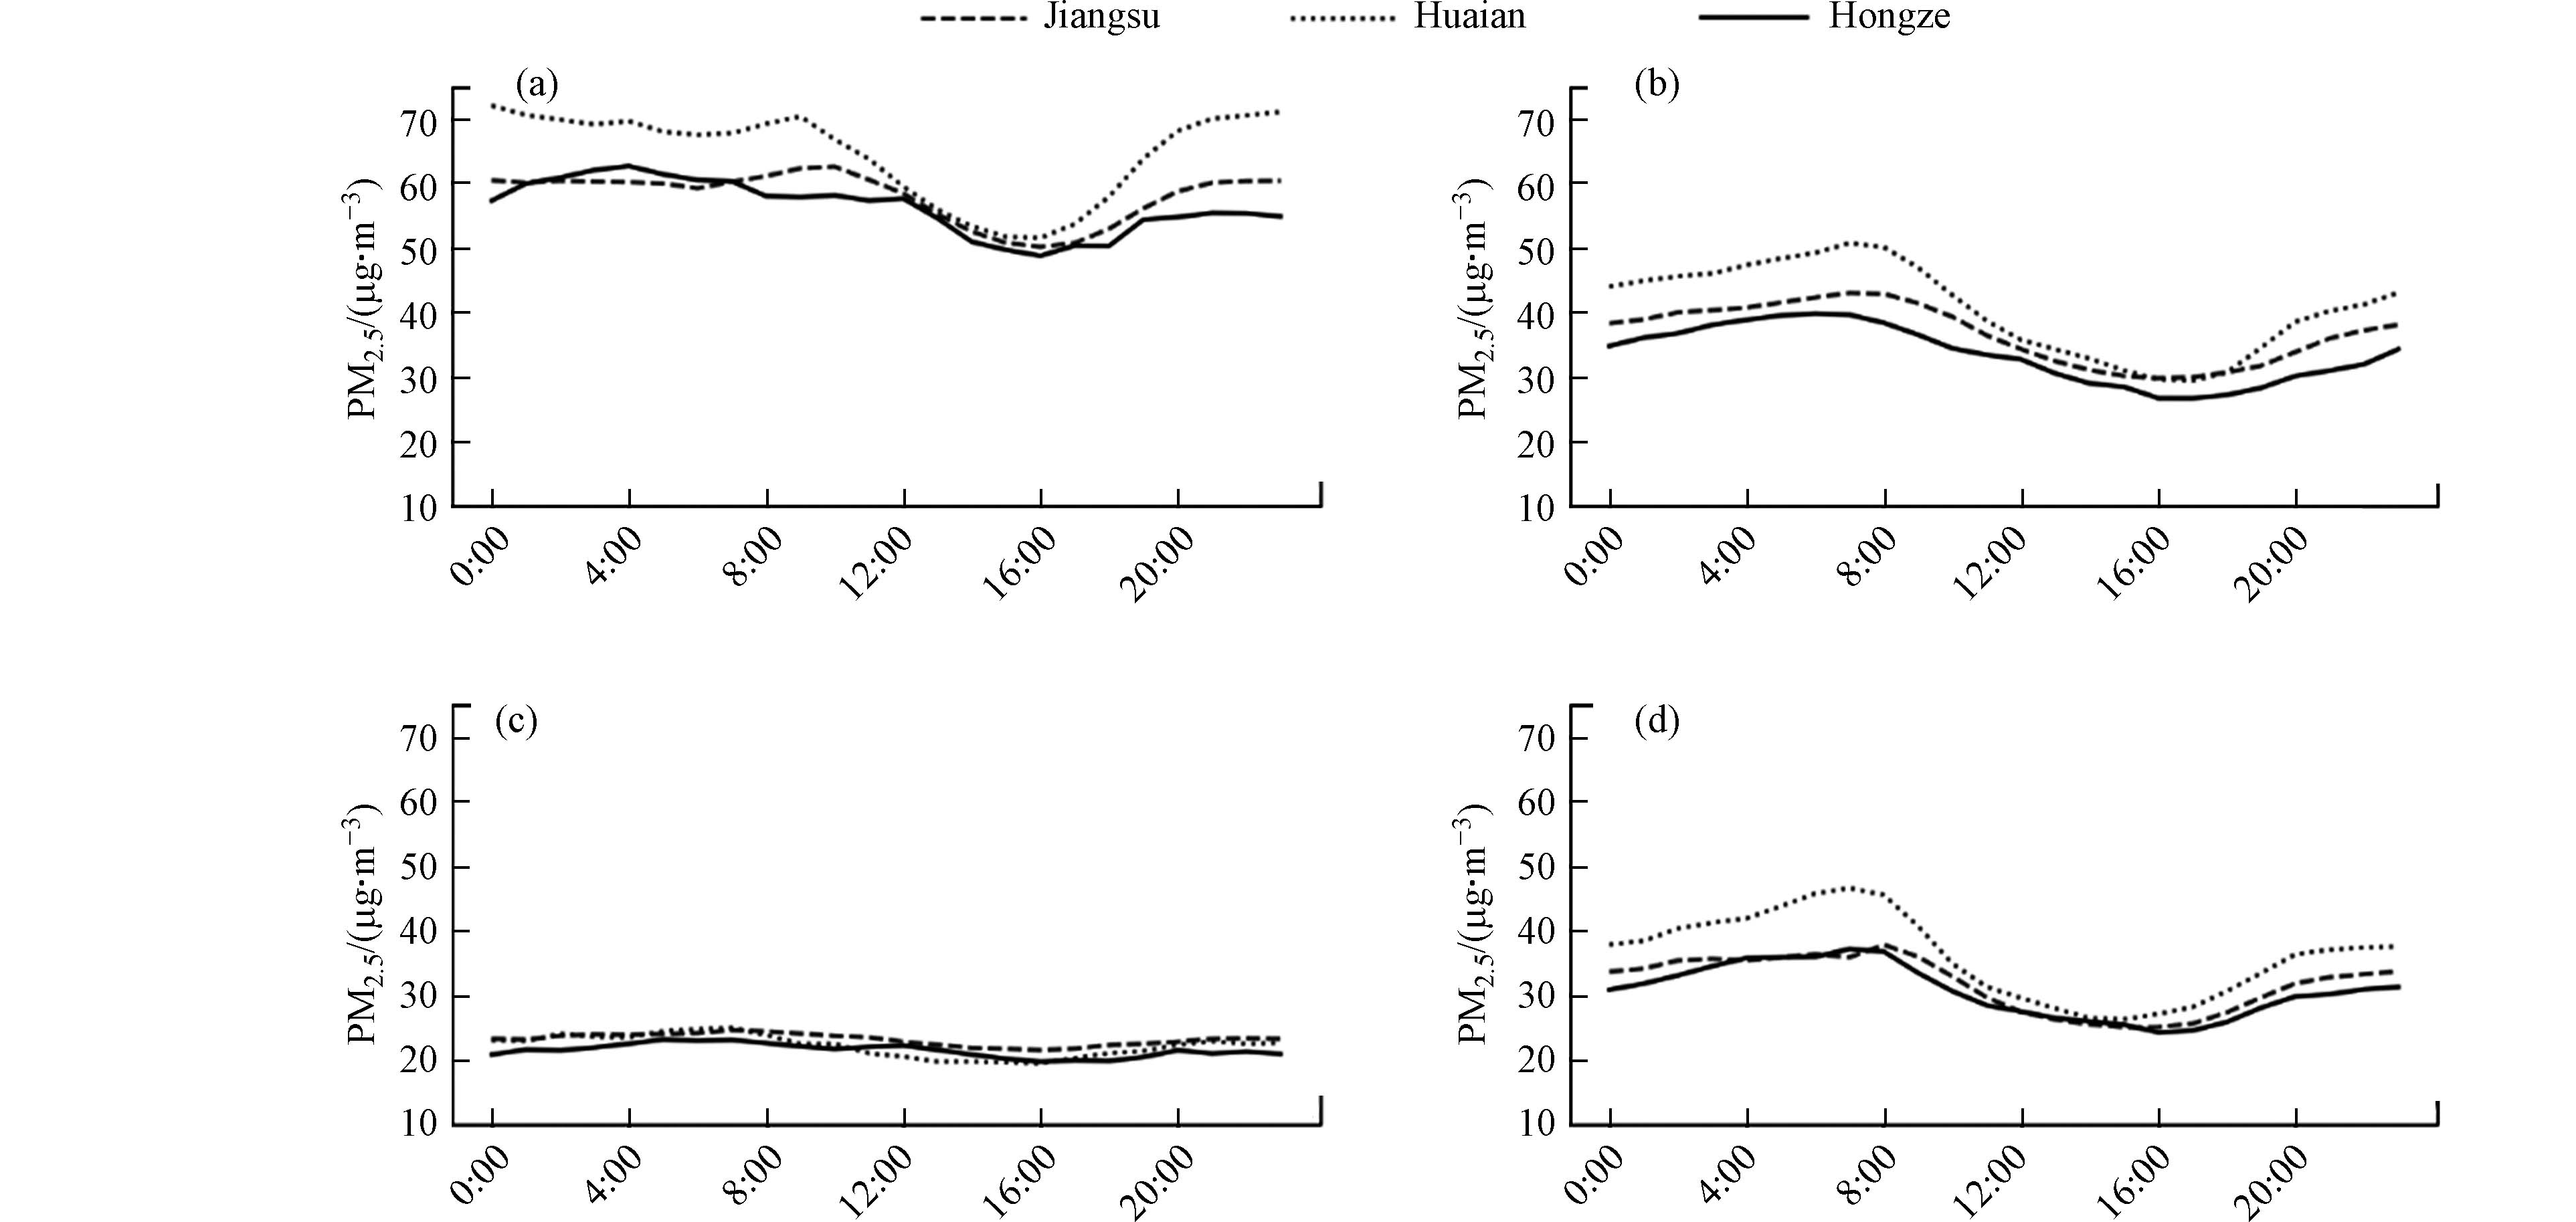
图3为四季江苏省、淮安市及洪泽区域平均的PM2.5浓度日变化。早上8时开始,由于太阳辐射增强,大气湍流开始发展,边界层高度升高,大气扩散强度增加,使得PM2.5浓度开始下降,在15时达到谷值,随后PM2.5浓度逐渐升高在次日早上达到峰值。四季中,冬季早晨PM2.5峰值出现时间晚于其余季节,约在9时,PM2.5约70 μg·m−3,随后降低至下午16时的50 μg·m−3;春秋季PM2.5低谷范围较冬季宽;夏季PM2.5日变特征不明显且浓度值较低,维持在20—30 μg·m−3。洪泽地区PM2.5浓度相比于江苏省和淮安市区域平均值偏低,四季洪泽地区PM2.5浓度日变化相比于江苏省及淮安市平均变化特征更加平缓。
图4为4个季节江苏省、淮安市及洪泽地区各区域平均的O3浓度日变化。从图4中可以看出,与PM2.5浓度日变化特征不同,O3浓度的日变化呈显著的单峰型分布,约在15时出现峰值,春夏秋三季洪泽地区日O3浓度最低值出现在早上的7时,而冬季O3浓度最低值出现在8时,随后由于太阳辐射的增强使得光化学反应剧烈,O3浓度逐渐升高[23],于15时出现峰值,然后开始下降直到次日早上,对比看来春夏季O3浓度更高,峰值时O3浓度值可达130 μg·m−3。洪泽地区的日变化趋势与江苏省和淮安市区域日变化趋势相似,但峰值时刻,洪泽地区O3更高,这说明相比于淮安甚至江苏省其他地区,洪泽大气环境可能更有利于O3的光化学形成及累积。
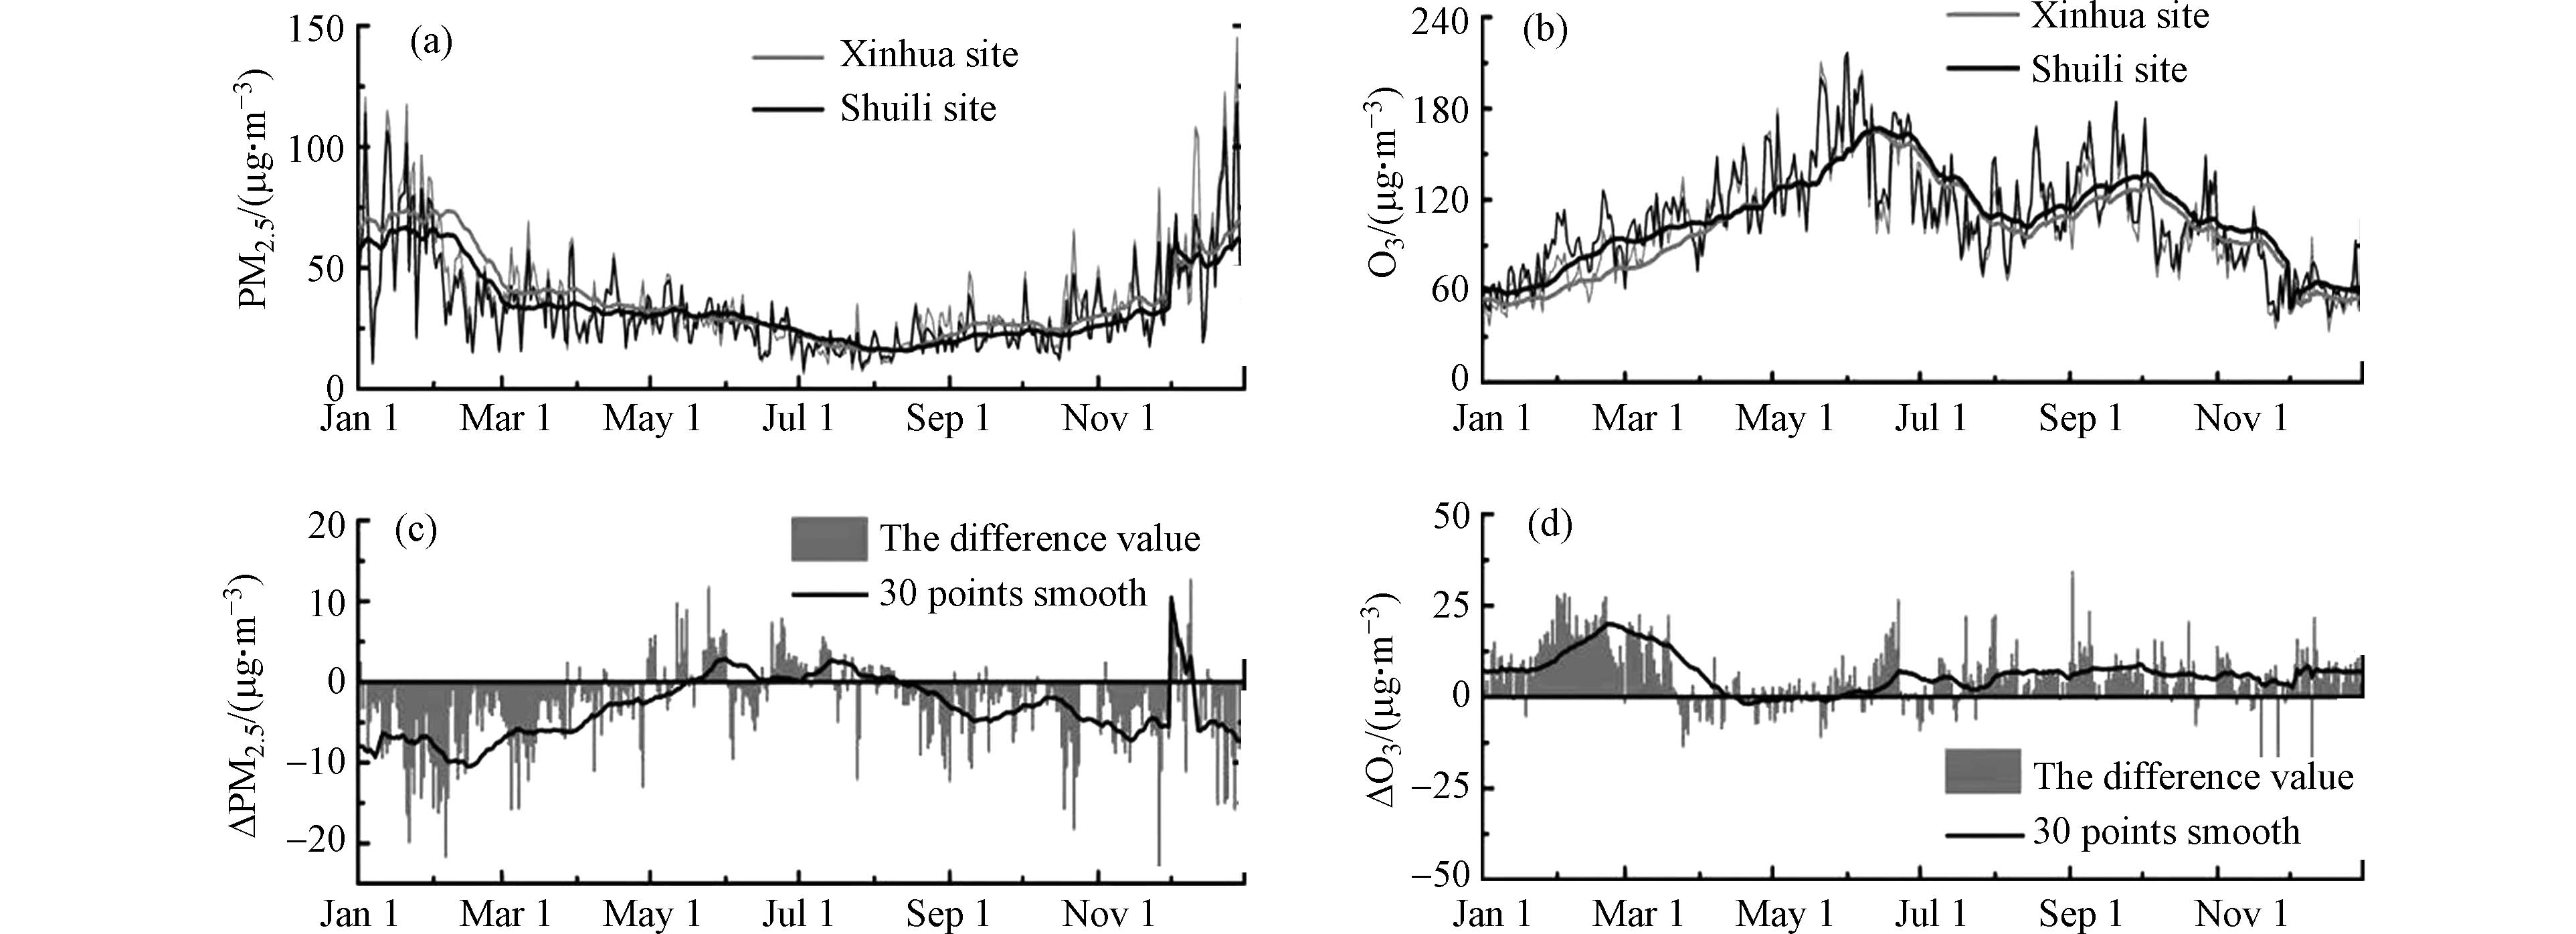
洪泽区内有两个空气质量自动站,如图1所示,一个是位于区中心位置的新华书店站,一个是位于洪泽湖畔的水利局站,尽管两站相距仅3 km,但PM2.5及O3浓度存在较明显的差异,如图5所示。新华书店站PM2.5浓度高于水利局站,特别是在冬季,两站差异最大,其中2月新华书店站PM2.5浓度高出水利局站10 μg·m−3;夏季两站差异较小,接近于零。结合洪泽区工业区位置以及不同季节盛行风向可以判断出,新华书店站正北方为大范围工业园区,区内有盐化企业以及热电厂等高温生产线以及大型烟囱排口,高温以及高浓度一次污染物排放在冬季盛行的北风影响下很可能导致下风向的新华书店站细颗粒物浓度升高;水利局站位于洪泽湖畔,上风向多为湖区,清洁的湖风不仅有利于局地污染物的扩散,还会输送清洁的湖面气团,最终使得水利局站PM2.5较低。
而在夏季,多盛行偏南风,洪泽区南侧多为农田,污染排放量较少,两站差异较小。两站O3的差异与PM2.5完全相反,水利局站O3浓度全年均高于新华书店站,特别是2—3月份,水利局站高出新华书店站约20 μg·m−3,夏季平均约高出10 μg·m−3;水利局站O3浓度高,可能存在如下原因:两站均处于城区,属于VOCs控制区,水利局站NOx低于新华书店站,根据EKMA曲线,NOx的降低,可能导致O3浓度的升高;水利局站更靠近水体,湖面的镜反射,可能会加强观测点短波辐射强度,进而有利于O3的光化学生成过程;下垫面为水体的时候,O3干沉降弱,不利于O3的干沉降清除,因此,靠近水体的水利局站,O3沉降量比新华书店站低;两站温度及湿度的微弱差异也可能导致两站O3的差异。湖陆风效应以及细颗粒物表面的非均相反应对两站PM2.5以及O3的差异也可能扮演的重要角色。在冬季,湖面作为暖源,使得对流层会有更强烈的垂直交换,通常PM2.5主要集中于边界层内,随着高度增加PM2.5减少,冬季湖畔水利局站周边强烈的垂直交换会使得PM2.5浓度下降;而O3则相反,上层大气中存在着更高浓度的O3,因此强烈的垂直交换会使得上层高O3被带至近地面,并通过湖陆风输送到湖畔站。或者减少辐射,新华书店站PM2.5浓度高于湖畔站,细颗粒物的散射消光作用会减少辐射,进而减弱O3的生成过程;细颗粒物表面也会发生非均相化学反应,减少臭氧前体物,从而导致新华书店站O3的生成和浓度低于湖畔站。总体来说,O3为二次污染物并且PM2.5与O3之间也存在复杂的相关关系,两站PM2.5和O3浓度的差异以及变化还需要大量的观测与模拟来揭示其中的机理,在未来的研究中加强湖路交界处空气质量的监测以量化湖陆风效应以及非均相反应的影响。
-
由上文可以看出冬季PM2.5浓度超标更严重且污染事件更为集中,故结合PM2.5的浓度数据并利用Meteoinfo软件对洪泽地区冬季PM2.5的后向轨迹进行聚类分析和PSCF分析,为方便对比,还列出了其他季节的情况,结果如图6所示。轨迹的方向和路径表示气团的移动路径,图中标号为不同类别轨迹的轨迹标号,轨迹末尾的百分数字为该轨迹占所有轨迹的百分比,括号内数字为该轨迹所携带PM2.5的平均浓度。可以通过轨迹的长度判断气流移动的快慢,轨迹越长则移动速度越快。
不同季节的轨迹聚类结果和PSCF结果不同,对于冬季而言,聚类结果如图6(a),其中轨迹4所占比例最高,占总轨迹数的22.58%,且轨迹的PM2.5平均浓度最高,为122 μg·m−3,该轨迹来自西南方向,途经安徽北部和江苏西北部,该轨迹气团移动速度较慢;其次,是来自北部途经山东和江苏北部的轨迹6,该轨迹气团移动速度较快,占总轨迹数的17.20%,轨迹的PM2.5平均浓度为87 μg·m−3;其他方向的轨迹PM2.5平均浓度较低。洪泽区冬季WPSCF结果如图6(b)所示,冬季洪泽区WPSCF高值区域(>0.5)分布较广且分布较为集中,主要分布在山东南部、江苏北部及安徽东北部,其中在安徽北部、东北部WPSCF值甚至>0.8,表明该区域存在强污染排放源,是影响洪泽区PM2.5的可能潜在源区。结合图6(a)和图6(b),安徽北部、东北部为洪泽区冬季的可能潜在源区;其次山东南部、江苏北部对洪泽区的PM2.5浓度有一定贡献。
对于春季和秋季,聚类结果如图6(c)和图6(g)所示,从图中可以看出春季和秋季各个轨迹的PM2.5平均浓度较低,均未超过50 μg·m−3,春季来自北部的气团占比最高,秋季来自东北方向的气团占比较高。对于春季,轨迹3所占比例最高,为27.92%,该轨迹来自东部,途经黄海、江苏东南部,移动速度较快;对于秋季,来自东北部的轨迹1和轨迹4占轨迹总数比例较高。洪泽区春季WPSCF结果如图6(d)所示,春季洪泽区WPSCF高值区域(>0.5)主要分布在江苏省西南部、江苏西北部及安徽南部,表明该区域影响洪泽区PM2.5的可能潜在源区。洪泽区秋季WPSCF结果如图6(h)所示,可以看出在春季洪泽区WPSCF高值区域(>0.5)分布较集中,主要分布在江苏省东北部及江苏东南部,表明该区域影响洪泽区PM2.5的可能潜在源区。结合图6(c)和图6(d),江苏西北部为洪泽区春季的可能潜在源区;其次春季安徽南部、江苏西南部对洪泽区的PM2.5浓度有一定贡献。结合图6(g)和图6(h),江苏东北部为洪泽区冬季的可能潜在源区;其次秋季江苏西南部对洪泽区的PM2.5浓度有一定贡献。
对于夏季,聚类结果如图6(e),4个轨迹的PM2.5平均浓度较低,最高的平均轨迹浓度只有20 μg·m−3。轨迹1所占比例最高,为49.06%,该轨迹来自东南偏东方向,途经黄海、江苏东部,移动速度最慢,轨迹的PM2.5平均浓度为20 μg·m−3。洪泽区夏季WPSCF结果如图6(f)所示,可以看出在春季洪泽区WPSCF值总体较低(<0.3),无明显潜在源区。结合图6(e)和图6(f),洪泽区夏季气团主要来自东部(聚类1),但该轨迹PM2.5平均浓度较低且WPSCF值偏低,对洪泽区的PM2.5浓度贡献不大。洪泽夏季总体WPSCF值偏低,该地区夏季PM2.5的主要来源可能为本地的排放。
洪泽区PM2.5潜在源区随季节的变化而有所不同。聚类结果表明,洪泽区四季主要以东部及北部的气流为主,包括长距离输送和短距离输送,冬季的污染气流较多,而春夏秋3个季节的气团主要为清洁气团。PSCF结果表明,冬季WPSCF值较高,且高值区域分布较为广泛和集中,夏季WPSCF无明显高值区。对于冬季而言,安徽北部为主要的污染源区,其次山东南部和江苏北部对洪泽区污染有一定贡献,对于春秋季节江苏东南部均为洪泽区的潜在源区,夏季区域传输对洪泽区的影响不大。
-
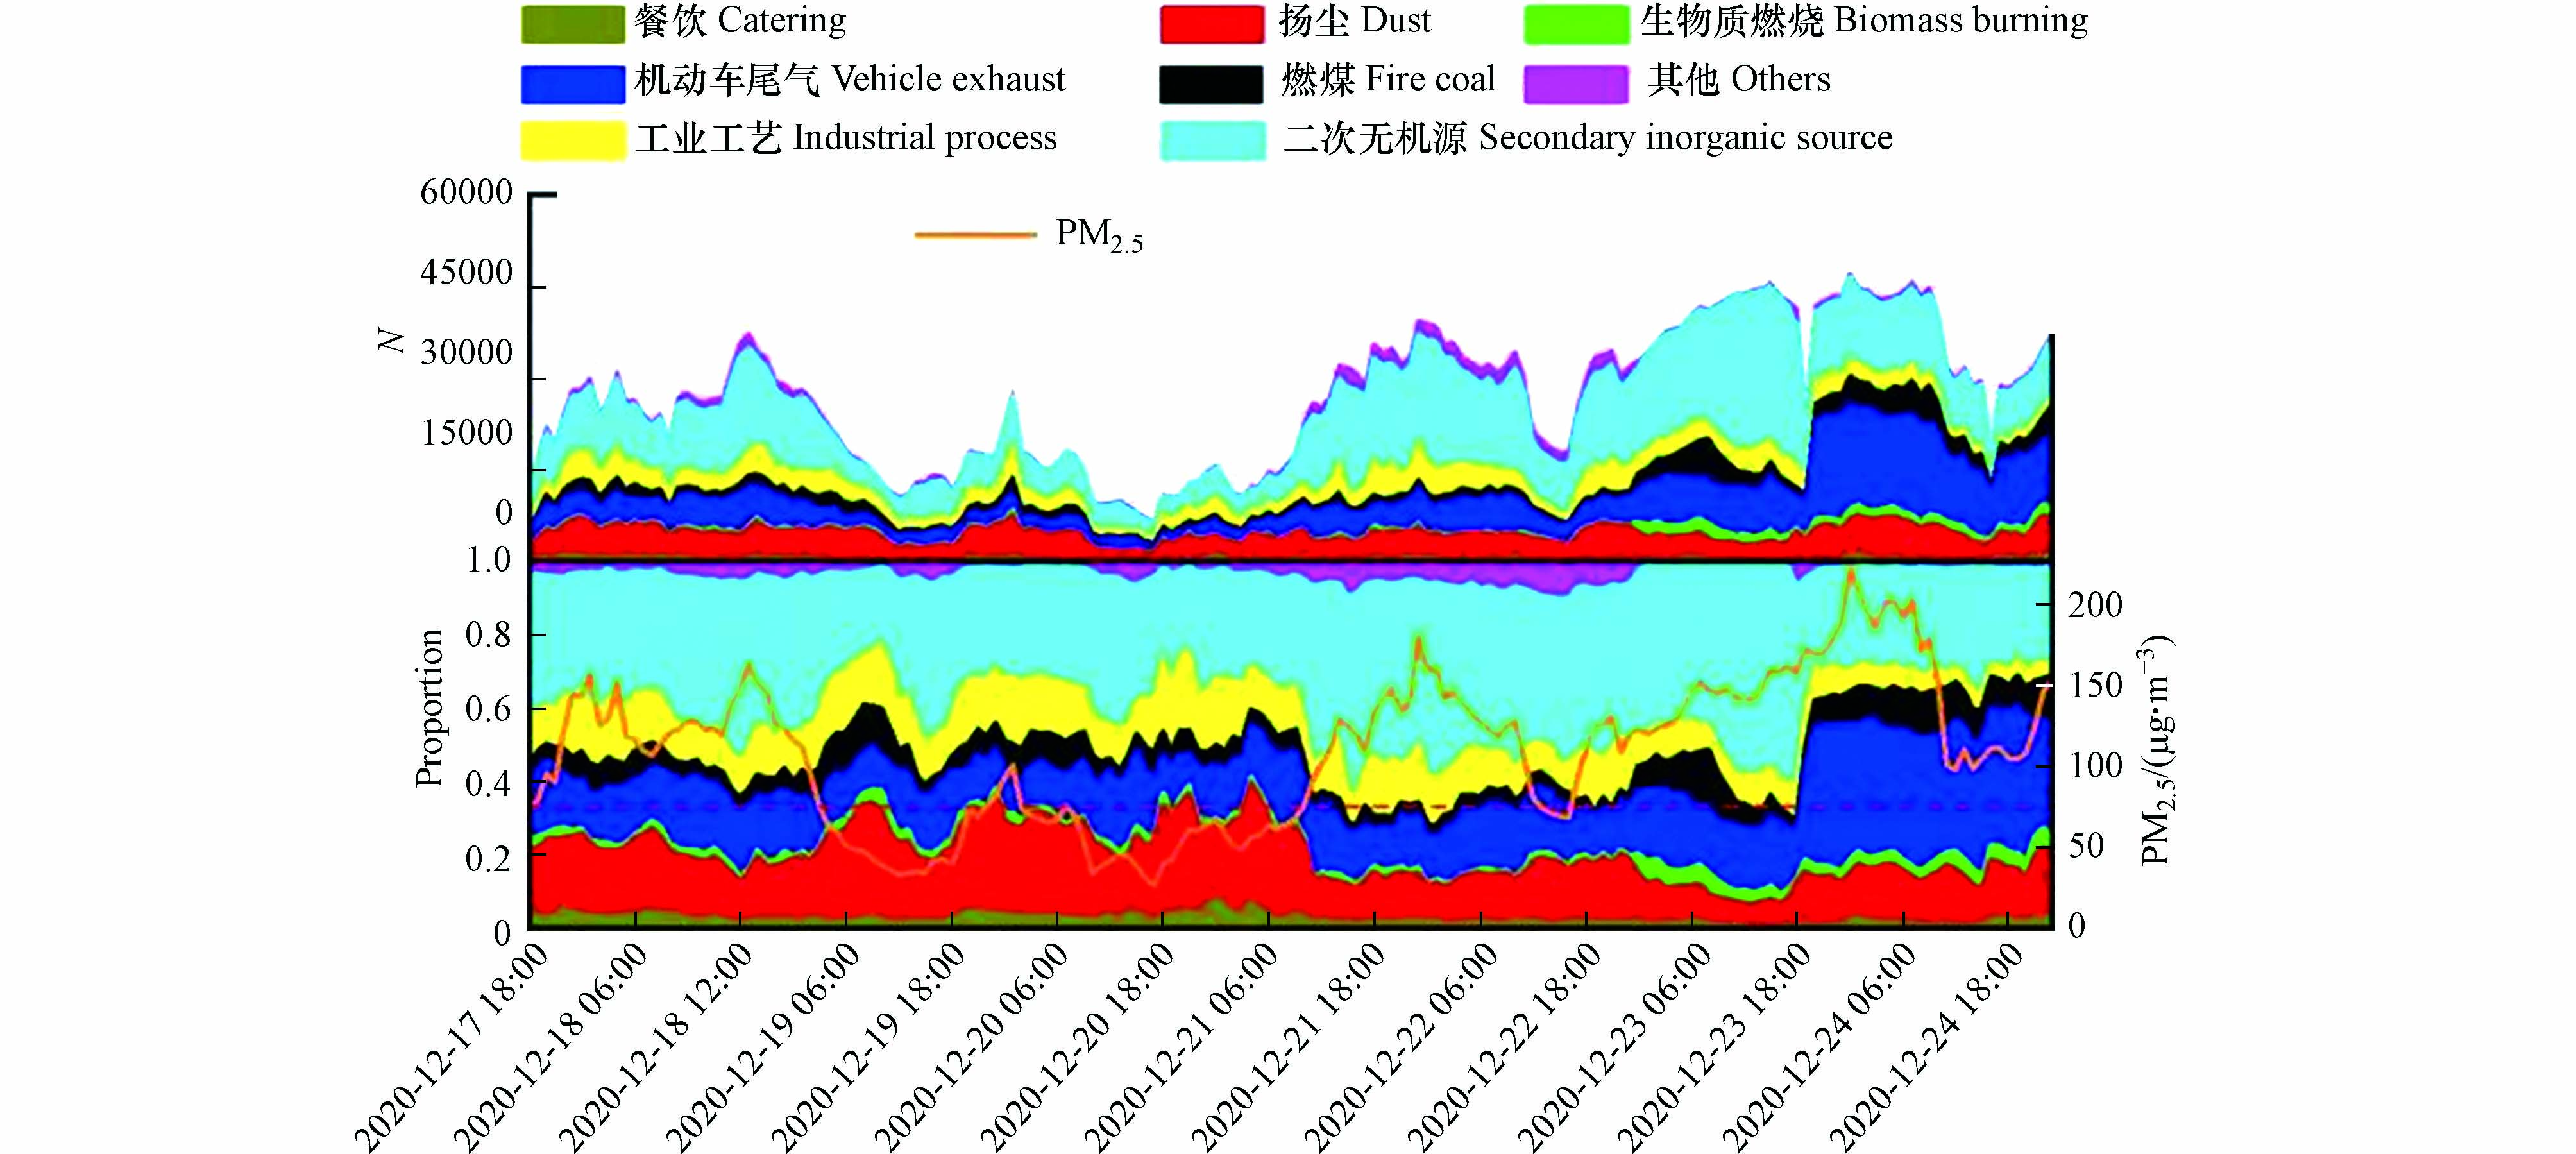
基于2020年12月17日至2020年12月24日期间在线单颗粒气溶胶质谱仪(SPAMS 05系列)连续采样数据,参照《大气颗粒物来源解析技术指南》,结合当地的能源结构,按照环境管理需求对细颗粒物排放源进行分类,将洪泽区细颗粒物污染来源归结8大类,分别为餐饮源、扬尘源、生物质燃烧源、机动车尾气源、燃煤源、工业工艺源、二次无机源、其它。扬尘包含建筑扬尘、道路扬尘、土壤尘等颗粒;生物质燃烧源主要是农作物秸秆、野草等露天焚烧及生物燃料锅炉排放的颗粒;机动车尾气源包含了柴油车、汽油车等交通工具排放的颗粒;燃煤源包含了燃煤电厂、锅炉、散煤燃烧、煤工艺制造过程等排放的颗粒;工业工艺源包含了化工、金属冶炼等工艺过程排放的颗粒;二次无机源主要指从单颗粒谱图来看,除钾离子外,只含有二次无机组分(硫酸盐、硝酸盐等)的颗粒,在一定程度上可以反映大气二次反应的强度。此类颗粒物中的硫酸盐、硝酸盐等二次组分主要是在高湿条件下由大气中的二氧化硫、二氧化氮等气态污染物转化而成。未包含在上述源类以及未被识别的颗粒物归于其它源。细颗粒物污染物来源解析结果表明,监测期间细颗粒物污染来源构成为:二次无机源(38.8%)、机动车尾气源(20.3%)、扬尘源(15.2%)、工业工艺源(10.8%)、燃煤源(6.5%)、其它(3.6%)、生物质燃烧源(2.5%)、餐饮源(2.3%)。
12月17日至12月18日出现污染过程,如图7所示,PM2.5日均浓度最大为129 μg·m−3,PM2.5上升过程主要受二次无机源的影响,同时,该时段机动车尾气源、扬尘源和工业工艺源占比较高,也是主要污染来源。12月21日至12月24日出现较为严重的污染过程,PM2.5日均浓度最大为153 μg·m−3,PM2.5上升过程主要受二次无机源、机动车尾气源、扬尘源、工业工艺源以及燃煤源的影响。
根据12月观测期间PM2.5的浓度划分为5个等级,统计出各等级内不同来源所占比重的差异,如表1所示。从优到轻度污染等级,PM2.5质量浓度均值从32 μg·m−3上升至100 μg·m−3,期间机动车尾气源占比从16.0%上升至22.7%,颗粒物数浓度从1629个·h−1上升至5877个·h−1;燃煤源占比从5.5%上升至6.2%,颗粒物数浓度从566个·h−1上升至1611个·h−1。从轻度污染等级到中度污染等级,PM2.5质量浓度均值从100 μg·m−3上升至132 μg·m−3,期间二次无机源占比从35.8%上升至44.3%,颗粒物数浓度从9266个·h−1上升至14713个·h−1;工业工艺源占比从9.9%上升至10.9%,颗粒物数浓度从2567个·h−1上升至3626个·h−1。从中度污染等级到重度污染等级,PM2.5质量浓度均值从132 μg·m−3上升至176 μg·m−3,期间机动车尾气源占比从17.3%上升至27.9%,颗粒物数浓度从5758个·h−1上升至11497个·h−1;燃煤源占比从5.9%上升至7.7%,颗粒物数浓度从1972个·h−1上升至3181个·h−1。总体来看,冬季监测期间PM2.5的上升主要受二次无机源、机动车尾气源、工业工艺源、燃煤源增多的影响。
-
基于2020年7月、9月以及11月开展的9次高时空分辨率VOCs移动监测,得到洪泽工业园区多条街道VOCs空间分布特征以及主要组分。如图8(a)所示街道范围内有3处总VOCs高值区,第1处为加油站周边,第2处为某化工企业周边,第3处为某纸业公司,其峰值浓度分别为16872 、15849 、11070 μg·m−3。第2处主要物质为:氯苯(7248 μg·m−3),甲苯(5187 μg·m−3),二甲苯(1224 μg·m−3),苯胺(785 μg·m−3),二氯苯(572 μg·m−3);第3处主要物质为:戊烯(3202 μg·m−3),丁烯(1996 μg·m−3),己烯(1224 μg·m−3),甲苯(1197 μg·m−3),甲基环己烷(945 μg·m−3)。经实地考察以上物质主要为企业生产过程中无组织释放的一些化学成分以及涂料。图8(b)所示街道中有一处总VOCs高值区,峰值为2361 μg·m−3,周边TVOCs浓度约50 μg·m−3,主要物质为:三甲苯(992 μg·m−3),二乙基苯(401 μg·m−3),该区域的峰值属于偶发事件,后期移动观测均未发现该高值区。图8(c)所示街道中显示一处VOCs高值区,其峰值浓度为3701 μg·m−3,主要物质为:二甲苯(2875 μg·m−3),丁烯(366 μg·m−3),后经证实,该高值区为某木业厂区,木制品油漆无组织排放导致高浓度的VOCs。图8(d)所示街道中总VOCs浓度均处于200 μg·m−3以下,没有峰值区。经以上观测可知,工业区内存在多处总VOCs高浓度区,其中以含苯类、烯烃类物质为主。根据VOCs移动监测结果进行类源划分可得,洪泽工业园区VOCs主要以芳香烃占比最高,如表2所示,占比58%;其次为烷烃;烯烃、卤代烃、含氧含氮烃、有机硫相对占比较小。此外,还对淮安市洪泽新华书店周边VOCs进行了移动监测,其结果表明VOCs也主要为芳香烃,占比39%,其次为烷烃、卤代烃及含氧含氮烃,分别占比20%、17%及16%;其烯烃、有机硫相对占比较小。从各类物质占比来看,国控点新华书店站VOCs的主要来源为周边工业区的排放。
-
(1) 基于2019年12月—2020年11月PM2.5和O3的监测结果,本研究表明洪泽区O3污染主要集中在春夏秋季,而PM2.5污染主要集中在冬季,O3和PM2.5均呈现出明显的日变化特征,PM2.5在白天8时达峰值,15时达谷值;O3浓度在早上8时达谷值,15时达到峰值。洪泽区PM2.5浓度优于淮安市平均以及江苏省平均值,而O3劣于淮安市平均以及江苏省平均值。洪泽区内两测站PM2.5及O3对比结果表明,湖畔PM2.5浓度较低而O3浓度较高,两站差异在冬季,特别是2—3月差异最大,这很可能与工业园区一次排放、氮氧化物(NOx)的滴定作用以及湖陆风效应等有关。
(2) 洪泽区的PM2.5后向轨迹聚类结果表明,春夏秋3个季节的气团携带的污染物浓度较低,江苏东南部为春秋季节的主要污染物潜在源区,夏季区域传输对该地区的污染物浓度影响不大;对于冬季,安徽北部为主要的污染源区,山东南部及江苏北部对该地区污染有一定影响。冬季,途经安徽北部、安徽东北、江苏西北部的轨迹占比最高,达22.58%,且轨迹所携带的污染物浓度最高达122 μg·m−3。潜在源分析结果显示安徽北部、江苏北部及山东南部为主要高浓度潜在源区。
(3) 洪泽区内冬季细颗粒物在线源解析表明,监测期间PM2.5平均来源构成为:二次无机源(38.8%)、机动车尾气源(20.3%)、扬尘源(15.2%)、工业工艺源(10.8%)、燃煤源(6.5%)、其它(3.6%)、生物质燃烧源(2.5%)、餐饮源(2.3%)。监测期间PM2.5的上升主要受二次无机源、机动车尾气源、工业工艺源、燃煤源增多的影响;作为O3重要前体物的可挥发性有机物(VOCs),其监测结果表明,洪泽工业园区VOCs主要以芳香烃占比最高,为58%;新华书店站VOCs也主要为芳香烃,占比39%,其次为烷烃、卤代烃及含氧含氮烃,分别占比20%、17%及16%。
综上所述,就本地污染物特点来说,冬季污染物主要为PM2.5,其他季节主要为O3,VOCs为O3的重要前体物之一,特别是城市地区;二次无机源(硫酸盐、硝酸盐等颗粒)以及机动车尾气为区内细颗粒物重要来源,芳香烃为区内VOCs主要来源,加强区内涉及该类污染物的化工企业的管理以及相关交通管制将很可能有效改善区内空气质量。
致谢 本论文的数值计算得到了南京信息工程大学高性能计算中心的计算支持和帮助。感谢淮安市洪泽生态环境局提供的数据支持
淮安市洪泽区细颗粒物及臭氧污染特征
Study on characteristics of fine particulate matter and ozone pollution in Hongze District of Huai 'an City
-
摘要: 本研究基于我国生态环境部空气质量自动监测站逐时监测数据分析了淮安市洪泽区细颗粒物(PM2.5)及臭氧(O3)时空变化特征及其来源特征。结果表明,该地区PM2.5浓度冬季高,夏季低;O3浓度春秋季高,冬季低;PM2.5和O3均呈现显著的日变化特征,PM2.5呈U型分布,15时浓度最低,O3呈单峰分布,15时达峰值,谷值出现在08时。与江苏省及淮安市区域平均值相比,洪泽区PM2.5浓度较低而O3浓度则较高。对比洪泽区内两测站PM2.5及O3表明,湖畔PM2.5浓度较低而O3浓度较高,两站差异在冬季,特别是2—3月差异最大,这很可能与工业园区一次排放、氮氧化物(NOx)的滴定作用以及湖陆风效应等有关。后向轨迹聚类和PSCF方法对洪泽区PM2.5潜在源的分析结果表明,污染物浓度在冬季受区域传输的影响较大,安徽北部、东北部为洪泽区最主要的潜在贡献源区。洪泽区内冬季细颗粒物在线源解析表明,监测期间PM2.5的上升主要受二次无机源、机动车尾气源、工业工艺源、燃煤源增多的影响;作为O3重要前体物的可挥发性有机物(VOCs),其监测结果表明,洪泽工业园区VOCs主要以芳香烃占比最高,为58%;新华书店站VOCs也主要为芳香烃,占比39%,其次为烷烃、卤代烃及含氧含氮烃,分别占比20%、17%及16%。Abstract: Based on the hourly monitoring data of the air quality automatic monitoring station of the Ministry of ecological environment of China, this study analysed the temporal and spatial variation characteristics and source characteristics of fine particulate matter (PM2.5) and ozone (O3) in Hongze district on the east side of Hongze Lake. The results showed that the concentration of PM2.5 was higher in winter and lower in summer; the concentration of O3 was higher in spring and autumn, but lower in winter; both PM2.5 and O3 showed significant diurnal variation characteristics,PM2.5 showed a U-shaped distribution, the lowest concentration at 15:00, O3 showed a single peak distribution, reached the peak at 15:00, and the valley appeared at 08:00. Compared with the regional average of Jiangsu Province and Huai'an City, the concentration of PM2.5 in Hongze was lower, while the concentration of O3 was higher. The comparison of PM2.5 and O3 between the two sites in Hongze shows that PM2.5 concentration by the lakeside is lower while O3 concentration is higher. The difference between the two sites is greatest in winter, especially in February and March, which is probably related to primary emissions from the industrial zone, titration of nitrogen oxides (NOx) and lake-land wind effect. The analysis results of the potential sources of PM2.5 in Hongze by backward trajectory clustering and PSCF show that the pollutant concentration is greatly affected by the regional transport in winter, and the north and northeast of Anhui Province are the main potential sources of PM2.5 in Hongze. Online source analysis of PM2.5 in winter in Hongze shows that the increase of PM2.5 during the monitoring period is mainly affected by the increase of secondary inorganic sources, motor vehicle exhaust sources, industrial process sources and coal burning sources. As an important precursor of O3, volatile organic compounds (VOCs), the monitoring results show that VOCs in Hongze Industrial Zone mainly take up the highest proportion of aromatic hydrocarbons, accounting for 58%; VOCs at Xinhua Bookstore site also are mainly aromatic hydrocarbons, accounting for 39%, followed by alkanes, halogenated hydrocarbons and oxygen-containing nitrogen hydrocarbons, accounting for 20%, 17% and 16%, respectively.
-
Key words:
- PM2.5 /
- PSCF /
- online source analysis /
- VOCs measurement
-

-
图 6 冬季轨迹聚类结果(a)、冬季WPSCF结果(b)、春季轨迹聚类结果(c)、春季WPSCF结果(d)、夏季轨迹聚类结果(e)、夏季WPSCF结果(f)、秋季轨迹聚类结果(g)、秋季WPSCF(h)
Figure 6. Cluster-mean back trajectories in winter(a), weighted potential source contribution function(WPSCF)maps of PM2.5 in winter(b), Cluster-mean back trajectories in spring(c), WPSCF maps of PM2.5 in spring(d), Cluster-mean back trajectories in summer(e), WPSCF maps of PM2.5 in summer(f), Cluster-mean back trajectories in autumn (g), WPSCF maps of PM2.5 in autumn (h)
表 1 不同污染程度各污染源贡献率以及对应的PM2.5浓度
Table 1. Contribution rates of pollution sources and PM2.5 concentration at different pollution levels
组分
Component优
Excellent良
Good轻度污染
Light中度污染
Moderately重度污染
Severe二次无机源(Secondary inorganic source) 36.9% 31.7% 35.8% 44.3% 36.4% 扬尘源(Dust) 19.5% 23.6% 16.4% 12.8% 12.4% 机动车尾气源(Vehicle exhaust) 16.0% 14.3% 22.7% 17.3% 27.9% 工业工艺源(Industrial process) 12.9% 14.3% 9.9% 10.9% 8.6% 燃煤源(Fire coal) 5.5% 6.7% 6.2% 5.9% 7.7% 其它(Rest) 4.6% 3.7% 3.8% 4.1% 2.6% 餐饮源(Catering) 2.4% 3.6% 2.6% 2.1% 1.7% 生物质燃烧源(Biomass burning) 2.2% 2.1% 2.5% 2.5% 2.6% PM2.5 32 μg·m−3 61 μg·m−3 100 μg·m−3 132 μg·m−3 176 μg·m−3 表 2 洪泽区工业园区以及新华书店站周边VOCs各类源占比
Table 2. VOCs classfy source ratio of Hongze Industrial Zone and Xinhua Bookstore site
VOCs源
VOCs sources工业园区/%
Hongze industrial zone新华书店站/%
Xinhua bookstore site芳香烃(Arene) 58 39 含氧含氮烃(Oxygen-nitrogenous hydrocarbons) 13 16 烷烃(Alkane) 16 20 卤代烃(Halohydrocarbon) 8 17 有机硫(Organic sulfur) 2 4 烯烃(Olefin) 3 5 -
[1] 史旭荣, 逯世泽, 易爱华, 等. 全国2018—2019年秋冬季气象条件变化对PM2.5影响研究 [J]. 中国环境科学, 2020, 40(7): 2785-2793. doi: 10.3969/j.issn.1000-6923.2020.07.001 SHI X R, LU S Z, YI A H, et al. Impact of meteorological conditions on PM2.5 in autumn and winter of 2018-2019 in key areasFull text replacement [J]. China Environmental Science, 2020, 40(7): 2785-2793(in Chinese). doi: 10.3969/j.issn.1000-6923.2020.07.001
[2] WANG P, CAO J J, TIE X X, et al. Impact of meteorological parameters and gaseous pollutants on PM2.5 and PM10 mass concentrations during 2010 in xi’an, China [J]. Aerosol and Air Quality Research, 2015, 15(5): 1844-1854. doi: 10.4209/aaqr.2015.05.0380 [3] 黄小刚, 邵天杰, 赵景波, 等. 气象因素和前体物对中国东部O3浓度分布的影响 [J]. 中国环境科学, 2019, 39(6): 2273-2282. doi: 10.3969/j.issn.1000-6923.2019.06.005 HUANG X G, SHAO T J, ZHAO J B, et al. Impact of meteorological factors and precursors on spatial distribution of ozone concentration in Eastern China [J]. China Environmental Science, 2019, 39(6): 2273-2282(in Chinese). doi: 10.3969/j.issn.1000-6923.2019.06.005
[4] ZHANG Y L, CAO F. Fine particulate matter (PM2.5) in China at a city level [J]. Scientific Reports, 2015, 5: 14884. doi: 10.1038/srep14884 [5] 程麟钧, 王帅, 宫正宇, 等. 中国臭氧浓度的时空变化特征及分区 [J]. 中国环境科学, 2017, 37(11): 4003-4012. doi: 10.3969/j.issn.1000-6923.2017.11.001 CHENG L J, WANG S, GONG Z Y, et al. Spatial and seasonal variation and regionalization of ozone concentrations in China [J]. China Environmental Science, 2017, 37(11): 4003-4012(in Chinese). doi: 10.3969/j.issn.1000-6923.2017.11.001
[6] 李名升, 任晓霞, 于洋, 等. 中国大陆城市PM2.5污染时空分布规律 [J]. 中国环境科学, 2016, 36(3): 641-650. doi: 10.3969/j.issn.1000-6923.2016.03.001 LI M S, REN X X, YU Y, et al. Spatiotemporal pattern of ground-level fine particulate matter(PM2.5) pollution in China's mainland [J]. China Environmental Science, 2016, 36(3): 641-650(in Chinese). doi: 10.3969/j.issn.1000-6923.2016.03.001
[7] 周明卫, 康平, 汪可可, 等. 2016—2018年中国城市臭氧浓度时空聚集变化规律 [J]. 中国环境科学, 2020, 40(5): 1963-1974. doi: 10.3969/j.issn.1000-6923.2020.05.013 ZHOU M W, KANG P, WANG K K, et al. The spatio-temporal aggregation pattern of ozone concentration in China from 2016 to 2018 [J]. China Environmental Science, 2020, 40(5): 1963-1974(in Chinese). doi: 10.3969/j.issn.1000-6923.2020.05.013
[8] 张亮, 朱彬, 高晋徽, 等. 长江三角洲夏季一次典型臭氧污染过程的模拟 [J]. 环境科学, 2015, 36(11): 3981-3988. ZHANG L, ZHU B, GAO J H, et al. Modeling study of A typical summer ozone pollution event over Yangtze River Delta [J]. Environmental Science, 2015, 36(11): 3981-3988(in Chinese).
[9] 余钟奇, 瞿元昊, 周广强, 等. 2018年秋冬季长江三角洲区域PM2.5污染来源数值研究 [J]. 中国环境科学, 2020, 40(10): 4237-4246. doi: 10.3969/j.issn.1000-6923.2020.10.006 YU Z Q, QU Y H, ZHOU G Q, et al. Numerical simulations of PM2.5 pollution source in the Yangtze River Delta region in fall and winter in 2018 [J]. China Environmental Science, 2020, 40(10): 4237-4246(in Chinese). doi: 10.3969/j.issn.1000-6923.2020.10.006
[10] 刘慧, 夏敦胜, 陈红, 等. 2017年兰州市大气污染物输送来源及传输特征模拟分析 [J]. 环境科学研究, 2019, 32(6): 993-1000. LIU H, XIA D S, CHEN H, et al. Simulation analysis of sources and transmission characteristics of air pollutants in Lanzhou City in 2017 [J]. Research of Environmental Sciences, 2019, 32(6): 993-1000(in Chinese).
[11] 武高峰, 王丽丽, 董洁, 等. 国庆前后北京城区PM2.5组分污染及来源特征分析 [J]. 环境化学, 2021, 40(12): 3721-3732. doi: 10.7524/j.issn.0254-6108.2020072702 WU G F, WANG L L, DONG J, et al. Pollution and source characteristics of PM2.5 components in Beijing urban area around National Day [J]. Environmental Chemistry, 2021, 40(12): 3721-3732(in Chinese). doi: 10.7524/j.issn.0254-6108.2020072702
[12] 高晋徽, 朱彬, 王东东, 等. 南京北郊O3、NO2和SO2浓度变化及长/近距离输送的影响 [J]. 环境科学学报, 2012, 32(5): 1149-1159. GAO J H, ZHU B, WANG D D, et al. The variation of air pollutants and the impact of long-range transport in the northern suburb of Nanjing [J]. Acta Scientiae Circumstantiae, 2012, 32(5): 1149-1159(in Chinese).
[13] ZHENG B, TONG D, LI M, et al. Trends in China's anthropogenic emissions since 2010 as the consequence of clean air actions [J]. Atmospheric Chemistry and Physics, 2018, 18(19): 14095-14111. doi: 10.5194/acp-18-14095-2018 [14] 吴礼裕, 何涛, 王振. 环太湖城市夏季臭氧的潜在影响分析 [J]. 污染防治技术, 2018(6): 61-65. WU L Y, HE T, WANG Z. Analysis of the potential impact of the Taihu Lake on summer ozone of the surrounding cities [J]. Pollution Control Technology, 2018(6): 61-65(in Chinese).
[15] DRAXLER R, STUNDER B, ROLPH G, et al. Hysplit4 User’S Guide [Z]. [16] 沈学勇, 翟崇治, 许丽萍, 等. 利用轨迹模式研究重庆主城区冬季PM2.5污染特征 [J]. 环境污染与防治, 2016, 38(3): 72-76. SHEN X Y, ZHAI C Z, XU L P, et al. Study on pollution characteristics of PM2.5 in Chongqing urban area in winter with backward trajectories [J]. Environmental Pollution & Control, 2016, 38(3): 72-76(in Chinese).
[17] 王爱平, 朱彬, 银燕, 等. 黄山顶夏季气溶胶数浓度特征及其输送潜在源区 [J]. 中国环境科学, 2014, 34(4): 852-861. WANG A P, ZHU B, YIN Y, et al. Aerosol number concentration properties and potential sources areas transporting to the top of mountain Huangshan in summer [J]. China Environmental Science, 2014, 34(4): 852-861(in Chinese).
[18] 黄乾, 王海波. 南京北郊污染物来源及跨区域输送过程研究 [J]. 大气科学学报, 2019, 42(4): 531-541. HUANG Q, WANG H B. Sources and transregional transport process of air pollutant in northern suburbs of Nanjing [J]. Transactions of Atmospheric Sciences, 2019, 42(4): 531-541(in Chinese).
[19] 杨俊超, 陈志明, 支国瑞, 等. 百色市冬季PM2.5传输路径及来源分析 [J]. 环境监测管理与技术, 2020, 32(1): 23-27. YANG J C, CHEN Z M, ZHI G R, et al. Transmission path and potential sources of PM2.5 during the winter in Baise [J]. The Administration and Technique of Environmental Monitoring, 2020, 32(1): 23-27(in Chinese).
[20] 刘迎云, 姜雨, 宗梁, 等. 基于HYSPLIT模型的衡阳市大气PM2.5潜在源分析 [J]. 南华大学学报(自然科学版), 2019, 33(6): 12-17. LIU Y Y, JIANG Y, ZONG L, et al. Potential source analysis of PM2.5 based on HYSPLIT model in Hengyang [J]. Journal of University of South China (Science and Technology), 2019, 33(6): 12-17(in Chinese).
[21] 姜雨, 刘迎云, 宗梁, 等. 衡阳市冬季PM2.5外来输送特征及潜在源分析 [J]. 环境工程, 2019, 37(7): 142-147. JIANG Y, LIU Y Y, ZONG L, et al. Analysis of characteristics and potential sources of pm2.5 external transportation in Hengyang in winter [J]. Environmental Engineering, 2019, 37(7): 142-147(in Chinese).
[22] WANG Y Q, ZHANG X Y, ARIMOTO R. The contribution from distant dust sources to the atmospheric particulate matter loadings at Xi’an, China during spring [J]. Science of the Total Environment, 2006, 368(2/3): 875-883. [23] 刘建, 吴兑, 范绍佳, 等. 前体物与气象因子对珠江三角洲臭氧污染的影响 [J]. 中国环境科学, 2017, 37(3): 813-820. LIU J, WU D, FAN S J, et al. Impacts of precursors and meteorological factors on ozone pollution in Pearl River Delta [J]. China Environmental Science, 2017, 37(3): 813-820(in Chinese).
-


 下载:
下载:


