

-
磷在生物圈地球化学循环中具有重要作用,其对水生态系统的初级生产力具有重要作用,磷的增加是造成水体富营养化的重要指标[1-3]. 现有研究表明,磷是我国地表水环境中最常见的污染指标,也是造成水体特别是湖库富营养化的主要限制性因子[4-5]. 水体中的磷营养盐来源包括外源和内源,外源性输入和内源性释放是磷迁移转化重要方式[6]. 磷的外源性输入主要分为工业源、农业源和生活源,一般通过区域降雨降尘,排污和地表径流,船舶航行和旅游,湖区养殖投饵等方式进入水体,其中径流输入是外源性输入的最大负荷;内源性输入主要来源沉积物释放和生物死亡分解. 磷元素进入水体中后,主要在沉积物和水体之间进行迁移转化[7-9]. 与湖泊相比,河流具有流动特性,所以磷在表层水—孔隙水—沉积物中迁移转化更加复杂[10-12]. 因此,研究浅水河流不同介质中磷的分布特征及其迁移转化规律,对于河道水生态环境整治具有重要意义[13-15]. 从近年监测结果来看,典农河作为黄河宁夏段排水量最大、流域最长、水质最复杂的入黄河流,其水质整体有所改善,但极不稳定,沟渠关系复杂,水质时空差异较大,夏秋季节农业退水时段水质较好,春冬季节基流小水质差,上游污染物排放量大,下游污染物削减量小,区域性污染特征明显,特别是磷污染一直未彻底解决[16-17].
本研究通过相关性分析、聚类分析、多元回归分析等多元统计方法,基于“十二五”和“十三五”(2011—2020 年)10年典农河流域磷在水—泥不同介质中变化特征,试图探究典农河水质磷污染现状及变化特征,识别水体污染驱动因子,探究水质差异及影响因素,以期为典农河水质稳定改善及流域监管提供参考,同时也为西北干旱地区排水沟污染研究提供技术方案.
-
典农河为宁夏重要的入黄排水沟之一,由银川市永宁县新桥滞洪区发源,经石嘴山市惠农区园艺镇石嘴子公园流入黄河,全长180.5 km. 流经永宁县、兴庆区、金凤区、贺兰县、平罗县、惠农区等6县(区),沿途汇入第二排水沟、平二支沟、方家圈沟、三二支沟、第三排水沟等10条沟道,承接银西防洪6个拦洪库2个滞洪区来水,连接七子连湖、华雁湖、西湖、阅海、北塔湖、沙湖等湖泊湿地,水域面积约46.7 km2,径流量10.3—120 m3·s−1,平均水深约0.6 m,多年平均流量5.1 m3·s−1,年径流量约为1.6亿m3. 流经区域为半干旱荒漠地区,温带大陆性气候,流域年降雨量约200 mm,蒸发量约1800 mm.
-
根据典农河流经区域、排污口分布及周边生态环境分布现状,本次采样共设10个点位,涵盖典农河整个水域(图1). 各监测点位水质采样时间为2020年,水质样品每月监测1次,按照《地表水环境质量标准》(GB 3838—2002),分别对总磷(钼锑抗分光光度法),总氮(过硫酸钾氧化紫外化分光光度法),化学需氧量(重铬酸钾氧化法),氨氮(钼酸铵分光光度法)进行检测. 沉积物采样时间为2021年3月,沉积物中磷的形态分析采用淡水沉积物中磷形态连续提取的SMT法[18],该法将沉积磷分为5种形态,即NaOH-P(主要是吸附在沉积物表面的AL、Fe、Mn氧化物和水化物结合的磷)、HCl-P(主要是与Ca结合的磷)、无机磷(IP)、有机磷(OP)和总磷(TP). 按照《地表水环境质量标准》(GB3838—2002)Ⅳ 类标准限值进行单因子水质评价;历史数据来源于石嘴山市环境质量公报.
-
表层沉积物样品中TP、OP和NaOH-P的含量通过标准测试程序(SMT)法得到;最大吸附量通过25 ℃下的等温吸附实验得到;PSI通过25 ℃下100 g表层沉积物样品在75 μg·mL−1的KH2PO4溶液中振荡24 h后得到;ERI可通过式(1)至式(3)或式(4)、式(5)计算得到[19].
式中,P为磷吸附指数(phosphorus adsorption index,PSI),反映表层沉积物对磷缓冲能力的参数,其值越大沉积物通过吸附磷而降低水体中磷负荷的效果越明显[20];X为振荡结束后沉积物的磷吸附量,mg·kg−1;C为振荡结束后溶液中磷摩尔浓度,μmol·L−1;D为磷吸附饱和度(phosphorus adsorption saturation,DPS),反映沉积物对磷的吸附能力,随着DPS的升高,沉积物中可用于吸附磷的活性位点减少,磷释放风险增大[21];ωNaOH-P为表层沉积物中NaOH-P,mg·kg−1;Qm为根据Langumir模型拟合得到的最大吸附量,μg·g−1;E为磷释放风险指数(release risk index,ERI),ERI<10%为较低磷释放风险,10%≤ERI<20%为中度磷释放风险;20%≤ERI<25%,较高磷释放风险;ERI≥25%,高度磷释放风险[22];S为沉积物中磷饱和度(phosphorus saturation in sediment,SPS),其以TP含量和Langumir模型拟合得到的最大吸附量计算水生生态系统表层的沉积物磷饱和度[23],%;ωde为表层沉积物中TP,mg·kg−1.
-
本研究严格按照《环境水质监测质量保证手册(第二版)》的要求,开展实验样品、保存、分析和数据处理,确保监测数据准确、可信. 监测项目均按照国家标准方法进行检测,所有监测仪器均经过计量部门有效检定. 同时采用平行样分析、加标回收分析、质控样对比分析等实验室内质量控制措施进行质量控制.
-
本文数据分析和处理主要采用Excel表格和SPSS 16.0 软件,数据制图主要使用Origin 2017软件.
-
根据2011年—2020年各监测断面年均监测浓度(表1)分析,典农河流域10个监测点位水质监测磷浓度变化范围为0.09—1.91 mg·L−1,标准偏差达到0.03—1.00 mg·L−1,10个监测点位多年浓度变化趋势是Site-7>Site-8>Site-4> Site-10>Site-1=Site-5>Site-6>Site-9>Site-3>Site-2,其中Site-7和Site-8多年来总磷一直处于较高污水水平,是其他监测点位的2—3倍,直接影响到了整个典农河流域磷的整体水平,同时该两个点位标准偏差分别达到1.0和0.29,说明该区域磷波动性较大,这与点位上游临近污染源存在较大关系.
同时,结合典农河流域水系特征、污染源分布(W1—W8)和污染浓度变化情况,将流域分为Section A、Section B、Section C、Section D 的4个污染控制单元区,其中Section A为典农河支流,Section B为典农河上游,Section C为典农河中游,Section D为典农河末端,污染区域的划分有助于后期流域污染溯源分析和精准管控,便于后期“流域—控制区—控制单元”三级分区体系的建立[24]. 近10年监测数据呈现出整体性的类似正态分布(图2),这与“十三五”期间生态环境保护监管和治理成效有关[25].
-
2020年典农河水体总磷ρ(TP)表现为季节性变化(表2),即:夏季(0.29 mg·L−1)>冬季(0.19 mg·L−1)>秋季(0.18 mg·L−1)=春季(0.18 mg·L−1),夏季典农河流域总磷排放浓度是其他季节的1.5倍左右,其他季节流域总磷浓度整体保持稳定,这说明夏季总磷空间分布极不均匀,这与夏季水温升高水体底泥磷释放和夏季流域农田灌溉有一定影响. 全年累计统计的120组监测数据中,其中 Ⅰ—Ⅲ 类比例为70%,劣V类比例为10%,监测点位全年劣V类总磷出现频次最高的为 Site-5和Site-8. 同时,流域区域性磷污染特征较为明显(图3),各监测点位年度标准偏差达到0.04—0.4 mg·L−1,区域性污染程度 Section B > Section C > Section A> Section D,监测点位污染程度Site-5>Site-8>Site-6=Site-7>Site-4>Site-1=Site-10>Site-2>Site-3>Site-9,其中污染较重的Site-5超标率达到58%,Site-8超标率达到42%,Site-6超标率达到17%. 按照区域分析,Section B区域污染最重,这可能和污染源分布有关.
-
为研究沉积物与表层水中总磷迁移转化规律,同步监测表层水中总磷和沉积物孔隙水中总磷浓度(图4). 典农河流域表层水整体为Ⅳ类水质,ρ(TP)浓度范围为0.091—0.528 mg·L−1,标准偏差达到0.135 mg·L−1,其中Ⅰ—Ⅲ类比例为50%,劣V类比例为10%,监测点位全年劣V类总磷出现频次最高达到Site-5. 孔隙水整体为劣V类水质,ρ(TP)浓度范围为0.246—0.981 mg·L−1,劣V类比例达到80%. 表层水和沉积物孔隙水中磷存在显著相关性,Y表层水=0.622X孔隙水–0.1097 (r=0.8541),因不同颗粒组分形成的河床基底,磷的吸附和释放特征大不相同,其中孔隙水是沉积物向表层水扩散的主要通道,同时还存在污染物输入量的叠加作用,最终导致表层水和沉积物孔隙水中污染浓度变化既存在较强关系也存在一定差异. 分析主要原因是典农河为浅水河流,加之沉积物中磷主要以无机磷形式存在,水位波动、沉积物再悬浮和流速或流量变化引起的冲刷作用,将提高河流沉积物中总磷的释放速率[26].
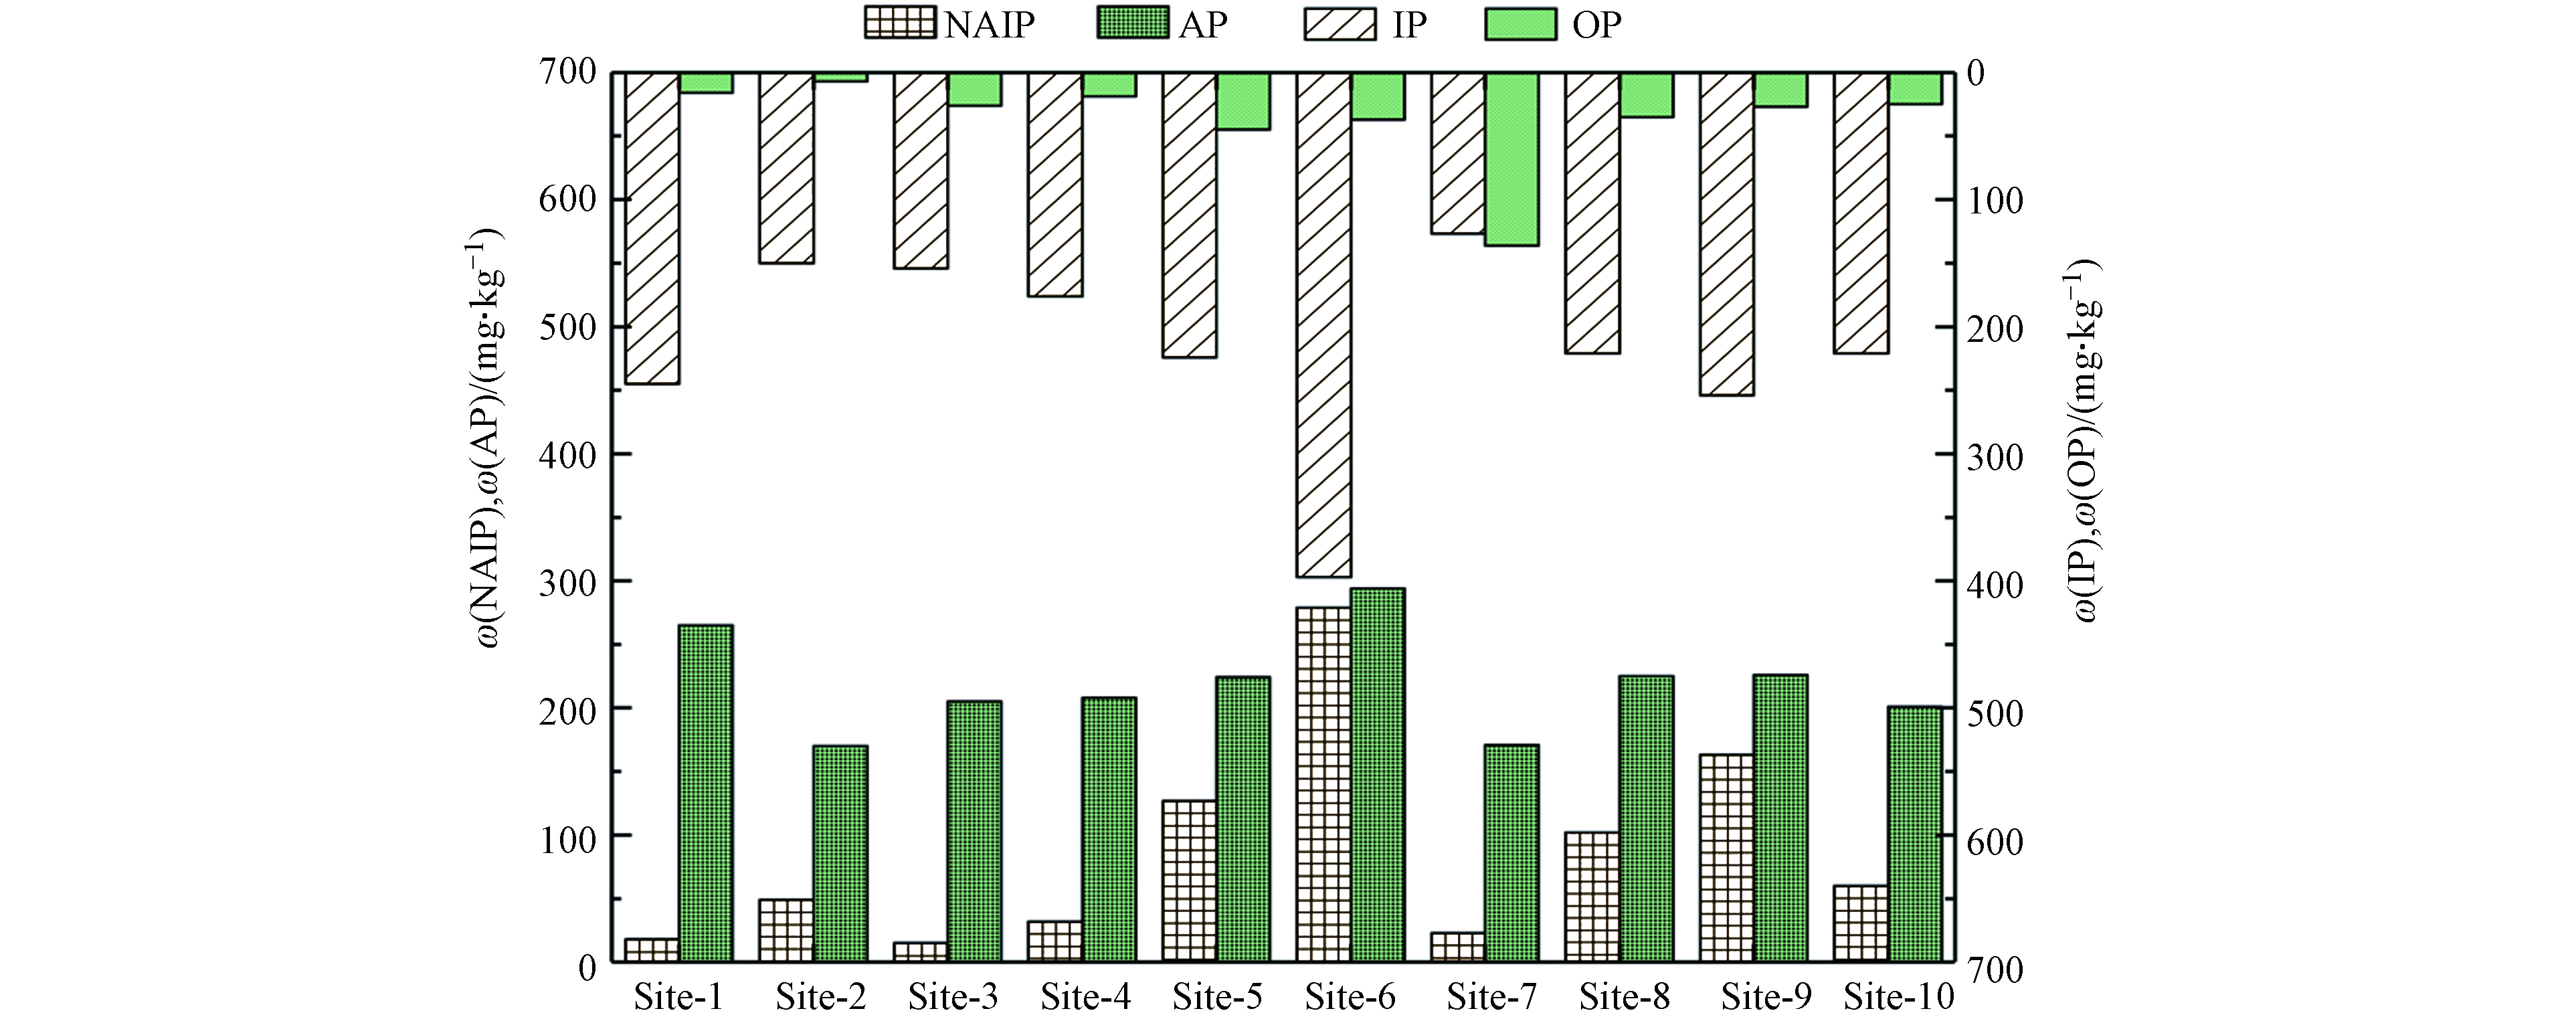
相比国内部分河湖表层沉积物中磷赋存形态[19],OP和NAIP在典农河表层沉积物中含量相对较低,AP和IP相对较高. 沉积物中非磷灰石态无机磷(NAIP)和沉积物中有机磷(OP)普遍较低,浓度范围分别为15—297 mg·kg−1和7—136 mg·kg−1,标准偏差分别达到80 mg·kg−1和34 mg·kg−1(图5).
-
采用二元定距变量的相关性(Pearson 相关系数),对不同介质中不同形态磷关联性进行分析(表3),同时通过线性回归进行定量分析,从而解释出各个监测断面相应污染物之间的相关特征[27]. 分析结果表明,典农河流域表层水中ρ(TP)浓度随孔隙水中总磷浓度的升高而升高 (r=0.924,P<0.01). 沉积物中ω(AP)与ω(NAIP)存在一定的正相关性(r=0.658,P<0.05),YAP=0.3XNAIP+193;沉积物中ω(IP)与ω(NAIP)存在较强的正相关性( r=0.875,P<0.01),YIP=0.797XNAIP+148;沉积物中ω(IP)与ω(AP)存在较强的正相关性( r=0.907,P<0.01),沉积物中ω(TP)与ω(NAIP)相关性达到0.862(P<0.01),线性方程YTP=1.017XNAIP+200. 沉积物中ω(TP)与ω(AP)相关性达到0.791(P<0.01),线性方程YTP=2.052XAP–161;沉积物中ω(TP)与ω(IP)相关性达到0.901(P<0.01),线性方程YTP=1.167XIP+35.
-
主成分分析有利于将多个污染变量压缩到极少数的污染变量,该方法主要应用到水体污染源解析中[28]. 经KMO(Kaiser-Meyer-Olkin)和Bartlett球体检验,本次分析KMO检验系数>0.5,Bartlett球体检验的统计值显著性概率P <0.05,符合因子分析要求. 结合数据综合统计和相关性分析,最终通过主成分分析揭示典农河流域不同介质中总磷的来源及迁移趋势(图6). 从表4可以知,典农河流域不同水体介质中共提取出2个主成分,揭示出83%的磷污染来源,分别解释了总因子的59%和23%,沉积物中无机磷ω(NAIP)、ω(IP)、ω(AP)和ω(TP)来源于统一污染源,沉积物中ω(OP)来源于另一污染源.
-
典农河流域各采样点DPS风险范围为13%—65%,平均值为35%(表5). ERI风险范围为23%—103%,平均值为45%,其中Site-1风险水平达到103%,主要原因该断面上游为工业园区污水处理厂W1,污染物排放不稳定. 国内研究提出[29],当沉积物中DPS>25%时,沉积物中磷的释放能力处于显著水平,本研究区域整体状况已超过该阈值,故应严格控制磷的污染输入. 典农河表层沉积物PSI计算值较小,说明沉积物中磷缓冲能力较大,从而增加了磷的释放风险;DPS 平均值相对偏高,说明大部分监测点位表层沉积物对磷的吸附能力差﹐磷的释放风险较高[30]. 典农河流域与我国不同水体表层沉积物TP和SPS存在明显差异(表6),该流域沉积物中ω(TP)相对污染水平较低,最大吸附量Qm和磷释放风险SPS相比黄河甘宁蒙段整体偏高,当先比全国其他水体整体偏低,分析原因典农河作为西北地区浅水河道,基流小、水位浅,沉积物很容易被氧化,加之区域性泥沙含量较高,沉积物对磷的吸附作用弱,释放作用强.
-
典农河流域基于最大吸附量和SPS的磷释放风险评估结果见表7. SPS变化范围为51%—76%,平均值为59%,典农河流域各点位之间SPS的差异较小,相对国内相关河流[31],典农河表层沉积物的对总磷的最大吸附量偏小,而计算结果SPS较高,说明典农河表层沉积物对水体磷的吸附能力较差.
-
(1)典农河流域水体总磷ρ(TP)呈现明显的季节性和区域性,时空污染特征较为明显,水体总磷污染物浓度由高到低夏季>冬季>秋季=春季,区域性污染程度 Section B > Section A > Section D> Section C,监测点位污染程度Site-5>Site-8>Site-6 = Site-7>Site-4>Site-1=Site-10> Site-2>Site-3> Site-9. 同时,历史值显示该流域水体总磷呈现低—高—低波动性变化.
(2)典农河流域不同水体介质表层水和空隙水中总磷变化特征较为明显,其中表层水整体为Ⅳ类水质,ρ(TP)浓度范围为0.091—0.528 mg·L−1,标准偏差达到0.135 mg·L−1,Ⅰ—Ⅲ类比例为50%,劣V类比例仅为10%;孔隙水整体为劣V类水质,ρ(TP)浓度范围为0.246—0.981 mg·L−1,劣V类比例达到80%. 表层水和沉积物孔隙水中磷存在显著相关性,Y表层水=0.622X孔隙水–0.1097 (r=0.8541,P<0.01).
(3)与国内其他河湖沉积物中磷的赋存形态含量相比较,典农河表层沉积物所含OP和NAIP浓度偏低,AP和IP相对较高,不同磷形态之间存在相互迁移转化特征. 典农河流域不同水体介质中共提取的2组主成分,揭示出流域83%的磷污染来源,分别解释了总因子的59%和23%,沉积物中无机磷ω(NAIP)、ω(IP)、ω(AP)和ω(TP)来源于同一污染源,沉积物中ω(OP)来源于另一污染源.
(4)典农河流域各采样点DPS风险范围为13%—65%, ERI风险范围为23%—103%,SPS变化范围为51%—76%,典农河流域各点位之间SPS的差异较小. 无论是基于PSI和DPS的磷释放风险评估还是基于最大吸附量和SPS的磷释放风险评估统计,均显示该区已处于磷污染风险区域,后期需要加强源头管控,减少磷污染物排放,在部分时节要做好流域深度控源.
宁夏典农河磷污染特征探究
Study on phosphorus pollution characteristics of Dianong River in Ningxia
-
摘要: 在西北高寒、高旱、高碱水体不同介质中,磷元素的迁移转化和污染释放对流域水生态环境质量影响较大. 为揭示典农河流域磷污染水平和迁移转化规律,本次研究对典农河重点区域的表层水、孔隙水和沉积物中TP 开展监测分析,同时调查流域历史磷变化. 结果表明,2011—2020年,典农河流域10个监测点位水质监测磷浓度变化范围为0.09—1.91 mg·L−1,标准偏差达到0.03—1.00 mg·L−1. 2020年典农河水体总磷 ρ(TP)呈明显的季节性变化,从平均值来看,夏季(0.29 mg·L−1)>冬季(0.19 mg·L−1)>秋季(0.18 mg·L−1)=春季(0.18 mg·L−1),总磷环境质量月度污染水平Ⅰ—Ⅲ 类比例为70%,劣V类比例为10%,而本次研究的沉积物表层水整体为Ⅳ类水质,ρ(TP)浓度范围为0.091—0.528 mg·L−1,标准偏差达到0.135 mg·L−1,其中 Ⅰ—Ⅲ类比例为50%,劣V类比例为10%,沉积物孔隙水整体为劣V类水质,ρ(TP)浓度范围为0.246—0.981 mg·L−1,劣V类比例达到80%. 表层水和沉积物孔隙水 Y表层水=0.622X孔隙水–0.1097 (r=0.8541),与国内现有研究结果相比,典农河表层沉积物中不同形态的磷OP和NAIP相对偏低,AP和IP相对较高,ω(AP)与ω(NAIP)、ω(IP)与ω(NAIP)、ω(IP)与ω(AP)、ω(TP)与ω(NAIP)、ω(TP)与ω(AP)、ω(TP)与ω(IP)均存在较强的正相关性. 无论是基于磷吸附指数(PSI)和磷吸附饱和度(DPS)的磷释放风险评估,还是基于最大吸附量和沉积物中磷饱和度(SPS)的磷释放风险评估,均显示该区已处于磷污染风险区域,后期需要加强源头管控,减少磷污染物排放.Abstract: In the high-cold, high-drought and high-alkali water bodies in northwest China, the migration and transformation of phosphorus and the release of pollutants both had a special impact on the quality of water ecological environment. To reveal the migration and transformation of phosphorus, the historical phosphorus changes were analyzed and the TP concentrations in the overlying water, interstitial water, and sediments of the entire lake in the Diannong River were studied. Results showed that the concentrations of phosphorus of the 10 monitoring points ranged from 0.09 mg·L−1 to 1.91 mg·L−1 from 2011 to 2020, with the standard deviation of 0.03—1.00 mg·L−1. In 2020, the average total phosphorus ρ (TP) showed obvious seasonal changes of “summer (0.29 mg·L−1)> winter (0.19 mg·L−1)> autumn (0.18 mg·L−1)=spring (0.18 mg·L−1)”. Compared with GB 3838—2002, 70% of the concentration of total phosphorus showed Class Ⅰ—Ⅲ, and 10% of the concentration of total phosphorus showed inferior Class Ⅴ. In addition, the overall surface water showed Class Ⅳ, and the ρ(TP) concentration ranged from 0.091 mg·L−1 to 0.528 mg·L−1 with the standard deviation of 0.135 mg·L−1. Among them, the proportion of ρ (TP) of the overlying water showing class Ⅰ—Ⅲ and inferior class Ⅴ reached 50% and 10%, respectively. The ρ(TP) of the overall sediment pore was 0.246—0.981 mg·L−1, showing a proportion of 80% of inferior class Ⅴ water quality. Further, the relationship between the surface water and sediment pore water showed high with YSurface water=0.622Xpore water–0.1097 (r=0.8541). Compared with the morphological phosphorus in the surface sediments of some domestic rivers and lakes, the OP and NAIP are relatively low and AP and IP are relatively high. There are strong positive correlations between ω(AP) and ω(NAIP), ω(IP) and ω(NAIP), ω(IP) and ω (AP), ω (TP) ω(NAIP), ω(TP) and ω(AP), and ω(TP) and ω(IP), respectively. Weather based on the PSI and DPS or the maximum adsorption capacity and SPS, the phosphorus release risk assessment statistics all showed the phosphorus pollution posing a risk to the water quality of Diannong River. To reduce the emission of phosphorus pollutants, the source control is urgently needed.
-
Key words:
- phosphorus /
- sediments /
- morphological analysis /
- risk assessment /
- Ningxia
-

-
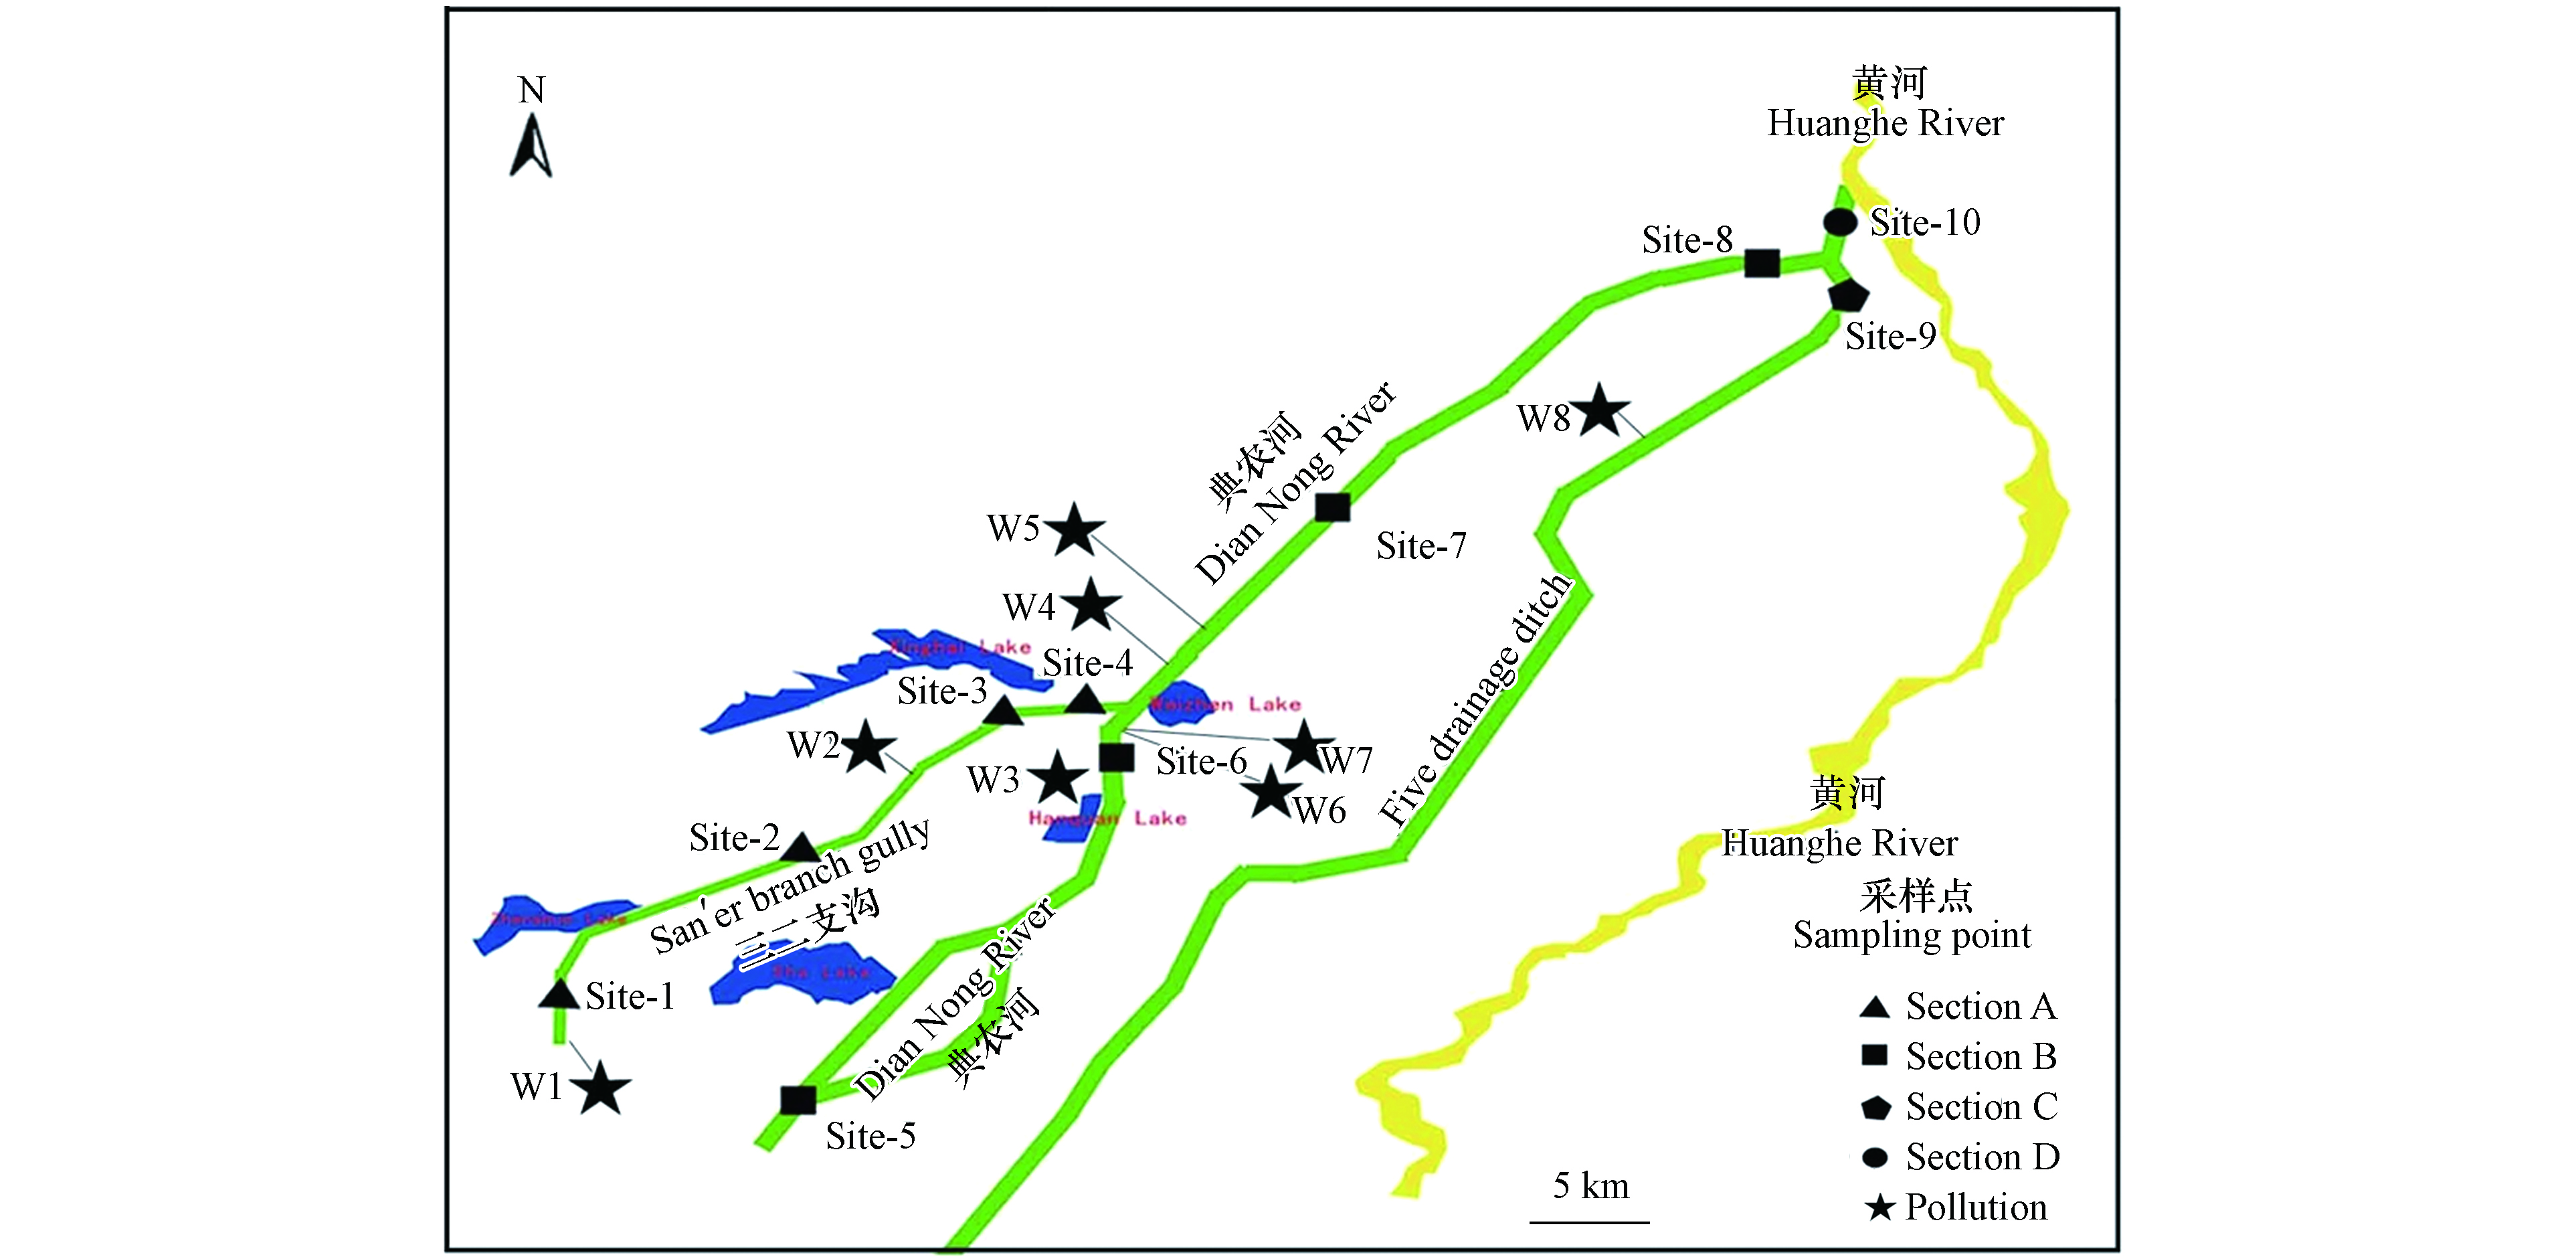
图 1 典农河监测点位布置图
Figure 1. The layout of the monitoring points of the third drainage ditch.
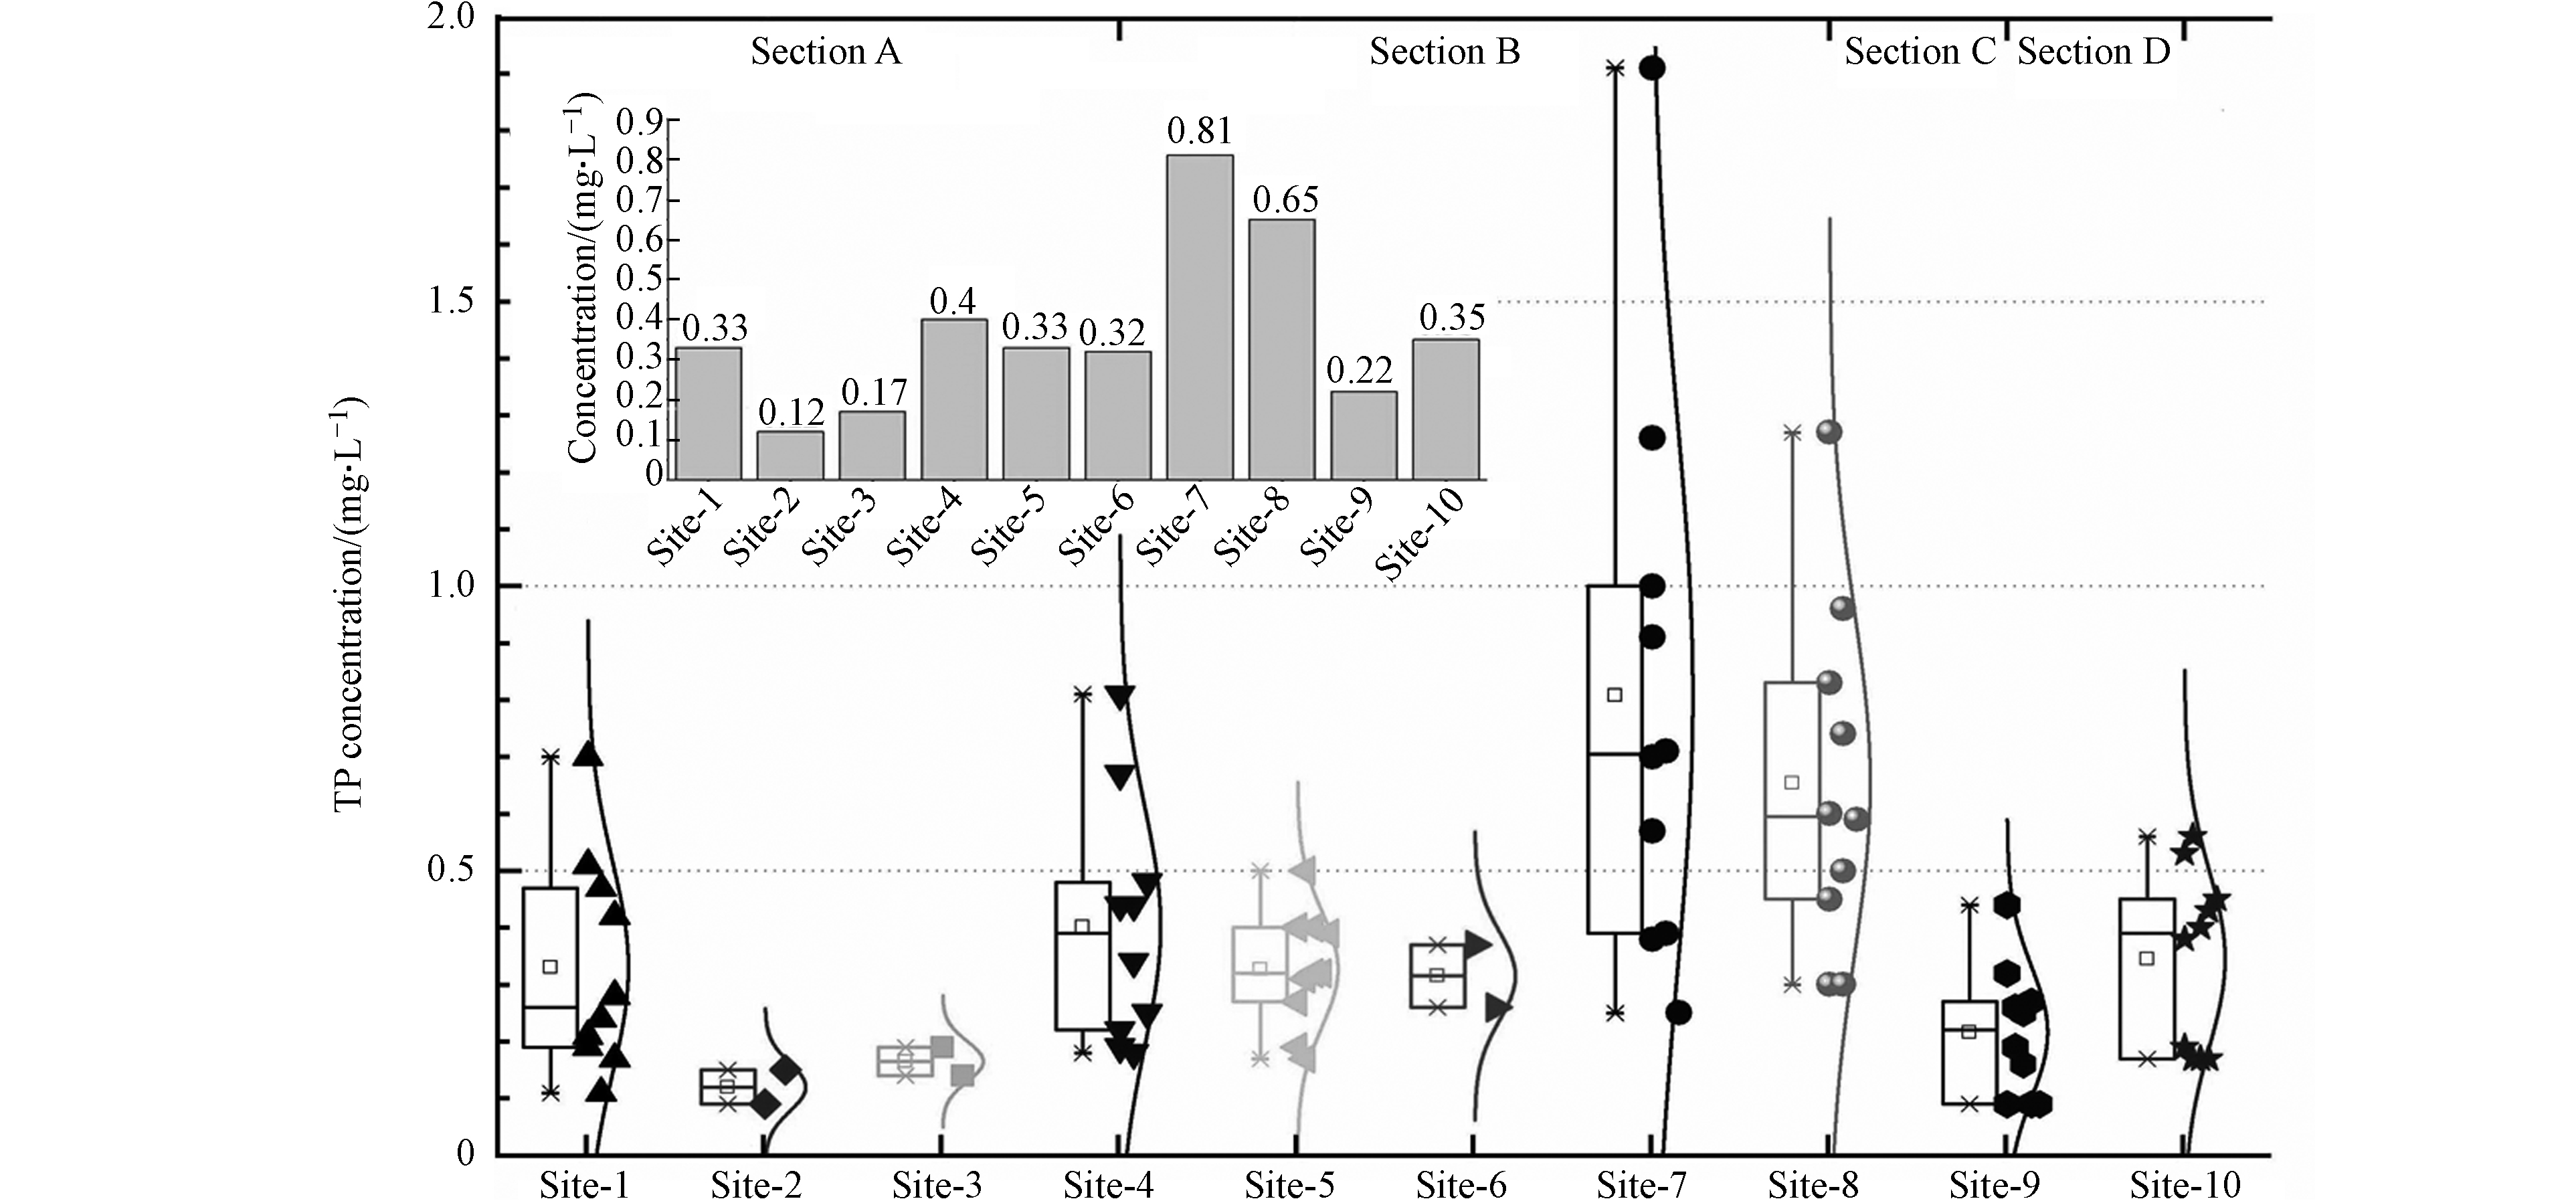
图 2 典农河流域各监测点位年度变化
Figure 2. Box-and-whisker plot of annual changes of monitoring sites in the Diannong River Basin
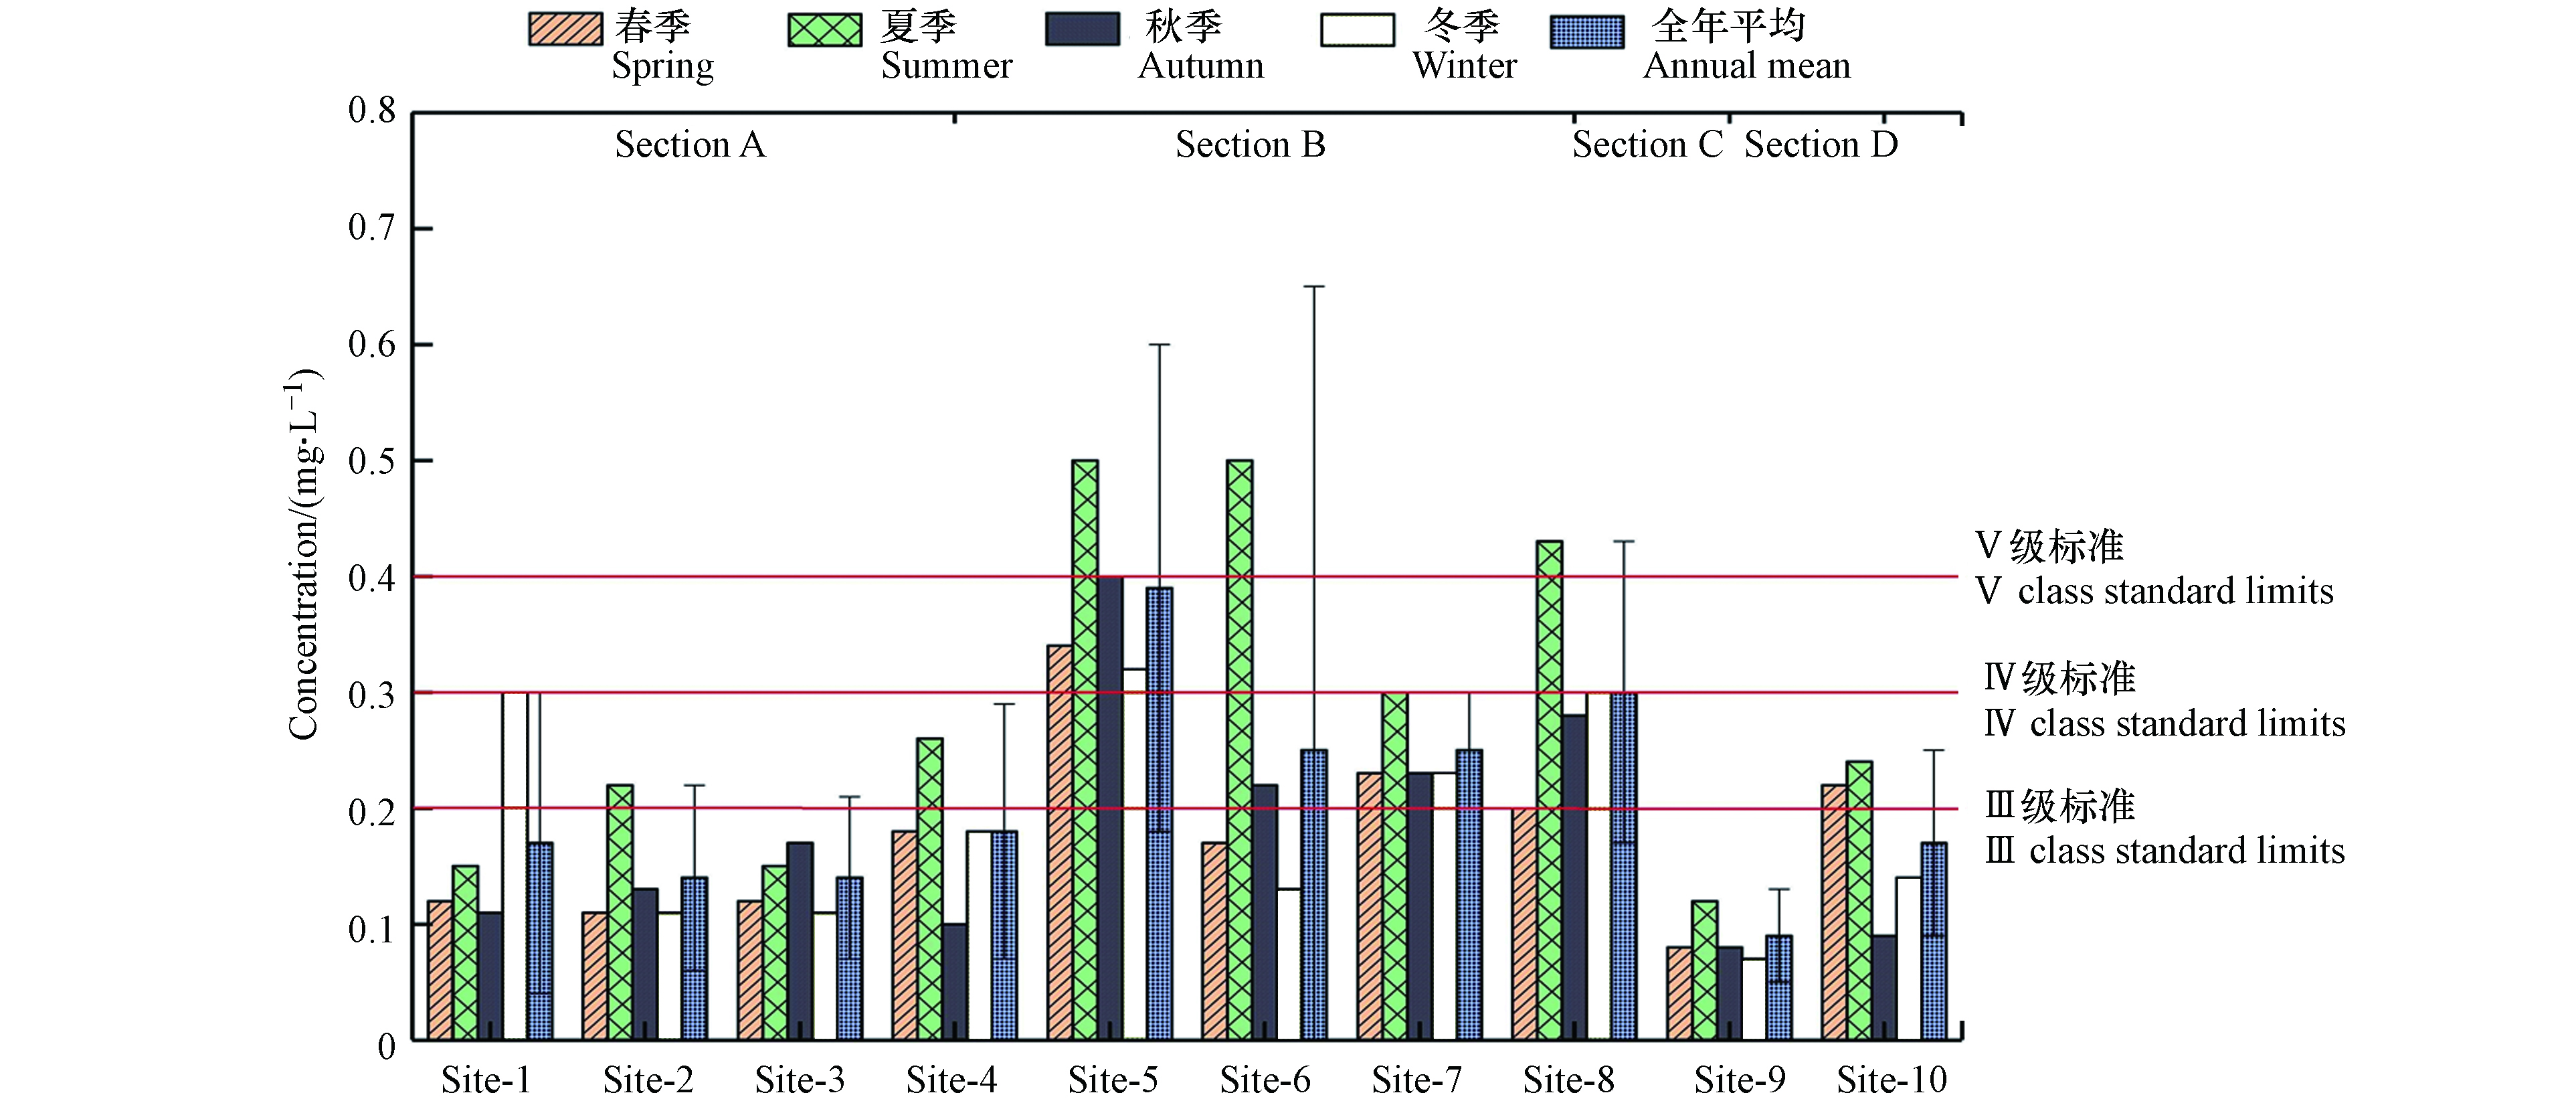
图 3 典农河流域总磷季节性变化趋势
Figure 3. Seasonal trends of total phosphorus in the Diannong River Basin
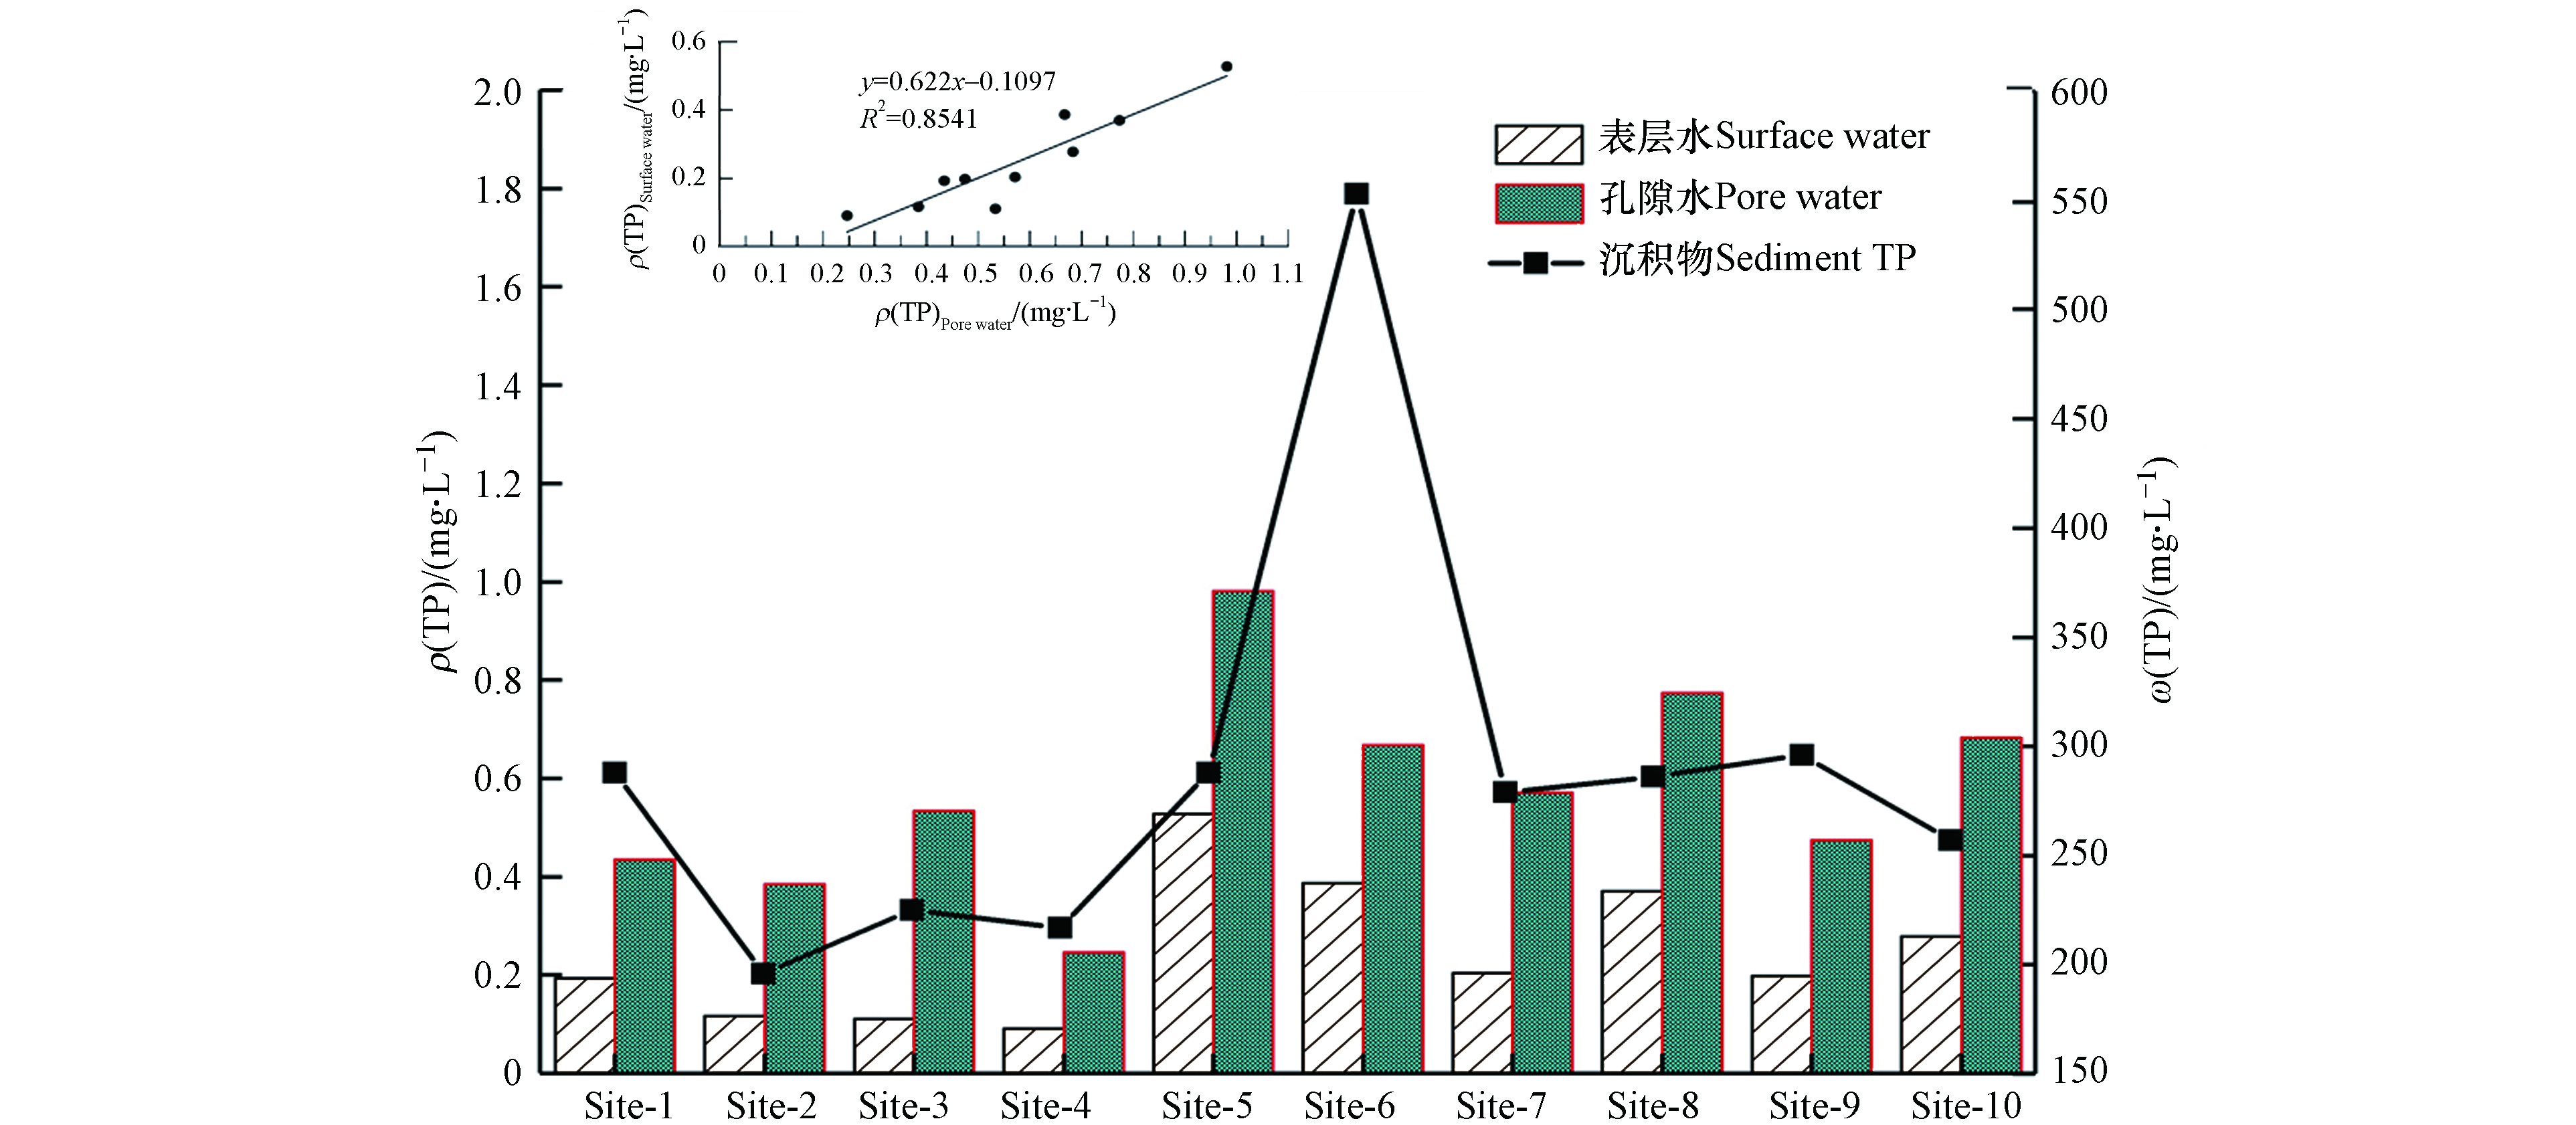
图 4 流域水体不同介质中磷变化图
Figure 4. Changes of phosphorus in different media in the basin water
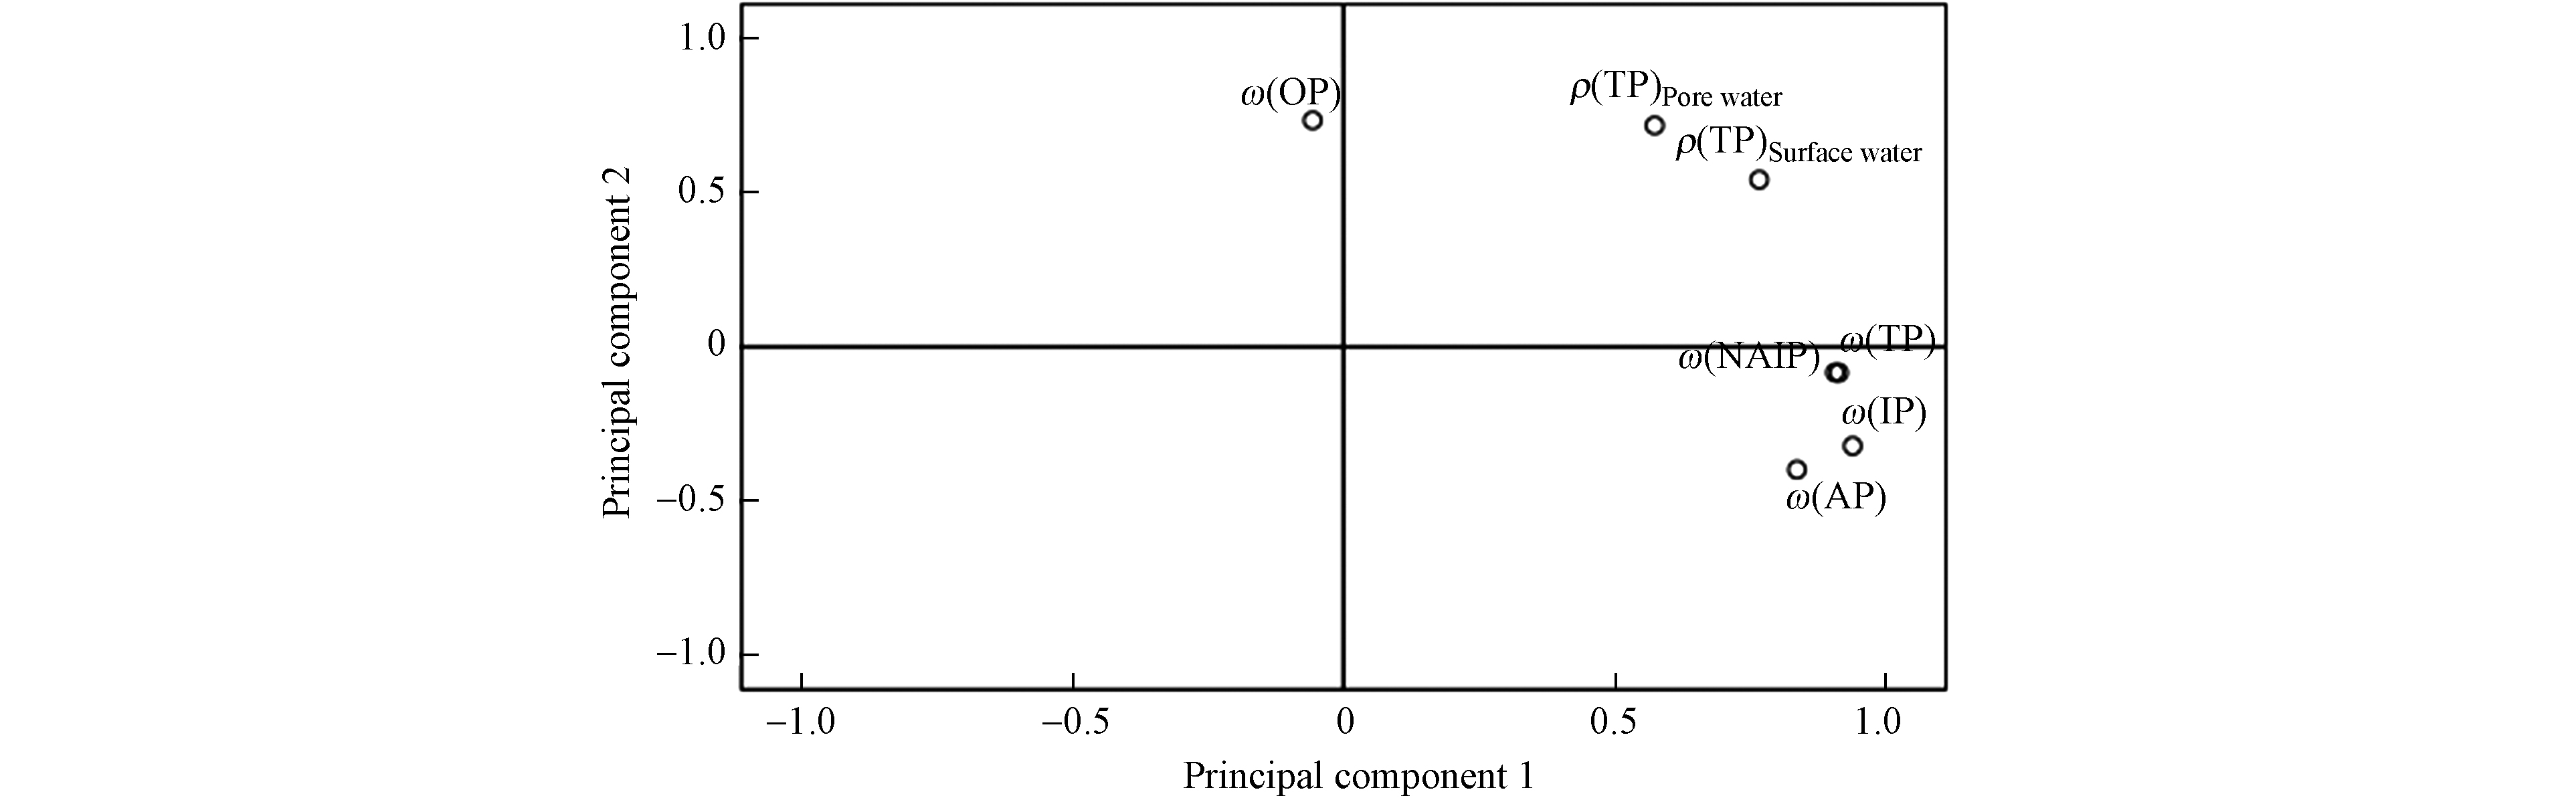
图 6 不同介质中磷主成分载荷图
Figure 6. Loading diagram of phosphorus principal component in different media
表 1 典农河流域历年磷污染水平统计表(mg·L−1)
Table 1. Statistics of phosphorus pollution levels in the Diannong River Basin over the years (mg·L−1)
Site-1 Site-2 Site-3 Site-4 Site-5 Site-6 Site-7 Site-8 Site-9 Site-10 2011年 0.21 — — 0.22 0.27 — 0.91 0.83 0.32 0.53 2012年 0.19 — — 0.34 0.19 — 0.38 0.45 0.26 0.19 2013年 0.51 — — 0.67 0.40 — 1.26 0.96 0.44 0.56 2014年 0.47 — — 0.44 0.31 — 1.91 1.27 0.25 0.17 2015年 0.24 — — 0.25 0.17 — 0.57 0.50 0.27 0.40 2016年 0.70 — — 0.44 0.50 — 1.00 0.59 0.09 0.43 2017年 0.28 — — 0.48 0.40 — 0.70 0.60 0.19 0.45 2018年 0.42 — — 0.81 0.32 — 0.71 0.74 0.16 0.38 2019年 0.11 0.09 0.19 0.19 0.32 0.37 0.39 0.30 0.09 0.17 2020年 0.17 0.15 0.14 0.18 0.39 0.26 0.25 0.30 0.09 0.17 最小值 0.11 0.09 0.14 0.18 0.17 0.26 0.25 0.3 0.09 0.17 最大值 0.7 0.15 0.19 0.81 0.5 0.37 1.91 1.27 0.44 0.56 标准偏差 0.18 0.03 0.03 0.20 0.10 0.06 1.00 0.29 0.11 0.15 年均值 0.33 0.12 0.17 0.40 0.33 0.32 0.81 0.65 0.22 0.35 备注:Site-2、Site-3、Site-6为新增监测点位,自2019年开始监测.
Remarks: Site-2, Site-3, and Site-6 are newly added monitoring points, which have been monitored since 2019. 下载: 导出CSV
表 2 典农河流域水体总磷统计表(mg·L−1)
Table 2. Statistical table of total phosphorus in the water body of Diannong River Basin (mg·L−1)
Site-1 Site-2 Site-3 Site-4 Site-5 Site-6 Site-7 Site-8 Site-9 Site-10 最小值
Min最大值
Max年均值
Average1月 0.09 0.08 0.1 0.3 0.14 0.12 0.19 0.2 0.05 0.24 0.05 0.3 0.15 2月 0.09 0.11 0.14 0.16 0.14 0.12 0.26 0.24 0.08 0.20 0.08 0.26 0.15 3月 0.18 0.13 0.11 0.08 0.73 0.28 0.24 0.17 0.12 0.23 0.08 0.73 0.23 春季 0.12 0.11 0.12 0.18 0.34 0.17 0.23 0.20 0.08 0.22 0.07 0.43 0.18 4月 0.23 0.08 0.07 0.45 0.65 0.88 0.29 0.36 0.21 0.29 0.07 0.88 0.35 5月 0.09 0.3 0.12 0.24 0.28 0.39 0.35 0.37 0.09 0.13 0.09 0.39 0.24 6月 0.13 0.27 0.26 0.08 0.56 0.23 0.27 0.56 0.07 0.3 0.07 0.56 0.27 夏季 0.15 0.22 0.15 0.26 0.50 0.50 0.30 0.43 0.12 0.24 0.08 0.61 0.29 7月 0.13 0.25 0.29 0.07 0.48 0.17 0.29 0.24 0.08 0.12 0.07 0.48 0.21 8月 0.10 0.06 0.12 0.12 0.56 0.23 0.23 0.39 0.11 0.09 0.06 0.56 0.20 9月 0.10 0.08 0.1 0.11 0.16 0.27 0.17 0.2 0.06 0.07 0.06 0.27 0.13 秋季 0.11 0.13 0.17 0.10 0.40 0.22 0.23 0.28 0.08 0.09 0.06 0.44 0.18 10月 0.26 0.11 0.14 0.16 0.38 0.14 0.19 0.22 0.06 0.07 0.06 0.38 0.17 11月 0.56 0.13 0.11 0.19 0.47 0.12 0.29 0.54 0.09 0.14 0.09 0.56 0.26 12月 0.07 0.08 0.07 0.19 0.12 0.13 0.2 0.14 0.05 0.2 0.05 0.2 0.13 冬季 0.30 0.11 0.11 0.18 0.32 0.13 0.23 0.30 0.07 0.14 0.07 0.38 0.19 超标率/% 8.3 8.3 0 8.3 58 17 8.3 42 0 0 — — — 最小值 0.07 0.06 0.07 0.07 0.12 0.12 0.17 0.14 0.05 0.07 0.05 0.2 0.13 最大值 0.56 0.3 0.29 0.45 0.73 0.88 0.35 0.56 0.21 0.3 0.09 0.88 0.35 标准偏差 0.13 0.08 0.07 0.11 0.21 0.40 0.05 0.13 0.04 0.08 0.01 0.20 0.06 年均值 0.17 0.14 0.14 0.18 0.39 0.25 0.25 0.30 0.09 0.17 0.07 0.46 0.21
下载: 导出CSV
表 3 典农河流域水体和沉积物中不同形态磷的相关性分析
Table 3. Correlation analysis of different forms of phosphorus in water and sediments in the Diannong River Basin
表层水
Site孔隙水
Surface waterNAIP AP IP OP TP 表层水 1 0.924** 0.606 0.435 0.531 0.155 0.532 孔隙水 0.924** 1 0.405 0.203 0.290 0.250 0.336 NAIP 0.606 0.405 1 0.658* 0.875** −0.077 0.862** AP 0.435 0.203 0.658* 1 0.907** −0.297 0.791** IP 0.531 0.290 0.875** 0.907** 1 −0.256 0.901** OP 0.155 0.250 −0.077 −0.297 −0.256 1 0.127 TP 0.532 0.336 0.862** 0.791** 0.901** 0.127 1 注:**相关显著水平为0.01(双尾),*相关显著水平为0.05(双尾). Note: ** Significant level of correlation 0.01 (double tail); * Significant level of correlation 0.05 (double tail).
下载: 导出CSV
表 4 主成分特征向量及累计贡献
Table 4. Principal component eigenvectors and cumulative contributions
表层水
Surface water孔隙水
Pore waterNAIP AP IP OP TP 贡献率/%
Contribution累计贡献率/%
Cumulative contribution主成分1 0.766 0.574 0.906 0.836 0.939 –0.057 0.913 59.356 59.356 主成分2 0.542 0.718 –0.083 –0.398 –0.321 0.735 –0.084 23.22 82.576
下载: 导出CSV
表 5 基于PSI和DPS的磷释放风险评价
Table 5. Risk assessment of phosphorus release based on PSI and DPS
采样点位
Sampling sitePSI DPS/% ERI/% Site-1 15 15 103 Site-2 11 29 38 Site-3 6 13 45 Site-4 6 21 29 Site-5 18 48 38 Site-6 32 65 50 Site-7 11 26 42 Site-8 17 38 44 Site-9 13 57 23 Site-10 11 33 34 平均值 14 35 45
下载: 导出CSV
表 6 不同水体表层沉积物中TP、最大吸附量和SPS比较
Table 6. Comparison of TP, maximum adsorption capacity and SPS in surface sediments of different water bodies
下载: 导出CSV
表 7 基于最大吸附量和SPS的磷释放风险评估
Table 7. Risk assessment of phosphorus release based on maximum adsorption and SPS
采样点位
Sampling siteQm/(mg·kg−1) SPS/% ERI/% Site-1 124 70 56 Site-2 168 54 32 Site-3 113 67 59 Site-4 156 58 37 Site-5 265 52 20 Site-6 432 56 13 Site-7 87 76 87 Site-8 265 52 20 Site-9 285 51 18 Site-10 184 58 32 平均值 208 59 37
下载: 导出CSV
-
[1] SØNDERGAARD M, JENSEN J P, JEPPESEN E. Internal phosphorus loading in shallow Danish lakes//Shallow Lakes’98[M]. Dordrecht: Springer Netherlands, 1999: 145-152. [2] 黄清辉, 王东红, 王春霞, 等. 沉积物中磷形态与湖泊富营养化的关系 [J]. 中国环境科学, 2003, 23(6): 583-586. HUANG Q H, WANG D H, WANG C X, et al. Relation between phosphorus forms in the sediments and lake eutrophication [J]. China Environmental Science, 2003, 23(6): 583-586(in Chinese).
[3] 朱广伟, 高光, 秦伯强, 等. 浅水湖泊沉积物中磷的地球化学特征 [J]. 水科学进展, 2003, 14(6): 714-719. ZHU G W, GAO G, QIN B Q, et al. Geochemical characteristics of phosphorus in sediments of a large shallow lake [J]. Advances in Water Science, 2003, 14(6): 714-719(in Chinese).
[4] SCHINDLER D W. Evolution of phosphorus limitation in lakes [J]. Science, 1977, 195(4275): 260-262. doi: 10.1126/science.195.4275.260 [5] 刘辉, 胡林娜, 朱梦圆, 等. 沉积物有效态磷对湖库富营养化的指示及适用性 [J]. 环境科学, 2019, 40(9): 4023-4032. LIU H, HU L N, ZHU M Y, et al. Applicability of bioavailable phosphorus in sediments to indicating trophic levels of lakes and reservoirs [J]. Environmental Science, 2019, 40(9): 4023-4032(in Chinese).
[6] 王子为, 钱昶, 张成波, 等. 伊逊河流域总磷污染来源解析 [J]. 环境科学研究, 2020, 33(10): 2290-2297. WANG Z W, QIAN C, ZHANG C B, et al. Source apportionment of total phosphorus pollution in yixun river basin [J]. Research of Environmental Sciences, 2020, 33(10): 2290-2297(in Chinese).
[7] 吴丰昌, 万国江. 泸沽湖沉积物-水界面扩散作用对上覆水体基本化学组成的影响 [J]. 环境科学, 1996, 17(1): 10-12. WU F C, WAN G J. The influence of diffusive processes on overlying waters at the sediment-water interface of lake Lugu [J]. Environmental Science, 1996, 17(1): 10-12(in Chinese).
[8] 金晓丹, 吴昊, 陈志明, 等. 长江河口水库沉积物磷形态、吸附和释放特性 [J]. 环境科学, 2015, 36(2): 448-456. JIN X D, WU H, CHEN Z M, et al. Phosphorus fractions, sorption characteristics and its release in the sediments of Yangtze Estuary reservoir, China [J]. Environmental Science, 2015, 36(2): 448-456(in Chinese).
[9] 龚春生, 范成新. 不同溶解氧水平下湖泊底泥-水界面磷交换影响因素分析 [J]. 湖泊科学, 2010, 22(3): 430-436. GONG C S, FAN C X. Effect factors analysis of phosphorus exchange across lake sediment-water interface under different dissolved oxygen concentration [J]. Journal of Lake Sciences, 2010, 22(3): 430-436(in Chinese).
[10] 刘焱见, 李大鹏, 李鑫, 等. 京杭大运河(苏州段)内源磷形态分布及其对扰动的响应 [J]. 环境科学学报, 2018, 38(1): 125-132. LIU Y J, LI D P, LI X, et al. Distribution of internal phosphorus and its response to disturbance in the Beijing-Hangzhou Grand Canal(Suzhou section) [J]. Acta Scientiae Circumstantiae, 2018, 38(1): 125-132(in Chinese).
[11] 王晓蓉, 华兆哲, 徐菱, 等. 环境条件变化对太湖沉积物磷释放的影响 [J]. 环境化学, 1996, 15(1): 15-19. WANG X R, HUA Z Z, XU L, et al. The effects of the environmental conditions on phosphorus release in lake sediments [J]. Environmental Chemistry, 1996, 15(1): 15-19(in Chinese).
[12] XIE L Q, XIE P, TANG H J. Enhancement of dissolved phosphorus release from sediment to lake water by Microcystis blooms—an enclosure experiment in a hyper-eutrophic, subtropical Chinese lake [J]. Environmental Pollution, 2003, 122(3): 391-399. doi: 10.1016/S0269-7491(02)00305-6 [13] 张梦舟, 徐曾和, 梁冰. 三峡库区香溪河流域磷矿废石磷素释放特性研究 [J]. 中国环境科学, 2016, 36(3): 840-848. doi: 10.3969/j.issn.1000-6923.2016.03.029 ZHANG M Z, XU Z H, LIANG B. Phosphorus release from phosphate waste rocks deposited in Xiangxi River watershed of Three Gorges Reservoir [J]. China Environmental Science, 2016, 36(3): 840-848(in Chinese). doi: 10.3969/j.issn.1000-6923.2016.03.029
[14] 曹承进, 秦延文, 郑丙辉, 等. 三峡水库主要入库河流磷营养盐特征及其来源分析 [J]. 环境科学, 2008, 29(2): 2310-2315. doi: 10.3321/j.issn:0250-3301.2008.02.007 CAO C J, QIN Y W, ZHENG B H, et al. Analysis of phosphorus distribution characters and their sources of the major input rivers of Three Gorges reservoir [J]. Environmental Science, 2008, 29(2): 2310-2315(in Chinese). doi: 10.3321/j.issn:0250-3301.2008.02.007
[15] 孙丽梅, 裘钱玲琳, 杨磊, 等. 长三角城郊樟溪流域水体氮磷分布特征及其影响因素 [J]. 生态毒理学报, 2018, 13(4): 30-37. doi: 10.7524/AJE.1673-5897.20180502001 SUN L M, QIU Q, YANG L, et al. Distribution of nitrogen and phosphorus and its influencing factors in zhangxi watershed of a peri-urban area in the Yangtze River Delta [J]. Asian Journal of Ecotoxicology, 2018, 13(4): 30-37(in Chinese). doi: 10.7524/AJE.1673-5897.20180502001
[16] TIAN Y W, HUANG Z L, XIAO W F. Reductions in non-point source pollution through different management practices for an agricultural watershed in the Three Gorges Reservoir Area [J]. Journal of Environmental Sciences, 2010, 22(2): 184-191. doi: 10.1016/S1001-0742(09)60091-7 [17] 杨丽慧, 王少丽, 阮本清, 等. 基于排水沟的宁夏银北灌区农田退水污染演变研究 [J]. 中国生态农业学报, 2015, 23(12): 1580-1587. doi: 10.13930/j.cnki.cjea.150445 YANG L H, WANG S L, RUAN B Q, et al. Evolution of drain-based research of irrigation return flow pollution in Yinbei Irrigation Area [J]. Chinese Journal of Eco-Agriculture, 2015, 23(12): 1580-1587(in Chinese). doi: 10.13930/j.cnki.cjea.150445
[18] RUBAN V, LÓPEZ-SÁNCHEZ J F, PARDO P, et al. Harmonized protocol and certified reference material for the determination of extractable contents of phosphorus in freshwater sediments: A synthesis of recent works [J]. Fresenius' Journal of Analytical Chemistry, 2001, 370(2/3): 224-228. [19] 郭晨辉, 刘利军, 孙晓杰, 等. 黄河甘宁蒙段表层沉积物中磷的释放风险评估 [J]. 环境污染与防治, 2021, 43(4): 486-491. doi: 10.15985/j.cnki.1001-3865.2021.04.016 GUO C H, LIU L J, SUN X J, et al. Risk assessment of phosphorus release from surface sediments in the Gansu, Ningxia and Inner Mongolia sections of the Yellow River [J]. Environmental Pollution & Control, 2021, 43(4): 486-491(in Chinese). doi: 10.15985/j.cnki.1001-3865.2021.04.016
[20] BACHE B W, WILLIAMS E G. A phosphate sorption index for soils [J]. Journal of Soil Science, 1971, 22(3): 289-301. doi: 10.1111/j.1365-2389.1971.tb01617.x [21] van der ZEE S E A T M, FOKKINK L G J, van RIEMSDIJK W H. A new technique for assessment of reversibly adsorbed phosphate [J]. Soil Science Society of America Journal, 1987, 51(3): 599-604. doi: 10.2136/sssaj1987.03615995005100030009x [22] 黄清辉, 王子健, 王东红, 等. 太湖表层沉积物磷的吸附容量及其释放风险评估 [J]. 湖泊科学, 2004, 16(2): 97-104. doi: 10.3321/j.issn:1003-5427.2004.02.001 HUANG Q H, WANG Z J, WANG D H, et al. Phosphorus sorption capacity of the surface sediment in the lake Taihu and risk assessment of phosphorus release [J]. Journal of Lake Science, 2004, 16(2): 97-104(in Chinese). doi: 10.3321/j.issn:1003-5427.2004.02.001
[23] ZHANG W Q, SHAN B Q, LI J, et al. Characteristics, distribution and ecological risk assessment of phosphorus in surface sediments from different ecosystems in Eastern China: A 31P-nuclear magnetic resonance study [J]. Ecological Engineering, 2015, 75: 264-271. doi: 10.1016/j.ecoleng.2014.11.055 [24] 王金南, 吴文俊, 蒋洪强, 等. 中国流域水污染控制分区方法与应用 [J]. 水科学进展, 2013, 24(4): 459-468. doi: 10.14042/j.cnki.32.1309.2013.04.008 WANG J N, WU W J, JIANG H Q, et al. Zoning methodology and application to China's watersheds for water pollution control [J]. Advances in Water Science, 2013, 24(4): 459-468(in Chinese). doi: 10.14042/j.cnki.32.1309.2013.04.008
[25] 生态环境部部长黄润秋在2021 年全国生态环境保护工作会议上的工作报告[EB/OL]. [2022-02-22] [26] 鲍林林, 李叙勇. 河流沉积物磷的吸附释放特征及其影响因素 [J]. 生态环境学报, 2017, 26(2): 350-356. doi: 10.16258/j.cnki.1674-5906.2017.02.023 BAO L L, LI X Y. Release and absorption characteristics of phosphorus in river sediment and their influential factors [J]. Ecology and Environmental Sciences, 2017, 26(2): 350-356(in Chinese). doi: 10.16258/j.cnki.1674-5906.2017.02.023
[27] 罗桂林, 田林锋. 基于WQI法的宁夏湖泊藻类爆发过程水环境质量变化及溯源探究 [J]. 环境化学, 2021, 40(7): 2073-2082. doi: 10.7524/j.issn.0254-6108.2020100301 LUO G L, TIAN L F. Study on water environmental quality change and source tracing of algae bloom in lakes of Ningxia based on WQI method [J]. Environmental Chemistry, 2021, 40(7): 2073-2082(in Chinese). doi: 10.7524/j.issn.0254-6108.2020100301
[28] 罗桂林, 田林锋, 陈月霞, 等. 基于多元统计的宁夏沙湖主要污染物季节性变化原因探究 [J]. 环境化学, 2018, 37(9): 2071-2080. doi: http://dx.doi.org/10.7524/j.issn.0254-6108.2017102602 LUO G L, TIAN L F, CHEN Y X, et al. Statistics based study on the seasonal variation of main pollutants in Shahu Lake, Ningxia [J]. Environmental Chemistry, 2018, 37(9): 2071-2080(in Chinese). doi: http://dx.doi.org/10.7524/j.issn.0254-6108.2017102602
[29] 付强, 尹澄清, 马允. 源头农业区不同类型水塘中水体沉积物磷吸附容量 [J]. 环境科学, 2005, 26(4): 70-76. doi: 10.13227/j.hjkx.2005.04.014 FU Q, YIN C Q, MA Y. Phosphorus sorption capacities of the pond sediments in a headstream agricultural watershed [J]. Environmental Science, 2005, 26(4): 70-76(in Chinese). doi: 10.13227/j.hjkx.2005.04.014
[30] LIU J Y, WANG H, YANG H J, et al. Detection of phosphorus species in sediments of artificial landscape lakes in China by fractionation and phosphorus-31 nuclear magnetic resonance spectroscopy [J]. Environmental Pollution, 2009, 157(1): 49-56. doi: 10.1016/j.envpol.2008.07.031 [31] WANG L L, YE M, LI Q S, et al. Phosphorus speciation in wetland sediments of Zhujiang (Pearl) river estuary, China [J]. Chinese Geographical Science, 2013, 23(5): 574-583. doi: 10.1007/s11769-013-0627-4 -
 点击查看大图
计量
- 文章访问数: 1633
- HTML全文浏览数: 1633
- PDF下载数: 89
- 施引文献: 0
