


-
石河子市是位于新疆天山北麓、乌昌石区域的典型工业城市,工业企业涉及化工、热电、电解铝、硅冶炼、水泥等,近几年,随着经济的快速发展,石河子市冬季以细颗粒物(PM2.5)为首要污染物的大气重污染天气频发[1-2]. 石河子市冬季平均气温为−6—4 ℃,最低气温−17 ℃左右,冬季石河子市以弱偏北风为主,静风频率大,平均风速较小,不利于污染物扩散[3]. 水溶性无机离子(water soluble inorganic ions,WSIIs)是大气PM2.5的主要组分之一,具有表面活性剂的特点,能够提高有毒有害物质在PM2.5中的溶解性,重污染天气下PM2.5中的WSIIs浓度较高,对人体健康危害较大,因此研究大气PM2.5中WSIIs的浓度和变化特征对于研究其来源和治理具有重要的现实意义[4-8].
WSIIs是PM2.5的主要成分之一,目前,国内外对于大气PM2.5中WSIIs的污染特征研究较为普遍,尤其对人口密集和污染较重的典型城市和工业区秋冬季大气PM2.5中的WSIIs进行了深入分析和研究[9-12]. 邢台市位于京津冀区域南部,冬季大气PM2.5污染程度与石河子市类似,王涵等[13]研究发现,冬季重污染期间,邢台市PM2.5平均浓度为176.2 μg·m−3,其中WSIIs以二次离子
${\rm{NO}}_3^{-} $ 、${\rm{SO}}_4^{2-} $ 和${\rm{NH}}_4^{+} $ 为主,分别占PM2.5的18.3%、9.3%和8.5%,3种离子浓度在污染加重时较污染初期分别升高了0.8、2.3、1.2倍. HAN等[14]研究认为,重污染期间硫酸盐、硝酸盐和铵盐等二次离子(SNA,即${\rm{SO}}_4^{2-} $ 、${\rm{NO}}_3^{-} $ 和${\rm{NH}}_4^{+} $ )是PM2.5中WSIIs的重要组成部分,且当PM2.5浓度增加时,SNA浓度和占比也随之增加. 新疆奎—独—乌(奎屯、独山子和乌苏)区域是紧邻石河子的另一个工业聚集区,赵雪艳[15]等研究发现,冬季随着污染等级的加重,${\rm{SO}}_4^{2-} $ 和${\rm{NO}}_3^{-} $ 在PM2.5中的质量百分比逐渐增加,严重污染天${\rm{SO}}_4^{2-} $ 和${\rm{NO}}_3^{-} $ 质量百分比分别比轻度污染天增加11.7%和5.5%,而${\rm{NH}}_4^{+} $ 组分质量百分比随污染等级的加重而逐渐降低,严重污染比轻度污染降低0.7%,污染越重大气二次转化程度越高,二次颗粒物是导致奎—独—乌区域冬季重污染的主要原因之一. 乌鲁木齐市与石河子市同为乌—昌—石(乌鲁木齐、昌吉和石河子)区域典型城市,魏明娜等[16]研究发现,乌鲁木齐市冬季PM2.5中WSIIs的平均质量浓度为(76.26±36.15)μg·m−3,WSIIs的主要成分为${\rm{SO}}_4^{2-} $ 、${\rm{NO}}_3^{-} $ 、${\rm{NH}}_4^{+} $ 和Cl−,这4种水溶性离子占PM2.5中总水溶性离子的88.91%,冬季PM2.5中${\rm{SO}}_4^{2-} $ 、${\rm{NO}}_3^{-} $ 和${\rm{NH}}_4^{+} $ 三者之间相关性较高,表明他们具有相似的来源. 石河子市位于奎—独—乌区域和乌—昌—石区域的中间,属于典型的工业城市,工业区位于城区北部,分别研究石河子市城区和工业区大气PM2.5中WSIIs的污染特征和来源,对于研究石河子市PM2.5的污染成因和区域污染传输等具有重要意义. -
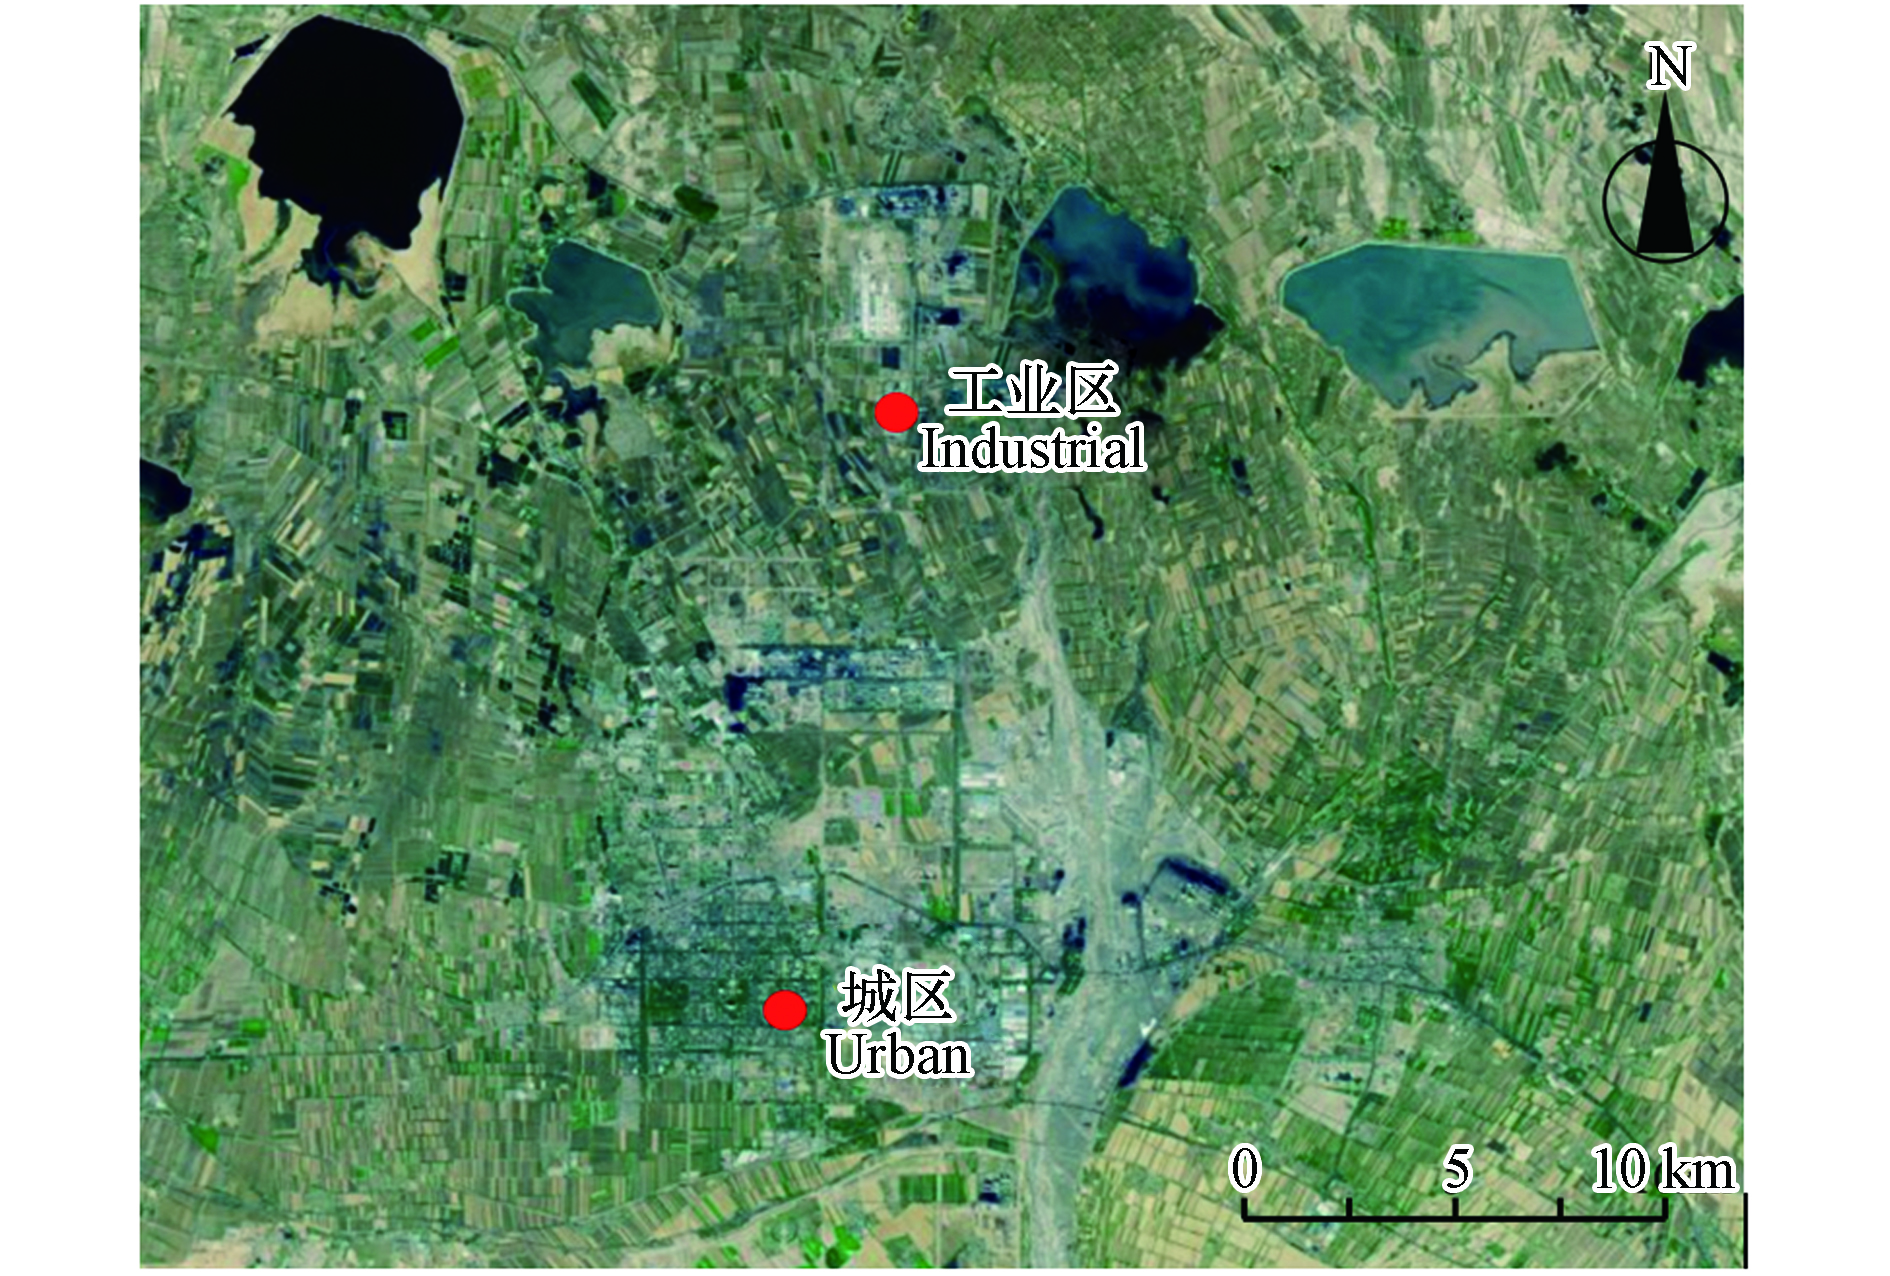
在石河子市城区和工业区内共布设2个采样点,如图1所示. 采样点布设参照HJ664—2013《环境空气质量监测点位布设技术规范》[17],城区采样点位于石河子市环境监测站楼顶(86.058E, 44.313N),采样口距地高度约为14 m,采样口周围无明显污染源. 工业区采样点位于大全新能源股份有限公司(大全)办公楼楼顶(86.096E, 44.422N),采样口距地高度约为13 m,工业区排放源主要以化工、热电、电解铝、硅冶炼、水泥等大型重工业高架点源为主.
2个采样点于2020年12月1日—2021年1月31日同步、同频率开展PM2.5采样工作,采样时间为每日10:00—翌日09:00,累积采样时长23 h,共采样62 d. 每日采集滤膜为2张直径47 mm的石英纤维滤膜(Q膜,Pall,Sweden). 采样设备为武汉天虹TH—16A型四通道颗粒物智能采样器,各滤膜的采样流量均为16.7 L·min−1.
-
利用超声萃取-离子色谱法对滤膜样品进行离子分析,使用切膜器将石英滤膜切割1/4置于离心管中,加入40 mL超纯水(18.2 MΩ·cm)并超声波振荡20 min,静置后用0.45 μm滤头过滤,转移进入离子色谱仪自动进样器进行分析(Dionex,ICS-100;Dionex,DX-80),分别对提取液中的K+、Na+、Ca2+、Mg2+、
${\rm{NH}}_4^{+} $ 、F−、Cl−、${\rm{NO}}_3^{-} $ 和${\rm{SO}}_4^{2-} $ 共9种水溶性离子进行测定. -
采样方法按照《环境空气颗粒物(PM2.5)手工监测方法(重量法)技术规范》[18]和及《环境空气质量手工监测技术规范》[19]要求,对滤膜进行前处理、包装、运输和保存,采样前将石英滤膜用铝箔纸包裹,放入马弗炉中使用480 ℃高温灼烧6 h,取出后在恒温恒湿环境中,温度为(20±5)℃,湿度为50%±4%,放置48 h后进行称重,称重后放置于滤膜盒中,然后用铝箔纸包裹滤膜盒进行存放. 实验室进行样品分析时,阴离子检测条件为:淋洗液为30 mmol·L−1的KOH,流速为1.2 mL·min−1, 色谱柱温度30 ℃,每份样品运行12 min,以峰面积定量. 阳离子检测条件为:淋洗液为20 mmol·L−1甲基磺酸溶液(MSA),流速为1.2 mL·min−1, 色谱柱温度30 ℃,每份样品运行8 min,以峰面积定量.
-
采样期间,石河子市城区和工业区处于全年温度最低的月份,城区采样点平均气温为−5—4 ℃,工业区为−10—3 ℃,两个采样点风向以弱偏北风为主,静风频率较大. 石河子市城区和工业区环境PM2.5中WSIIs质量浓度特征如图2所示,冬季采样期测得城区PM2.5污染水平和PM2.5中WSIIs的浓度水平均高于工业区,WSIIs浓度随时间的变化趋势与PM2.5的变化趋势较一致,线性关系较好.
采样期石河子市城区PM2.5中WSIIs浓度为(107.18±50.66) μg·m−3,高于乌鲁木齐市采暖季PM2.5中WSIIs浓度(76.26±36.15)μg·m−3[20],城区WSIIs中SNA浓度为(97.71±46.13)μg·m−3,在WSIIs中的占比为91.2%±3.1%,占比较高,城区WSIIs浓度由高到低依次为:
${\rm{SO}}_4^{2-} $ >${\rm{NO}}_3^{-} $ >${\rm{NH}}_4^{+} $ >Cl−>Ca2+>Na+>F−>K+>Mg2+. 采样期城区PM2.5浓度最高日为1月11日,当日PM2.5浓度为339.60 μg·m−3,WSIIs浓度同样最高,为228.18 μg·m−3,在PM2.5中的占比为67.2%,其中SNA的浓度也为整个采样期最高,为204.52 μg·m−3,在WSIIs中的占比为89.6%. 城区PM2.5中WSIIs的浓度超过200.00 μg·m−3的重污染日共3日,其中12月20日(PM2.5为203.64 μg·m−3)和1月10日(PM2.5为208.13 μg·m−3)的SNA浓度分别为178.29 μg·m−3和189.86 μg·m−3,分别占WSIIs浓度的87.6%和91.2%,表明石河子市冬季重污染日WSIIs浓度较大,且SNA在WSIIs中的占比很大. 城区PM2.5浓度最低日为1月23日,当日PM2.5浓度为28.6 μg·m−3,WSIIs浓度同样最低,为16.12 μg·m−3,在PM2.5中的占比为56.3%,其中SNA的浓度也为整个采样期最低,为13.89 μg·m−3,在WSIIs中的占比为86.2%,综上说明城区WSIIs是PM2.5的主要组成成分,SNA是城区WSIIs的主要组成成分.采样期工业区PM2.5中WSIIs浓度为(85.32±35.56)μg·m−3,SNA浓度为(76.97±32.87)μg·m−3,在WSIIs中的占比为90.2%±2.7%,工业区WSIIs浓度由高到低依次为:
${\rm{SO}}_4^{2-} $ >${\rm{NO}}_3^{-} $ >${\rm{NH}}_4^{+} $ >Cl−>Na+>Ca2+>F−>K+>Mg2+. 采样期工业区PM2.5浓度最高日为12月8日,当日PM2.5浓度为271.20 μg·m−3,WSIIs浓度同样最高,为168.74 μg·m−3,在PM2.5中的占比为62.2%,当日SNA的浓度也为整个采样期最高,为157.26 μg·m−3,在WSIIs中的占比为93.2%. 工业区WSIIs浓度最低日为1月23日,WSIIs浓度为22.29 μg·m−3,在PM2.5中的占比为63.0%,其中SNA的浓度也为整个采样期最低,为18.27 μg·m−3,在WSIIs中的占比为82.0%. 综上说明,工业区WSIIs在PM2.5中的占比较大,超过60.0%,且SNA为WSIIs的最主要成分,冬季在大气PM2.5污染防治工作中应重点关注PM2.5中WSIIs的浓度和变化特征,尤其是二次离子的管控.石河子市冬季城区和工业区PM2.5中各离子在WSIIs中的占比如图3所示,城区
${\rm{SO}}_4^{2-} $ 浓度占比为39.6%,高于工业区(37.2%),城区${\rm{NO}}_3^{-} $ 和${\rm{NH}}_4^{+} $ 浓度占比分别为27.9%和23.7%,低于工业区,城区SNA在WSIIs中的占比最低为82.9%,最高为95.8%,平均为91.2%±3.1%,工业区SNA在WSIIs中的占比最低为82.0%,最高为94.3%,平均为90.2%±2.7%,说明城区SNA在WSIIs中的占比略高于工业区,且SNA为城区和工业区WSIIs的最主要成分,冬季占比均在90%以上. 通常${\rm{SO}}_4^{2-} $ 主要来源于燃煤排放[21-22],${\rm{NO}}_3^{-} $ 主要来源于机动车尾气排放[23-24],${\rm{NH}}_4^{+} $ 主要来源于人为活动,尤其是农业生产和交通[25],说明石河子市机动车和燃煤排放以及其它人为活动对WSIIs的贡献最大. 通常Cl−主要来源于化石燃料燃烧排放,Ca2+主要来源于土壤扬尘[26-27]. 由图3可知,Cl−浓度占比低于${\rm{SO}}_4^{2-} $ 、${\rm{NO}}_3^{-} $ 和${\rm{NH}}_4^{+} $ ,在水溶性离子中的占比约为5%,但高于其它离子,同时,冬季城区Cl−的浓度和在WSIIs中的占比均低于工业区,说明工业区Cl−的排放相对较高,工业区化石燃料燃烧排放高于城区;其次为Ca2+和Na+,城区Ca2+浓度占比高于工业区,说明城区更容易受扬尘影响. 城区和工业区的F-、K+和Mg2+浓度占比较小,均低于1%. -
根据PM2.5浓度将采样期按污染程度分为良(50—100 μg·m−3)、轻度(100—150 μg·m−3)、中度(150—200 μg·m−3)、重度(200—300 μg·m−3)和严重(>300 μg·m−3)污染,如表1所示,除Mg2+和Ca2+外,各离子浓度随污染程度的增加而增加. 与空气质量为良相比,严重污染天城区PM2.5中各离子浓度增加值和浓度倍数分别为Na+(1.37 μg·m−3,2.9倍),NH4+(30.28 μg·m−3,4.2倍),K+(0.23 μg·m−3,2.5倍),Mg2+(0.12 μg·m−3,1.7倍),Ca2+(0.81 μg·m−3,1.5倍),F−(0.9 μg·m−3,5.5倍),Cl−(6.87 μg·m−3,5.2倍),
${\rm{NO}}_3^{-} $ (35.43 μg·m−3,4.1倍),${\rm{SO}}_4^{2-} $ (57.16 μg·m−3,5.3倍);工业区PM2.5中各离子浓度增加值和浓度倍数分别为Na+(1.31 μg·m−3,2.1倍),NH4+(20.53 μg·m−3,2.2倍),K+(0.21 μg·m−3,2.6倍),Mg2+(0.1 μg·m−3,0.1倍),Ca2+(0.02 μg·m−3,0.0倍),F−(0.68 μg·m−3,4.5倍),Cl−(4.46 μg·m−3,1.6倍),${\rm{NO}}_3^{-} $ (26.8 μg·m−3,2.8倍),${\rm{SO}}_4^{2-} $ (39.12 μg·m−3,3.5倍),城区浓度增加值和浓度倍数普遍大于工业区,说明冬季严重污染天气下,城区WSIIs比工业区累积的更快. 根据各离子的占比和随污染程度的变化可知,重污染天气下Ca2+浓度占比明显降低,其它离子占比随污染程度的变化不大,其中SNA在不同污染天气条件下的占比均为最高. 不同污染天城区SNA在WSIIs中的占比依次为88.2%(良)、91.4%(轻度)、92.0%(中度)、91.1%(重度)、91.3%(严重),工业区依次为86.7%(良)、88.1%(轻度)、90.7%(中度)、90.4%(重度)、91.2%(严重),SNA在WSIIs中的平均占比均超过90%,综上说明,污染越重SNA在城区和工业区WSIIs中累积越多,占比越大,城区和工业区在冬季污染天均应重点关注二次离子的贡献.大气PM2.5中通常
${\rm{NO}}_3^{-} $ /${\rm{SO}}_4^{2-} $ 浓度比值的大小可以用来表征移动源和燃煤等固定源对大气PM2.5中水溶性成分的贡献大小,当${\rm{NO}}_3^{-} $ /${\rm{SO}}_4^{2-} $ 小于1时,说明二次离子主要来源于燃煤排放,当${\rm{NO}}_3^{-} $ /${\rm{SO}}_4^{2-} $ 大于1时,说明二次离子主要来源于机动车排放[28-30]. 石河子市城区${\rm{NO}}_3^{-} $ /${\rm{SO}}_4^{2-} $ 值范围为0.40—1.32,平均为0.77,工业区范围为0.50—1.21,平均为0.81,城区${\rm{NO}}_3^{-} $ /${\rm{SO}}_4^{2-} $ 值按污染程度依次为良1.10、轻度0.80、中度0.82、重度0.66、严重0.67,工业区${\rm{NO}}_3^{-} $ /${\rm{SO}}_4^{2-} $ 值依次为良0.84、轻度0.88、中度0.81、重度0.75、严重0.72. 说明城区空气质量较好时,二次离子来源于机动车排放相对较多;城区和工业区空气质量较差时,二次离子的积累受燃煤影响最大,污染越重燃煤排放贡献越大. -
WSIIs之间的相关性表征了其在大气中的存在形式及来源[31-32]. 石河子市冬季城区和工业区PM2.5中各离子成分的相关性如表2所示,城区相关性最高的为
${\rm{SO}}_4^{2-} $ 与${\rm{NH}}_4^{+} $ ,相关性为0.939,均在0.05水平(双侧)高度同源,说明${\rm{SO}}_4^{2-} $ 与${\rm{NH}}_4^{+} $ 高度同源,其次为${\rm{NH}}_4^{+} $ 与${\rm{NO}}_3^{-} $ ,${\rm{SO}}_4^{2-} $ 与F−,Na+与Cl−,Na+与K+,F−与Cl−,说明城区${\rm{NH}}_4^{+} $ 主要以(NH4)2SO4及NH4HSO4等的形式存在.工业区相关性较高的为
${\rm{SO}}_4^{2-} $ 与${\rm{NH}}_4^{+} $ ,${\rm{NO}}_3^{-} $ 与${\rm{NH}}_4^{+} $ ,相关性分别为0.963和0.926,均在0.05水平(双侧)高度同源,说明${\rm{SO}}_4^{2-} $ 与${\rm{NH}}_4^{+} $ 、${\rm{NO}}_3^{-} $ 与NH4+高度同源,其次为${\rm{NO}}_3^{-} $ 与${\rm{SO}}_4^{2-} $ ,相关性为0.866,说明工业区${\rm{NH}}_4^{+} $ 主要以(NH4)2SO4、NH4HSO4以及NH4NO3的形式存在.城区离子间相关性大于0.8的值有13个,工业区离子间相关性大于0.8的值有7个,说明城区各离子间相关性大于工业区. 工业区
${\rm{SO}}_4^{2-} $ 、${\rm{NO}}_3^{-} $ 和${\rm{NH}}_4^{+} $ 之间的相关性最好,具有高度同源性,可能主要来源于工业排放污染物的化学转化.环境空气PM2.5中WSIIs电荷的平衡特征常用来表征离子的酸碱平衡,具体方法为:阴阳离子的摩尔电荷浓度值×离子电荷数=各离子电荷量,然后离子相加分别得出阴离子和阳离子的电荷总量[33-34],具体公式如下:
式中,AE和CE分别为阴离子和阳离子电荷当量浓度(μmol·m−3).
计算可知,城区阴离子电荷当量浓度为1.55 μmol·m−3,阳离子电荷当量浓度为1.58 μmol·m−3,工业区阴离子电荷当量浓度为1.23 μmol·m−3,阳离子电荷当量浓度为1.29 μmol·m−3,城区阴阳离子电荷当量浓度差值较小,工业区阳离子电荷当量浓度差值较大,且阴离子电荷当量浓度均低于阳离子,说明城区和工业区阴离子相对亏损,大气颗粒物均呈弱碱性,且工业区颗粒物碱性高于城区. 如图4所示,根据石河子市冬季城区和工业区PM2.5中阴阳离子电荷相关性分析可知,城区和工业区阴阳离子电荷当量之间的拟合直线斜率分别为1.06和1.12,城区阴阳离子电荷当量浓度相关性R2为0.9164,工业区为0.9547,说明石河子市城区和工业区阴阳离子明显相关,具有较好的同源性.
-
冬季石河子市城区PM2.5中WSIIs浓度为(107.18±50.66)μg·m−3,在PM2.5中的占比为56.3%—67.2%,工业区PM2.5中WSIIs浓度为(85.32±35.56)μg·m−3,在PM2.5中的占比为62.2%—63.0%,说明WSIIs为石河子市冬季PM2.5的主要成分,城区WSIIs中各离子浓度由高到低依次为:
${\rm{SO}}_4^{2-} $ >${\rm{NO}}_3^{-} $ >${\rm{NH}}_4^{+} $ >Cl−>Ca2+>Na+>F−>K+>Mg2+,工业区为:${\rm{SO}}_4^{2-} $ >${\rm{NO}}_3^{-} $ >${\rm{NH}}_4^{+} $ >Cl−>Na+>Ca2+>F−>K+>Mg2+. 城区WSIIs中SNA的浓度为(97.71±46.13)μg·m−3,在WSIIs中的占比为91.2%±3.1%,工业区为(76.97±32.87)μg·m−3,在WSIIs中的占比为90.3%±2.7%,说明SNA为WSIIs的最主要成分,同时也是PM2.5的主要组分,石河子市冬季应重点关注城区和工业区SNA的浓度变化,加强对机动车、燃煤排放和其它人为活动的科学管控.石河子市冬季城区Cl−的浓度在WSIIs中的占比低于工业区,Ca2+浓度占比高于工业区,说明工业区受化石燃料燃烧影响较大,而城区更易受扬尘影响. 城区和工业区的F−、K+和Mg2+在WSIIs中的浓度占比较小,均低于1%. 轻度及以上污染天,城区和工业区
${\rm{NO}}_3^{-} $ /${\rm{SO}}_4^{2-} $ 的比值均低于0.9,重度及以上污染天均低于0.8,说明冬季重度及以上污染天,燃煤排放对WSIIs的贡献大于机动车排放,燃煤排放对城区的影响大于工业区. 根据离子相关性分析可知,城区离子主要组分为(NH4)2SO4和NH4HSO4,工业区主要为(NH4)2SO4、NH4HSO4和NH4NO3,工业区${\rm{SO}}_4^{2-} $ 、${\rm{NO}}_3^{-} $ 和${\rm{NH}}_4^{+} $ 之间具有高度同源性.
石河子市冬季城区与工业区PM2.5中水溶性无机离子特征与来源
Pollution characteristics and sources of water-soluble inorganic ions in PM2.5 in Shihezi Urban and industrial areas in winter
-
摘要: 为研究石河子市冬季PM2.5中水溶性无机离子(Water Soluble Inorganic Ions,WSIIs)的污染特征和来源,2020年12月和2021年1月在石河子市城区和工业区共布设2个采样点,采集PM2.5样品共122组,使用Dionex ICS-900分析仪对
${\rm{SO}}_4^{2-} $ 、${\rm{NO}}_3^{-} $ 、Cl−、F−、${\rm{NH}}_4^{+} $ 、Na+、K+、Ca2+和Mg2+共9种WSIIs进行分析. 结果表明,冬季石河子市城区PM2.5中WSIIs浓度为(107.18±50.66)μg·m−3,在PM2.5中的占比为56.3%—67.2%,工业区PM2.5中WSIIs浓度为(85.32±35.56)μg·m−3,在PM2.5中的占比为62.2%—63.0%,说明WSIIs是石河子市冬季PM2.5的主要成分,城区WSIIs浓度特征为:${\rm{SO}}_4^{2-} $ >${\rm{NO}}_3^{-} $ >${\rm{NH}}_4^{+} $ >Cl−>Ca2+>Na+>F−>K+>Mg2+,工业区为:${\rm{SO}}_4^{2-} $ >${\rm{NO}}_3^{-} $ >${\rm{NH}}_4^{+} $ >Cl−>Na+>Ca2+>F−>K+>Mg2+;城区大气PM2.5中SNA(${\rm{SO}}_4^{2-} $ 、${\rm{NO}}_3^{-} $ 和${\rm{NH}}_4^{+} $ )的浓度为(97.71±46.13)μg·m−3,在WSIIs中的占比为91.2%±3.1%,工业区SNA的浓度为(76.97±32.87)μg·m−3,在WSIIs中的占比为90.3%±2.7%,说明SNA为WSIIs的主要组分,同时也是PM2.5的主要组分;城区Cl−的浓度低于工业区,Ca2+浓度高于工业区,说明工业区受化石燃料燃烧影响较大,城区受扬尘影响较大;重度及以上污染天气,燃煤排放对PM2.5的贡献大于机动车,燃煤排放对城区的影响大于工业区;城区PM2.5中离子的主要组分为(NH4)2SO4和NH4HSO4,工业区主要为(NH4)2SO4、NH4HSO4和NH4NO3,工业区${\rm{SO}}_4^{2-} $ 、${\rm{NO}}_3^{-} $ 和${\rm{NH}}_4^{+} $ 之间具有高度同源性.Abstract: To study the pollution characteristics and sources of water-soluble inorganic ions (WSIIs) in Shihezi city in winter, 122 PM2.5 samples were collected in two sites of the urban areas and industrial areas from December 2020 to January 2021. The chromatography system (Dionex ics-900) was used to detect the cations and anions (${\rm{SO}}_4^{2-} $ ,${\rm{NO}}_3^{-} $ , Cl−, F−,${\rm{NH}}_4^{+} $ , Na+, K+, Ca2+ and Mg2+) of PM2.5. The results showed that, in winter the concentrations of WSIIs in urban areas and industrial areas were (107.18±50.66) μg·m−3 and (85.32±35.56) μg·m−3, respectively, and the proportion of that in PM2.5 were 56.3%—67.2% and 62.2%—63.0%, respectively. WSIIs were the main component of PM2.5 in Shihezi city in winter. The trend of ions concentrations in urban areas were${\rm{SO}}_4^{2-} $ >${\rm{NO}}_3^{-} $ >${\rm{NH}}_4^{+} $ >Cl−>Ca2+>Na+>F−>K+>Mg2+, and the urban areas were${\rm{SO}}_4^{2-} $ >${\rm{NO}}_3^{-} $ >${\rm{NH}}_4^{+} $ >Cl−>Na+>Ca2+>F−>K+>Mg2+. The concentrations of SNA (${\rm{SO}}_4^{2-} $ ,${\rm{NO}}_3^{-} $ and${\rm{NH}}_4^{+} $ ) in urban and industrial areas were (97.71±46.13) μg·m−3 and (76.97±32.87) μg·m−3, respectively, and those accounted for 91.2%±3.1% and 90.3%±2.7% of WSIIs, respectively. The results indicated that SNA was the main component of WSIIs and PM2.5. The concentration of Cl− in urban areas was lower than that in industrial areas, and there was different result for Ca2+. The results indicated that the PM2.5 was greatly affected by fossil fuel combustion in industrial areas, while the PM2.5 in urban areas was greatly affected by dust. In severe pollution days, the contribution of coal-fired emission to PM2.5 was greater than that of motor vehicles, and the contribution of coal-fired emission in urban areas was greater than that of industrial areas. The main components of ions in urban areas were (NH4)2SO4 and NH4HSO4, and in industrial areas were mainly (NH4)2SO4, NH4HSO4 and NH4NO3, There was a high degree of homology between${\rm{SO}}_4^{2-} $ ,${\rm{NO}}_3^{-} $ and${\rm{NH}}_4^{+} $ in industrial areas.-
Key words:
- Shihezi city /
- urban and industrial areas /
- PM2.5 /
- water-soluble inorganic ions /
- winter.
-

-
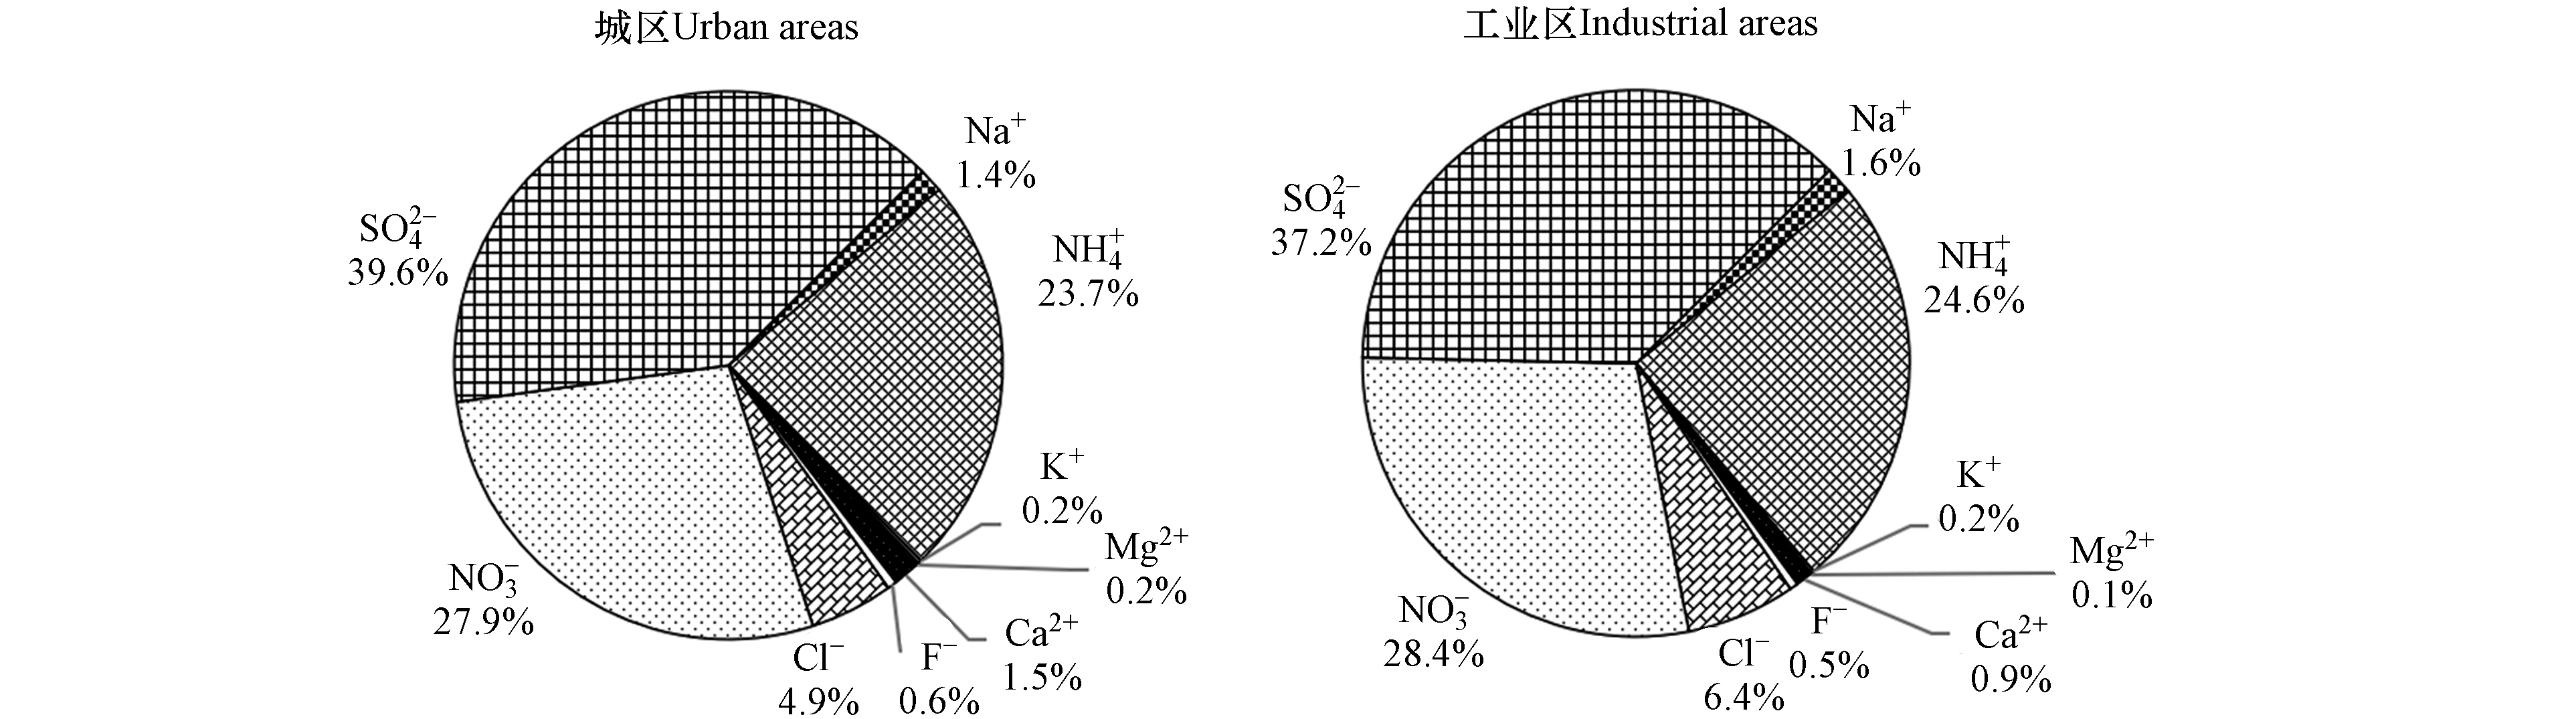
图 3 采样期水溶性离子浓度占比
Figure 3. Percentage of water-soluble ions in PM2.5 during sampling period
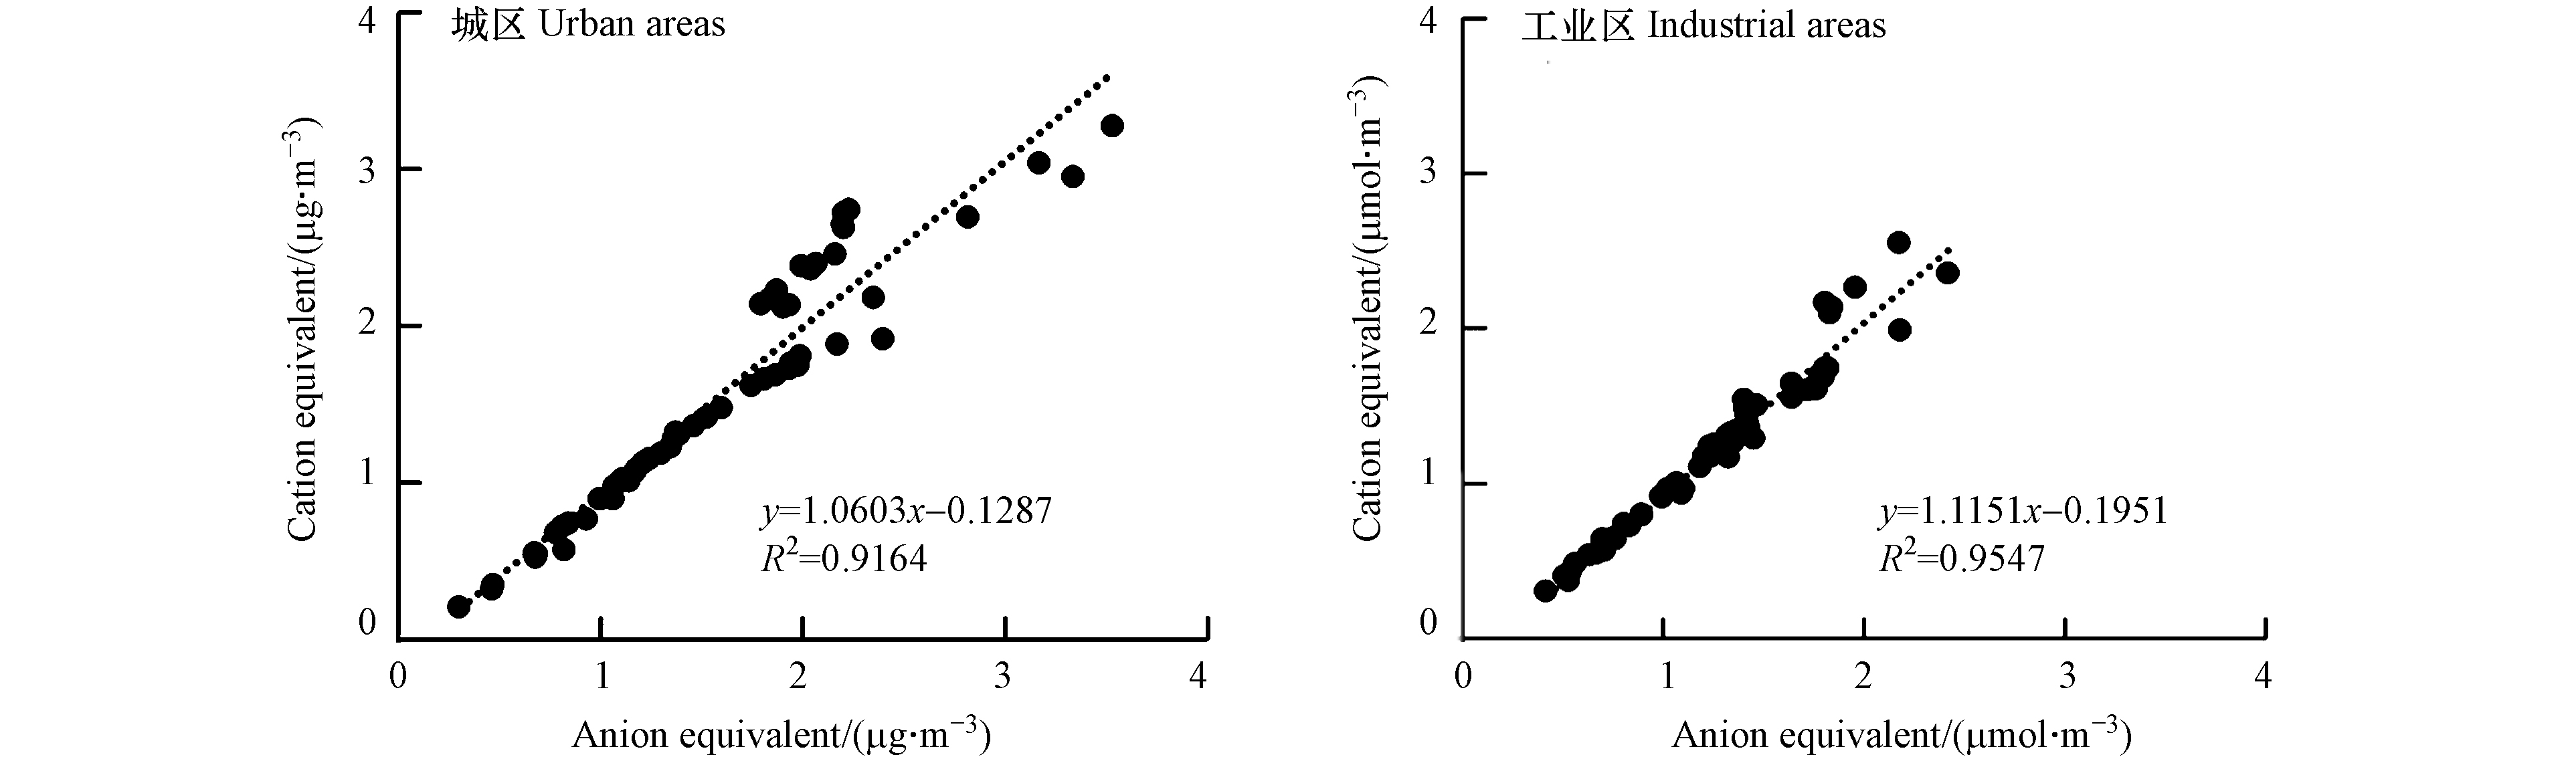
图 4 阴阳离子电荷平衡相关性分析
Figure 4. Analysis of the correlation between the electric charge balance of anion and cation
表 1 采样期石河子市城区和工业区PM2.5中WSIIs质量浓度和占比
Table 1. The mass concentration and ratio of water-soluble ions in PM2.5 during sampling period
功能区
Functional areas污染等级
Pollution degree项目
ContentNa+ ${\rm{NH}}_4^{+} $ K+ Mg2+ Ca2+ F− Cl− ${\rm{NO}}_3^{-} $ ${\rm{SO}}_4^{2-} $ SNA 城区
Urban areas良 ρ/(μg·m−3) 0.71 9.47 0.15 0.17 1.69 0.20 1.65 11.47 13.15 34.09 占比/% 1.8 24.5 0.4 0.4 4.4 0.5 4.3 29.7 34.0 88.2 轻度 ρ/(μg·m−3) 1.04 15.67 0.16 0.13 1.39 0.23 2.56 18.85 23.67 58.19 占比/% 1.6 24.6 0.3 0.2 2.2 0.4 4.0 29.6 37.2 91.4 中度 ρ/(μg·m−3) 1.28 21.69 0.24 0.15 1.35 0.38 3.66 26.79 32.85 81.33 占比/% 1.4 24.5 0.3 0.2 1.5 0.4 4.1 30.3 37.2 92.0 重度 ρ/(μg·m−3) 1.89 30.22 0.31 0.15 1.49 0.75 6.89 34.66 52.49 117.37 占比/% 1.5 23.5 0.2 0.1 1.2 0.6 5.3 26.9 40.7 91.1 严重 ρ/(μg·m−3) 2.08 39.75 0.38 0.29 2.50 1.10 8.52 46.9 70.31 156.96 占比/% 1.2 23.1 0.2 0.2 1.5 0.6 5.0 27.3 40.9 91.3 平均 ρ/(μg·m−3) 1.54 25.38 0.27 0.17 1.63 0.59 5.27 29.85 42.48 97.71 占比/% 1.4 23.7 0.3 0.2 1.5 0.6 4.9 27.9 39.6 91.2 工业区
Industrial areas良 ρ/(μg·m−3) 0.62 9.33 0.08 0.08 0.88 0.15 2.80 9.44 11.22 29.99 占比/% 1.8 27.0 0.2 0.2 2.5 0.4 8.1 27.3 32.4 86.7 轻度 ρ/(μg·m−3) 0.97 13.28 0.10 0.05 0.60 0.22 4.12 14.81 16.91 45.00 占比/% 1.9 26.0 0.2 0.1 1.2 0.4 8.1 29.0 33.1 88.1 中度 ρ/(μg·m−3) 1.26 21.70 0.15 0.09 1.02 0.44 5.11 25.50 31.60 78.80 占比/% 1.5 25.0 0.2 0.1 1.2 0.5 5.9 29.4 36.4 90.7 重度 ρ/(μg·m−3) 1.70 24.67 0.19 0.06 0.72 0.45 6.56 28.44 38.14 91.25 占比/% 1.7 24.4 0.2 0.1 0.7 0.4 6.5 28.2 37.8 90.4 严重 ρ/(μg·m−3) 1.93 29.86 0.29 0.09 0.90 0.83 7.26 36.24 50.34 116.44 占比/% 1.5 23.4 0.2 0.1 0.7 0.6 5.7 28.4 39.4 91.2 平均 ρ/(μg·m−3) 1.39 21.00 0.17 0.07 0.81 0.42 5.49 24.27 31.70 76.97 占比/% 1.6 24.6 0.2 0.1 1.0 0.5 6.4 28.5 37.2 90.2  下载: 导出CSV
表 2 石河子市城区和工业区PM2.5中WSIIs相关矩阵
Table 2. Correlation analysis results of water-soluble ions in PM2.5 of Shihezi urban and industrial areas
离子
IonsNa+ ${\rm{NH}}_4^{+} $ K+ Mg2+ Ca2+ F− Cl− ${\rm{NO}}_3^{-} $ ${\rm{SO}}_4^{2-} $ Na+ 0.786** 0.892** 0.469** 0.504** 0.849** 0.894** 0.608** 0.864** ${\rm{NH}}_4^{+} $ 0.742** 0.699** 0.406** 0.378** 0.786** 0.756** 0.879** 0.939** K+ 0.830** 0.694** 0.522** 0.552** 0.873** 0.852** 0.503** 0.791** Mg2+ 0.111 0.104 0.246 0.862** 0.583** 0.587** 0.209 0.423** Ca2+ 0.050 0.128 0.120 0.813** 0.618** 0.580** 0.156 0.423** F− 0.636** 0.736** 0.741** 0.325** 0.226 0.884** 0.598** 0.893** Cl− 0.766** 0.685** 0.635** 0.244 0.212 0.569** 0.529** 0.848** ${\rm{NO}}_3^{-} $ 0.602** 0.926** 0.584** 0.027 0.079 0.578** 0.572** 0.830** ${\rm{SO}}_4^{2-} $ 0.807** 0.963** 0.768** 0.168 0.171 0.825** 0.750** 0.866** 注:右上角为城区,左下角为工业区,“*”为在0.05水平(双侧)上显著相关,“**”为在0.01水平(双侧)上显著相关.
Ps: The upper right corner is the urban areas and lower left corner is the industrial areas,“*”represents a significant correlation at 0.05 level (2-sided),“**” represents a significant correlation at 0.01 level(2-sided).
下载: 导出CSV
-
[1] 袁晓琴. 第八师石河子市工业结构分析与优化对策 [J]. 新疆农垦经济, 2015(2): 35-40. doi: 10.3969/j.issn.1000-7652.2015.02.008 YUAN X Q. Analysis and optimization countermeasures of industrial structure in Shihezi city of the eighth division [J]. Xinjiang State Farms Economy, 2015(2): 35-40(in Chinese). doi: 10.3969/j.issn.1000-7652.2015.02.008
[2] 郑晓伍, 陈家灯, 刘子龙, 等. 石河子市PM2.5中有机碳和元素碳的变化特征与来源解析 [J]. 环境化学, 2018, 37(1): 115-122. doi: 10.7524/j.issn.0254-6108.2017042401 ZHENG X W, CHEN J D, LIU Z L, et al. Characteristics and source apportionment of organic carbon and elemental carbon in PM2.5 in Shihezi, Xinjiang, China [J]. Environmental Chemistry, 2018, 37(1): 115-122(in Chinese). doi: 10.7524/j.issn.0254-6108.2017042401
[3] 杨香林, 李维军. “十三五”期间石河子市环境空气质量变化趋势及改善对策分析 [J]. 山东化工, 2021, 50(14): 260-261,264. doi: 10.3969/j.issn.1008-021X.2021.14.109 YANG X L, LI W J. Ambient air quality in Shihezi during the 13th Five-Year Plan period change trend and improvement countermeasure analysis [J]. Shandong Chemical Industry, 2021, 50(14): 260-261,264(in Chinese). doi: 10.3969/j.issn.1008-021X.2021.14.109
[4] 周变红, 冯瞧, 王锦, 等. 宝鸡市城郊冬季水溶性离子在不同等级污染天的特征及来源分析 [J]. 环境化学, 2021, 40(9): 2796-2808. doi: 10.7524/j.issn.0254-6108.2021020102 ZHOU B H, FENG Q, WANG J, et al. Characteristics and source analysis of water-soluble ions in Baoji urban and suburban areas on different levels of polluted days [J]. Environmental Chemistry, 2021, 40(9): 2796-2808(in Chinese). doi: 10.7524/j.issn.0254-6108.2021020102
[5] WANG Y, ZHUANG G S, TANG A H, et al. The ion chemistry and the source of PM2.5 aerosol in Beijing [J]. Atmospheric Environment, 2005, 39(21): 3771-3784. doi: 10.1016/j.atmosenv.2005.03.013 [6] XU L L, DUAN F K, HE K B, et al. Characteristics of the secondary water-soluble ions in a typical autumn haze in Beijing [J]. Environmental Pollution, 2017, 227: 296-305. doi: 10.1016/j.envpol.2017.04.076 [7] 李友谊, 肖化云, 刘学炎, 等. 贵阳市大气总悬浮颗粒物(TSP)中水溶性无机离子的化学特性及季节变化特征 [J]. 矿物岩石地球化学通报, 2008, 27(1): 43-49. doi: 10.3969/j.issn.1007-2802.2008.01.007 LI Y Y, XIAO H Y, LIU X Y, et al. Chemical characteristics and seasonal variation of water-soluble inorganic ions in TSP in Guiyang, SW China [J]. Bulletin of Mineralogy, Petrology and Geochemistry, 2008, 27(1): 43-49(in Chinese). doi: 10.3969/j.issn.1007-2802.2008.01.007
[8] 邓靓, 韩新宇, 施择, 等. 云南低纬度高原城市大气PM2.5中水溶性离子特征及来源分析 [J]. 环境化学, 2020, 39(12): 3306-3317. doi: 10.7524/j.issn.0254-6108.2019082903 DENG L, HAN X Y, SHI Z, et al. Characteristics and source analysis of water soluble ions in atmospheric PM2.5 in low latitude plateau cities of Yunnan Province [J]. Environmental Chemistry, 2020, 39(12): 3306-3317(in Chinese). doi: 10.7524/j.issn.0254-6108.2019082903
[9] YAO X H, CHAN C K, FANG M, et al. The water-soluble ionic composition of PM2.5 in Shanghai and Beijing, China [J]. Atmospheric Environment, 2002, 36(26): 4223-4234. doi: 10.1016/S1352-2310(02)00342-4 [10] WANG H L, ZHU B, SHEN L J, et al. Water-soluble ions in atmospheric aerosols measured in five sites in the Yangtze River Delta, China: Size-fractionated, seasonal variations and sources [J]. Atmospheric Environment, 2015, 123: 370-379. doi: 10.1016/j.atmosenv.2015.05.070 [11] YAO X H, FANG M, CHAN C K. The size dependence of chloride depletion in fine and coarse sea-salt particles [J]. Atmospheric Environment, 2003, 37(6): 743-751. doi: 10.1016/S1352-2310(02)00955-X [12] 陈巧, 吴丽萍, 徐勃, 等. 淄博2021年元宵节PM2.5水溶性离子污染特征 [J]. 环境科学, 2022, 43(2): 629-638. CHEN Q, WU L P, XU B, et al. Pollution characteristics of water-soluble ions in PM2.5 during the lantern festival of 2021 in Zibo City [J]. Environmental Science, 2022, 43(2): 629-638(in Chinese).
[13] 王涵, 王崇臣, 王淑兰, 等. 邢台市冬季一次重污染过程PM2.5污染特征分析 [J]. 环境工程技术学报, 2022, 12(1): 22-28. doi: 10.12153/j.issn.1674-991X.20210059 WANG H, WANG C C, WANG S L, et al. Analysis of PM2.5 pollution characteristics of a winter heavy pollution process in Xingtai City [J]. Journal of Environmental Engineering Technology, 2022, 12(1): 22-28(in Chinese). doi: 10.12153/j.issn.1674-991X.20210059
[14] HAN B, ZHANG R, YANG W, et al. Heavy air pollution episodes in Beijing during January 2013: Inorganic ion chemistry and source analysis using highly time-resolved measurements in an urban site [J]. Atmospheric Chemistry and Physics, 2015, 15(7): 11111-11141. [15] 赵雪艳, 谷超, 杨焕明, 等. 新疆奎独乌区域冬季大气重污染过程PM2.5组成特征及来源解析 [J]. 环境科学研究, 2017, 30(10): 1515-1523. ZHAO X Y, GU C, YANG H M, et al. Chemical composition and source apportionment of PM2.5during a winter air pollution episode in the Kui-du-wu area of Xinjiang uygur autonomous region [J]. Research of Environmental Sciences, 2017, 30(10): 1515-1523(in Chinese).
[16] 魏明娜, 谢海燕, 邓文叶, 等. 乌鲁木齐市采暖期与非采暖期大气PM2.5和PM10中水溶性离子特征分析 [J]. 安全与环境学报, 2017, 17(5): 1986-1991. WEI M N, XIE H Y, DENG W Y, et al. Water-soluble ions pollution characteristics of the atmospheric particles(PM2.5 and PM10) in Urumqi during the heating and non-heating periods [J]. Journal of Safety and Environment, 2017, 17(5): 1986-1991(in Chinese).
[17] 中华人民共和国环境保护部. 环境空气质量监测点位布设技术规范: HJ 664—2013[S]. 北京: 中国环境科学出版社, 2013. Ministry of Environmental Protection of the People's Republic of China. Technical specification for layout of ambient air quality monitoring points: HJ 664—2013[S]. Beijing: China Environment Science Press, 2013(in Chinese).
[18] 中华人民共和国环境保护部. 环境空气颗粒物(PM2.5)手工监测方法(重量法)技术规范: HJ656—2013[S]. 2013 Ministry of Environmental Protection of the People's Republic of China. Technical specifications for gravimetric measurement methods for PM2.5 in ambient air: HJ 656—2013[S]. 2013(in Chinese).
[19] 中华人民共和国环境保护部. 环境空气质量手工监测技术规范: HJ 194—2017[S]. 2017. Ministry of Environmental Protection of the People's Republic of China. Technical specifications on manual methods for ambient air quality monitoring: HJ 194—2017[S]. 2017(in Chinese).
[20] 刘新春, 陈红娜, 赵克蕾, 等. 乌鲁木齐大气细颗粒物PM2.5水溶性离子浓度特征及其来源分析 [J]. 生态环境学报, 2015, 24(12): 2002-2008. LIU X C, CHEN H N, ZHAO K L, et al. Analysis the effect and source on water-soluble ions of fine particulate matter(PM2.5) in Urumqi [J]. Ecology and Environmental Sciences, 2015, 24(12): 2002-2008(in Chinese).
[21] 杨建军, 杜利劳, 马启翔, 等. 燃煤电厂锅炉PM2.5现场实测与排放特征研究 [J]. 重庆大学学报, 2018, 41(12): 55-65. YANG J J, DU L L, MA Q X, et al. Study on emission characteristics and field measurement of PM2.5 in coal-fired power plant boilers [J]. Journal of Chongqing University, 2018, 41(12): 55-65(in Chinese).
[22] 王亚虹, 张鹏, 宋文斌, 等. 西安市PM2.5燃煤源谱特征研究 [J]. 环境科学与管理, 2017, 42(4): 46-51. doi: 10.3969/j.issn.1673-1212.2017.04.011 WANG Y H, ZHANG P, SONG W B, et al. Study on PM2.5 characteristics of coal source profiles in Xi'an City [J]. Environmental Science and Management, 2017, 42(4): 46-51(in Chinese). doi: 10.3969/j.issn.1673-1212.2017.04.011
[23] 孙友敏, 李少洛, 陈春竹, 等. 济南市机动车排气污染特征及对市区PM2.5的影响 [J]. 环境科学学报, 2018, 38(4): 1384-1391. SUN Y M, LI S L, CHEN C Z, et al. Study on characteristics of vehicle exhaust and the influence on PM2.5 in Jinan City [J]. Acta Scientiae Circumstantiae, 2018, 38(4): 1384-1391(in Chinese).
[24] 范武波, 陈军辉, 钱骏, 等. 机动车尾气对人体健康的危害 [J]. 中国环境管理, 2016, 8(1): 110-113. doi: 10.3969/j.issn.1674-6252.2016.01.023 FAN W B, CHEN J H, QIAN J, et al. Effects of vehicle emissions on human's health [J]. Chinese Journal of Environmental Management, 2016, 8(1): 110-113(in Chinese). doi: 10.3969/j.issn.1674-6252.2016.01.023
[25] 黄虹, 贺冰洁, 熊震宇, 等. 南昌市PM2.5中铵盐及其气态前体物的分布特征与转化机制 [J]. 地球环境学报, 2018, 9(4): 334-347. HUANG H, HE B J, XIONG Z Y, et al. Distribution and conversion mechanism of ammonium in PM2.5 and gaseous precursors in Nanchang [J]. Journal of Earth Environment, 2018, 9(4): 334-347(in Chinese).
[26] 冯亚平, 王帅, 徐婧怡, 等. 承德市细颗粒物水溶性无机离子特征及解析 [J]. 环境化学, 2020, 39(12): 3353-3361. doi: http://dx.doi.org/10.7524/j.issn.0254-6108.2019091802 FENG Y P, WANG S, XU J Y, et al. Characteristics and source apportionment of water-soluble inorganic ions in atmospheric fine particles in Chengde [J]. Environmental Chemistry, 2020, 39(12): 3353-3361(in Chinese). doi: http://dx.doi.org/10.7524/j.issn.0254-6108.2019091802
[27] 鲍宗炜, 张宏, 周志刚, 等. 兰溪市PM2.5中水溶性离子的组成特征及季节变化 [J]. 环境科学学报, 2021, 41(5): 1727-1733. BAO Z W, ZHANG H, ZHOU Z G, et al. Compositional characteristics and seasonal variations of the water-soluble ions in PM2.5 in Lanxi [J]. Acta Scientiae Circumstantiae, 2021, 41(5): 1727-1733(in Chinese).
[28] 武志宏, 孙爽, 武高峰, 等. 保定市PM2.5中水溶性离子污染特征及来源分析 [J]. 环境化学, 2021, 40(5): 1421-1430. doi: 10.7524/j.issn.0254-6108.2019120901 WU Z H, SUN S, WU G F, et al. The pollution pattern and source analysis of water-soluble ions of PM2.5 in Baoding City [J]. Environmental Chemistry, 2021, 40(5): 1421-1430(in Chinese). doi: 10.7524/j.issn.0254-6108.2019120901
[29] 冯炎鹏, 张军科, 黄小娟, 等. 成都夏冬季PM2.5中水溶性无机离子污染特征 [J]. 环境科学, 2020, 41(7): 3012-3020. FENG Y P, ZHANG J K, HUANG X J, et al. Pollution characteristics of water-soluble inorganic ions in Chengdu in summer and winter [J]. Environmental Science, 2020, 41(7): 3012-3020(in Chinese).
[30] 马红璐, 赵欣, 陆建刚, 等. 宿迁市PM2.5中水溶性无机离子的季节特征和来源分析 [J]. 环境科学, 2020, 41(9): 3899-3907. MA H L, ZHAO X, LU J G, et al. Seasonal characteristics and source analysis of water-soluble inorganic ions in PM2.5 in Suqian City [J]. Environmental Science, 2020, 41(9): 3899-3907(in Chinese).
[31] 杨懂艳, 刘保献, 张大伟, 等. 2012—2013年间北京市PM2.5中水溶性离子时空分布规律及相关性分析 [J]. 环境科学, 2015, 36(3): 768-773. YANG D Y, LIU B X, ZHANG D W, et al. Correlation, seasonal and temporal variation of water-soluble ions of PM2.5 in Beijing during 2012-2013 [J]. Environmental Science, 2015, 36(3): 768-773(in Chinese).
[32] 杨懂艳, 刘保献, 张大伟, 等. 2014年APEC前后北京城区PM2.5中水溶性离子特征分析 [J]. 环境科学, 2015, 36(12): 4325-4330. YANG D Y, LIU B X, ZHANG D W, et al. Characterization of water-soluble ions in PM2.5 of Beijing during 2014 APEC [J]. Environmental Science, 2015, 36(12): 4325-4330(in Chinese).
[33] ZHOU J B, XING Z Y, DENG J J, et al. Characterizing and sourcing ambient PM2.5 over key emission regions in China I: Water-soluble ions and carbonaceous fractions [J]. Atmospheric Environment, 2016, 135: 20-30. doi: 10.1016/j.atmosenv.2016.03.054 [34] HUANG X J, LIU Z R, ZHANG J K, et al. Seasonal variation and secondary formation of size-segregated aerosol water-soluble inorganic ions during pollution episodes in Beijing [J]. Atmospheric Research, 2016, 168: 70-79. doi: 10.1016/j.atmosres.2015.08.021 -
 点击查看大图
计量
- 文章访问数: 1269
- HTML全文浏览数: 1269
- PDF下载数: 112
- 施引文献: 0


