-
大气污染源排放清单是指在一定的时间尺度下针对某个特定区域各个污染源排放到大气中污染物的集合[1],为探索大气污染形成机制提供基础信息,对大气污染治理战略决策起指导作用[2]. 在目前“双碳”战略的大背景下,城市发展和工业化进程中排放清单对污染物的排放、影响因素以及控制措施能够进行较完善的描述,对所研究城市或区域了解大气污染来源、分析污染形成原因并提出针对性的管控措施具有十分重要的意义[3]. 对于扬尘源排放清单的研究美国开始的较早,最早于1968年发布大气污染排放因子AP-42手册,并逐年完善[4];中国起步较晚,目前主要研究方法是《扬尘源颗粒物排放清单编制技术指南(试行)》[5].
道路积尘易在风或者车辆运动的作用下再悬浮[6],道路扬尘是排放清单中不可忽视的一部分[7],是城市颗粒物的主要来源之一. 随着机动车保有量日益增长,机动车排放标准逐步加严,道路扬尘(非尾气排放)在交通污染排放中的占比逐渐增大[8 − 9];而在当今机动车电动化的趋势下,欧洲部分地区现有研究表明电动汽车非尾气排放分别占交通排放PM10和PM2.5的90%以上和85%以上[10].
Bogacki等[11]的研究表明,克拉科夫(波兰南部)冬季和夏季的道路扬尘对PM10的贡献率分别达到25%和50%. 我国的研究也证实道路扬尘在扬尘排放中占比较大[12 − 14],北方部分城市扬尘对PM2.5的分担率为30%左右,而道路扬尘对城市扬尘的贡献率为50%[15]. 综上,由于道路扬尘对在扬尘排放中的重要地位,对道路扬尘排放清单开展研究十分必要. 目前国内外已有部分关于道路扬尘排放清单较详细的研究;国内外已构建了美国拉斯维加斯(Kuhns等[16])、英国伦敦(Patra等[17])、西班牙巴塞罗那(Amato等[18])、德里市(Singh等[19])、西安(张帅等[20],杨乃旺等[21])、北京(崔浩然等[22])、天津(许妍等[23])、珠江三角洲(彭康等[24])、武汉(祝嘉欣等[25])、成都(杨德容等[26])等多地的道路扬尘排放清单.
西宁市是国务院批复确定的中国西北地区重要的中心城市和内陆开放城市[27],在发展过程中城市建设以及路网建设步伐加快,道路扬尘排放特征备受关注. 西宁市2018年PM10和PM2.5日均浓度均超过国家二级质量标准,其大气污染不容忽视[28],虽已开展多项西宁市大气污染相关研究[29 − 31],但尚未关注到道路扬尘排放清单. 西宁人均道路面积从2012年底的7.15 m2增加至2022年的12.61 m2,西宁市道路扬尘排放清单的缺失对当地污染成因分析、预警预报等带来了较大的不确定性[32]. 本研究采用《扬尘源颗粒物排放清单编制技术指南(试行)》[5]和《城市大气污染源排放清单编制技术手册》(2018年8月)[33],通过实地采样与统计西宁市提供数据获取其活动水平和相关数据,建立2018年西宁市道路扬尘排放清单,并分析其分布特征,同时利用ArcGIS和蒙特卡罗模拟进行空间分配和不确定性分析.
-
研究范围为西宁市城东区、城中区、城西区、城北区、湟中县、大通回族土族自治县(以下简称大通县)、湟源县、生物园区、南川园区、东川园区、甘河园区和海湖新区.
-
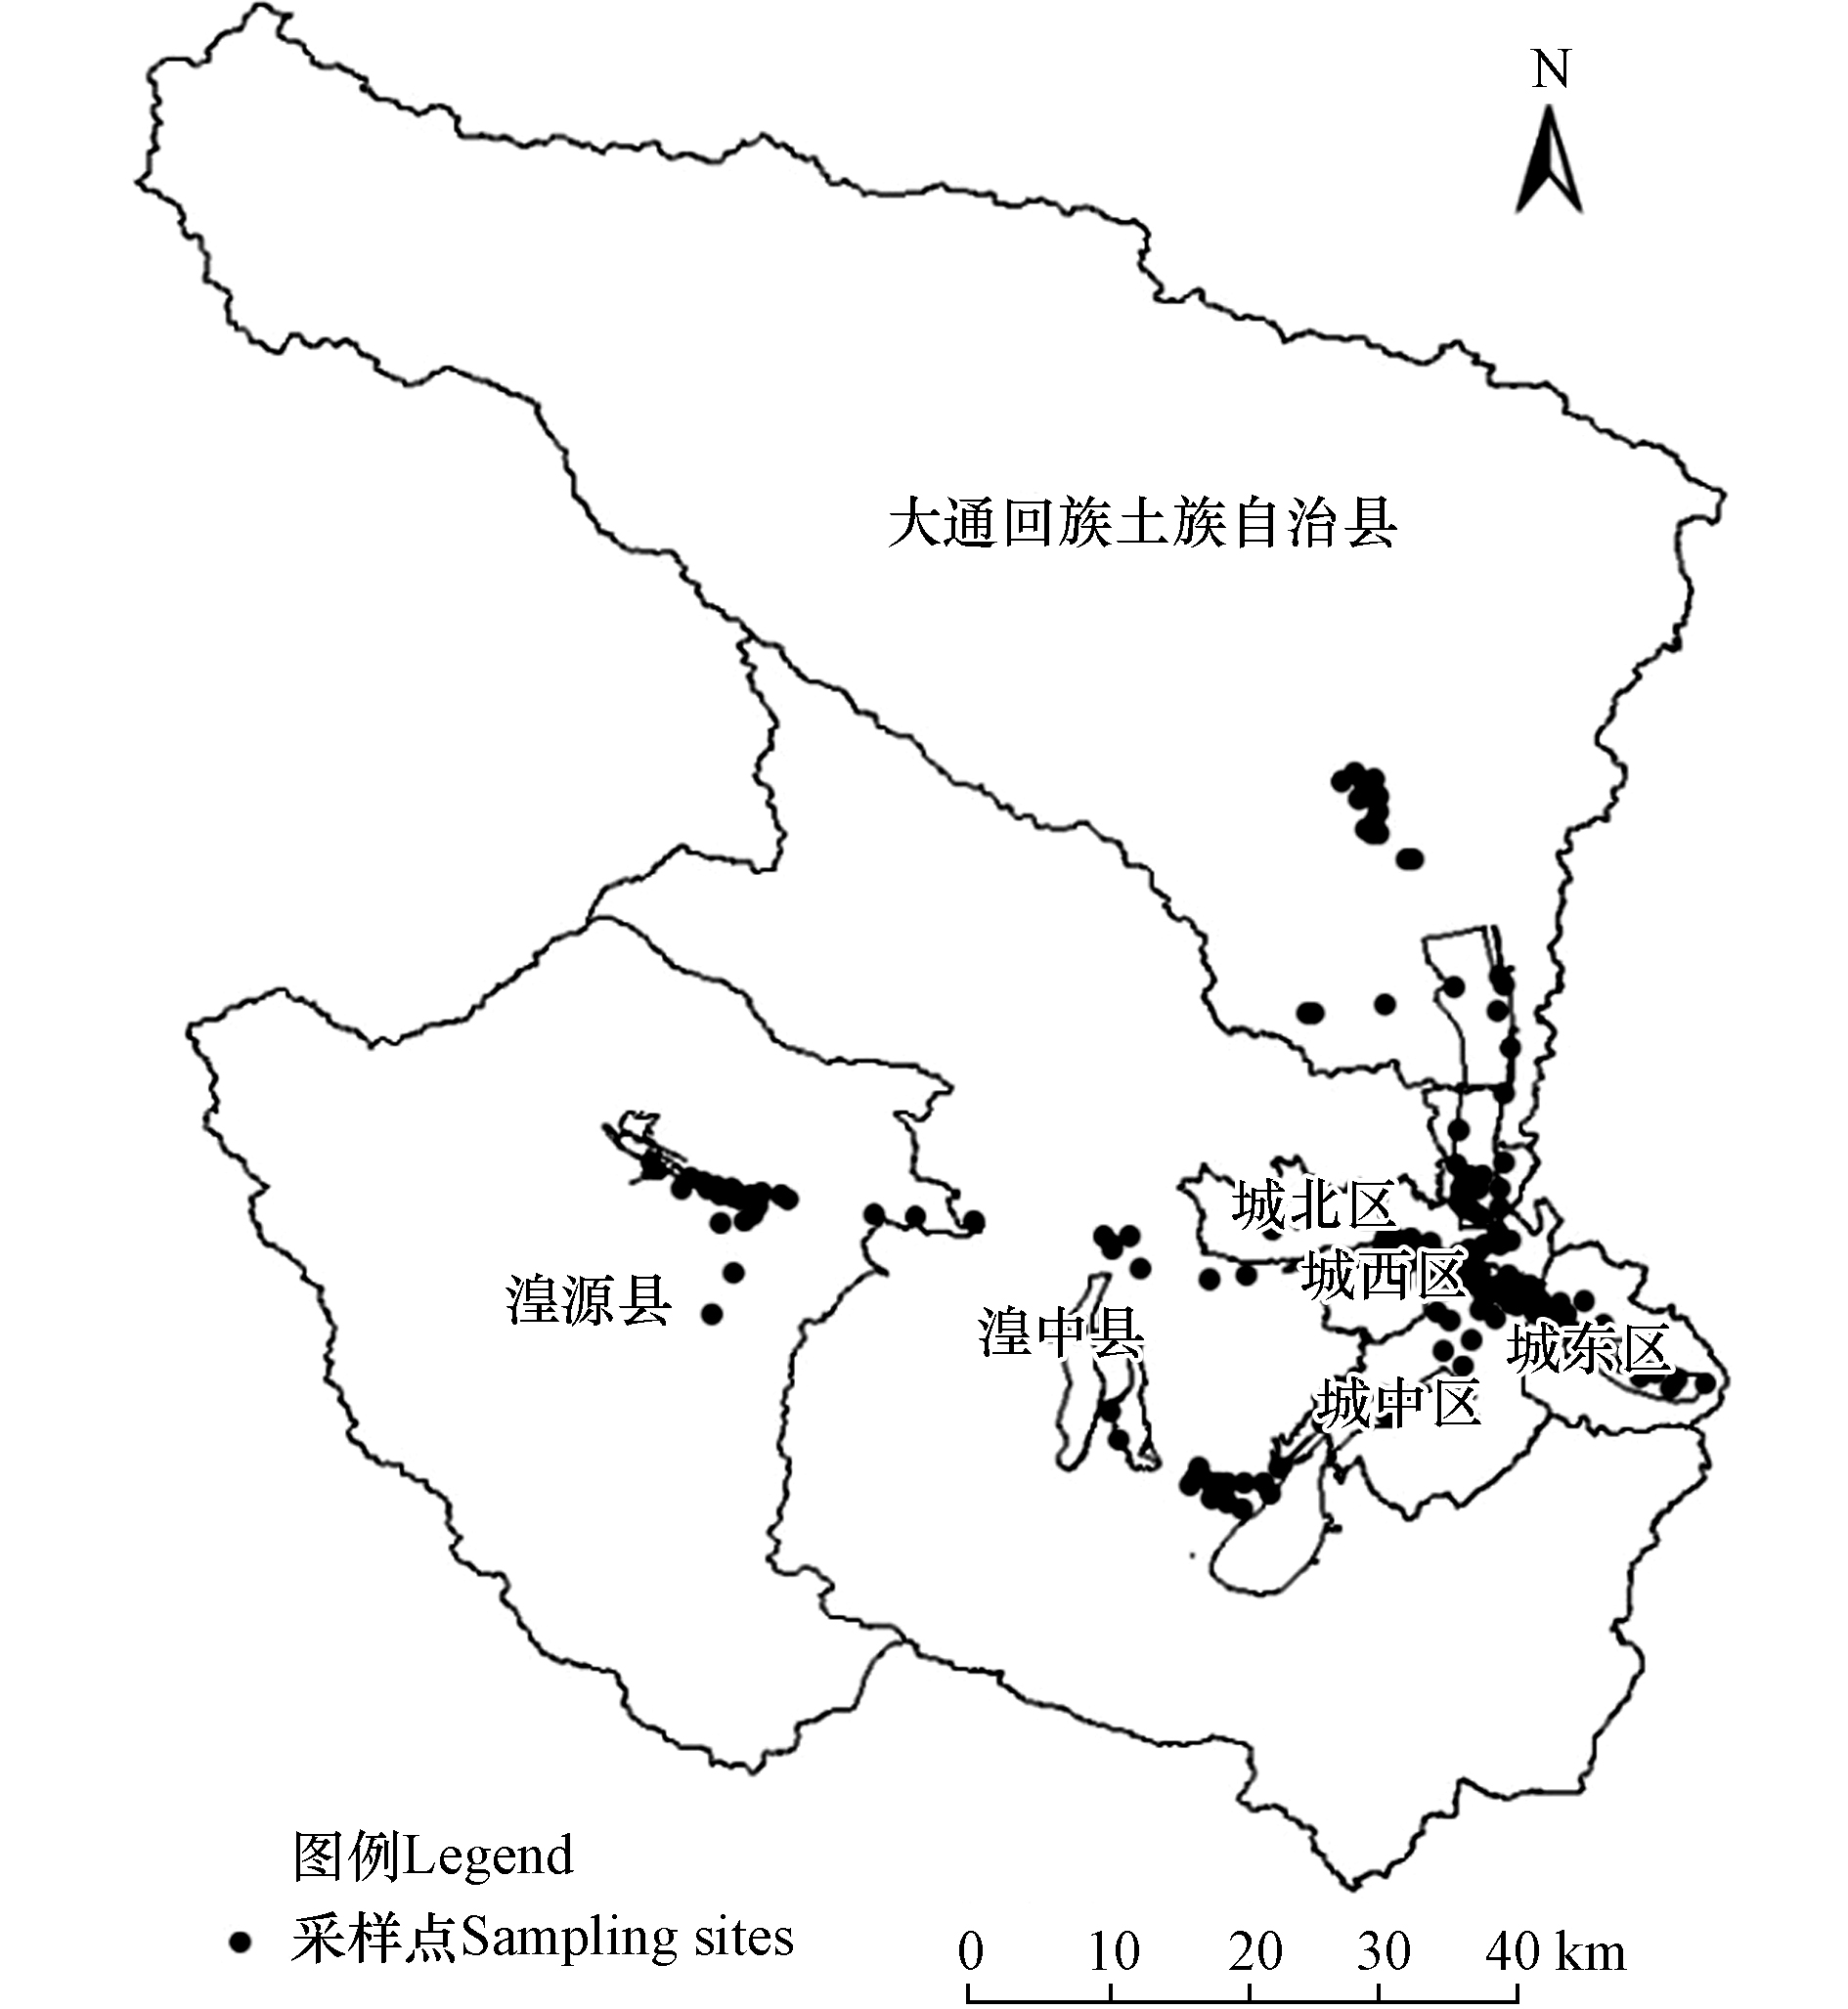
分别选取主干道、次干道、支路、环线、高速路、国道、省道等道路中具有代表性的路段采样. 依靠汽油发电机提供电力,每条道路采集一侧靠近非机动车道的两条车道,每个车道选取3个子点位,每个子点位采样面积约2—4 m2. 吸尘器吸尘后扫入纸袋,密封并编号保存,同时记录采样点位的地理位置、车流量、车道以及周边环境状况. 共采集78条铺装道路,获得353个道路扬尘样品,采样点位见图1. 将采集到的原始样品送回实验室后,去除烟头、杂草和垃圾等,在干燥器内平衡 3 d,将样品放入 200 目泰勒标准筛后,尽可能地多筛分下样品之后,称量并记下质量,然后再次筛分,直到两次筛分结 果相差不大时,记录下其质量.
-
排放因子计算方法:
式中,ERi为铺装道路扬尘PMi排放系数,g·(km·veh)−1; ki为产生的扬尘中PMi的粒度乘数,g·(km·veh)−1; sL为道路积尘负荷,g·m−2; W为平均车重,t; η为污染控制技术对扬尘的去除率,%.
(1)排放因子模型参数计算
粒度乘数ki,将过筛后的道路扬尘样品使用再悬浮采样器和便携式气溶胶粒径谱仪(OPS 3330)获得粒径分布数据,通过公式(2)计算得到每条道路每个车道的粒度乘数,计算得到不同行政区不同道路类型的铺装道路的粒度乘数.
式中,K2.5为修正后的PM2.5粒度乘数; L2.5和L10分别为基于OPS 3330得到的空气动力学当量直径小于等于2.5 µm和10 µm的颗粒物百分含量; K10为指南推荐的PM10粒度乘数,为0.62 g·(km·veh)−1.
(2)车重参数计算
通过西宁市及大通县、湟中县和湟源县公安交管局提供的24 h分车型的卡口数据和采样期间现场摄录视频信息获取车流量信息. 根据各种类型车辆的平均质量以及行驶在道路上机动车中不同类型车辆的比例计算车辆的平均车重,如式(3)所示:
式中,W为道路上车辆的平均质量,t;n为车辆的种类数; Wi为第i类车型的平均质量,t; ai为第i类车辆占道路上总车辆数的比例,%.
(3)积尘负荷参数计算
积尘负荷计算方法见公式(4).
式中,W为道路扬尘样品质量,g; W20为20目泰勒标准筛筛上物的质量,g; W200为200目泰勒标准筛筛上物的质量,g; S为采样面积,m2.
据式(4)得到各地区各道路类型的积尘负荷值,结果见表1.
-
道路的扬尘排放量计算公式:
式中,WRi为道路扬尘源中颗粒物PMi的总排放量,t·a−1; ERi为道路扬尘源PMi排放系数,g·(km·veh)−1; LR为道路长度,km; NR为一定时期内车辆在该段道路上的平均车流量,veh·a−1; P为不起尘小时数,使用降水量大于0.254 mm的小时数表示; N为基准年的小时数,与P对应.
1)道路长度
通过ArcGIS将研究区域路网图与土地利用现状图结合,城镇用地范围内的为城市道路(主干道、次干道和支路),城镇用地范围外的为国道、省道、县道和乡村道路. 利用ArcGIS计算道路长度,而由于现有电子地图中不包含未铺装道路,企业填报的厂区内部道路也均为铺装道路,因此,没有考虑未铺装道路,各行政区不同类型道路长度所占比例见图2.
2)车流量
平均车流量主要参考卡口数据以及通过现场摄录的视频计算得出,将一天划分为6个典型时间段,通过式(6)计算得到平均车流量.
式中,N为道路上行驶的机动车车流量,veh·h−1; n为道路上各个时间段内行驶的车流量数,veh·h−1. 各行政区道路年车流量所占比例如图3所示.
-
结合积尘负荷、平均车重等数据,利用式(1)计算得出西宁市不同等级道路扬尘PM10和PM2.5 的排放因子,结果见表2. 表2表明,西宁市不同类型道路的扬尘PM2.5和PM10的排放因子差异较大,总体来看公路的排放因子大于城市道路,其中县道排放因子最大,分别为0.60 g∙km−1和2.96 g∙km−1,主要影响因素是积尘负荷. 表1表明,公路积尘负荷总体大于城市道路,其中省道、县道和乡村道路积尘负荷较大,与支路接近;高速公路和国道积尘负荷较低,与主干道、次干道和快速路相近,这和排放因子规律相同.
这是因为省道、县道、乡村道路和支路较少有采取控制措施,基本未清扫或清扫频次较低,导致积尘负荷较高,排放因子较大. 高速公路和国道的车流量较大,车速较快且平均车重较大,道路积尘易被卷起,积尘负荷较低. 而主干道、次干道和快速路则会进行较为固定有规律的清扫,则积尘负荷较低.
本研究得出城市道路排放因子排序为支路>次干道>主干道>快速路,与其他城市道路扬尘研究的排放因子比较,结果见表3. 表3表明,西宁市与西安市(2018)、成都市、渭南市、衡阳市、武汉市和北京市的道路扬尘排放因子排序规律一致,而与西安市(2016)的道路扬尘排放因子排序规律不一致,这主要是因为近年来西安市实施“治污减霾,保卫蓝天”行动计划,加强对道路的清扫,降低了各类型道路的扬尘排放量[20].
-
根据PM2.5和PM10排放因子以及车流量等数据,通过式5计算出西宁市道路扬尘PM2.5和PM10排放量,得出各道路类型和各行政区道路扬尘排放量,见表4和表5.
表4表明,2018年西宁市道路扬尘PM2.5和PM10年排放量分别为1904.10 t和8563.09 t. 其中,国道排放量最大,PM2.5和PM10年排放量占比分别为41.79%和39.74%,这说明西宁市国道是道路扬尘的主要来源. 除了国道、高速公路和乡村道路之外,其他类型道路占比均小于10.00%,总体来看公路道路扬尘排放量大于城市道路,主要是因为公路的道路长度和排放因子大于城市道路.
表5表明,大通县道路扬尘PM2.5排放量最大,达到691.54 t,占全市总排放量的36.32%;其次是湟中县和湟源县,分别占17.61%和9.97%. PM10排放量较大的分别是大通县、湟中县和湟源县,分别占35.47%、19.42%和10.33%. 在市内四区中,城东区和城中区道路扬尘PM2.5和PM10排放量较大,城西区和城北区排放量较小. 4个园区道路扬尘PM2.5和PM10的排放量均较小,4个园区道路扬尘PM2.5和PM10排放量之和分别占全市总排放量的10.27%和10.69%. 这主要与各行政区园区的道路长度有关.
-
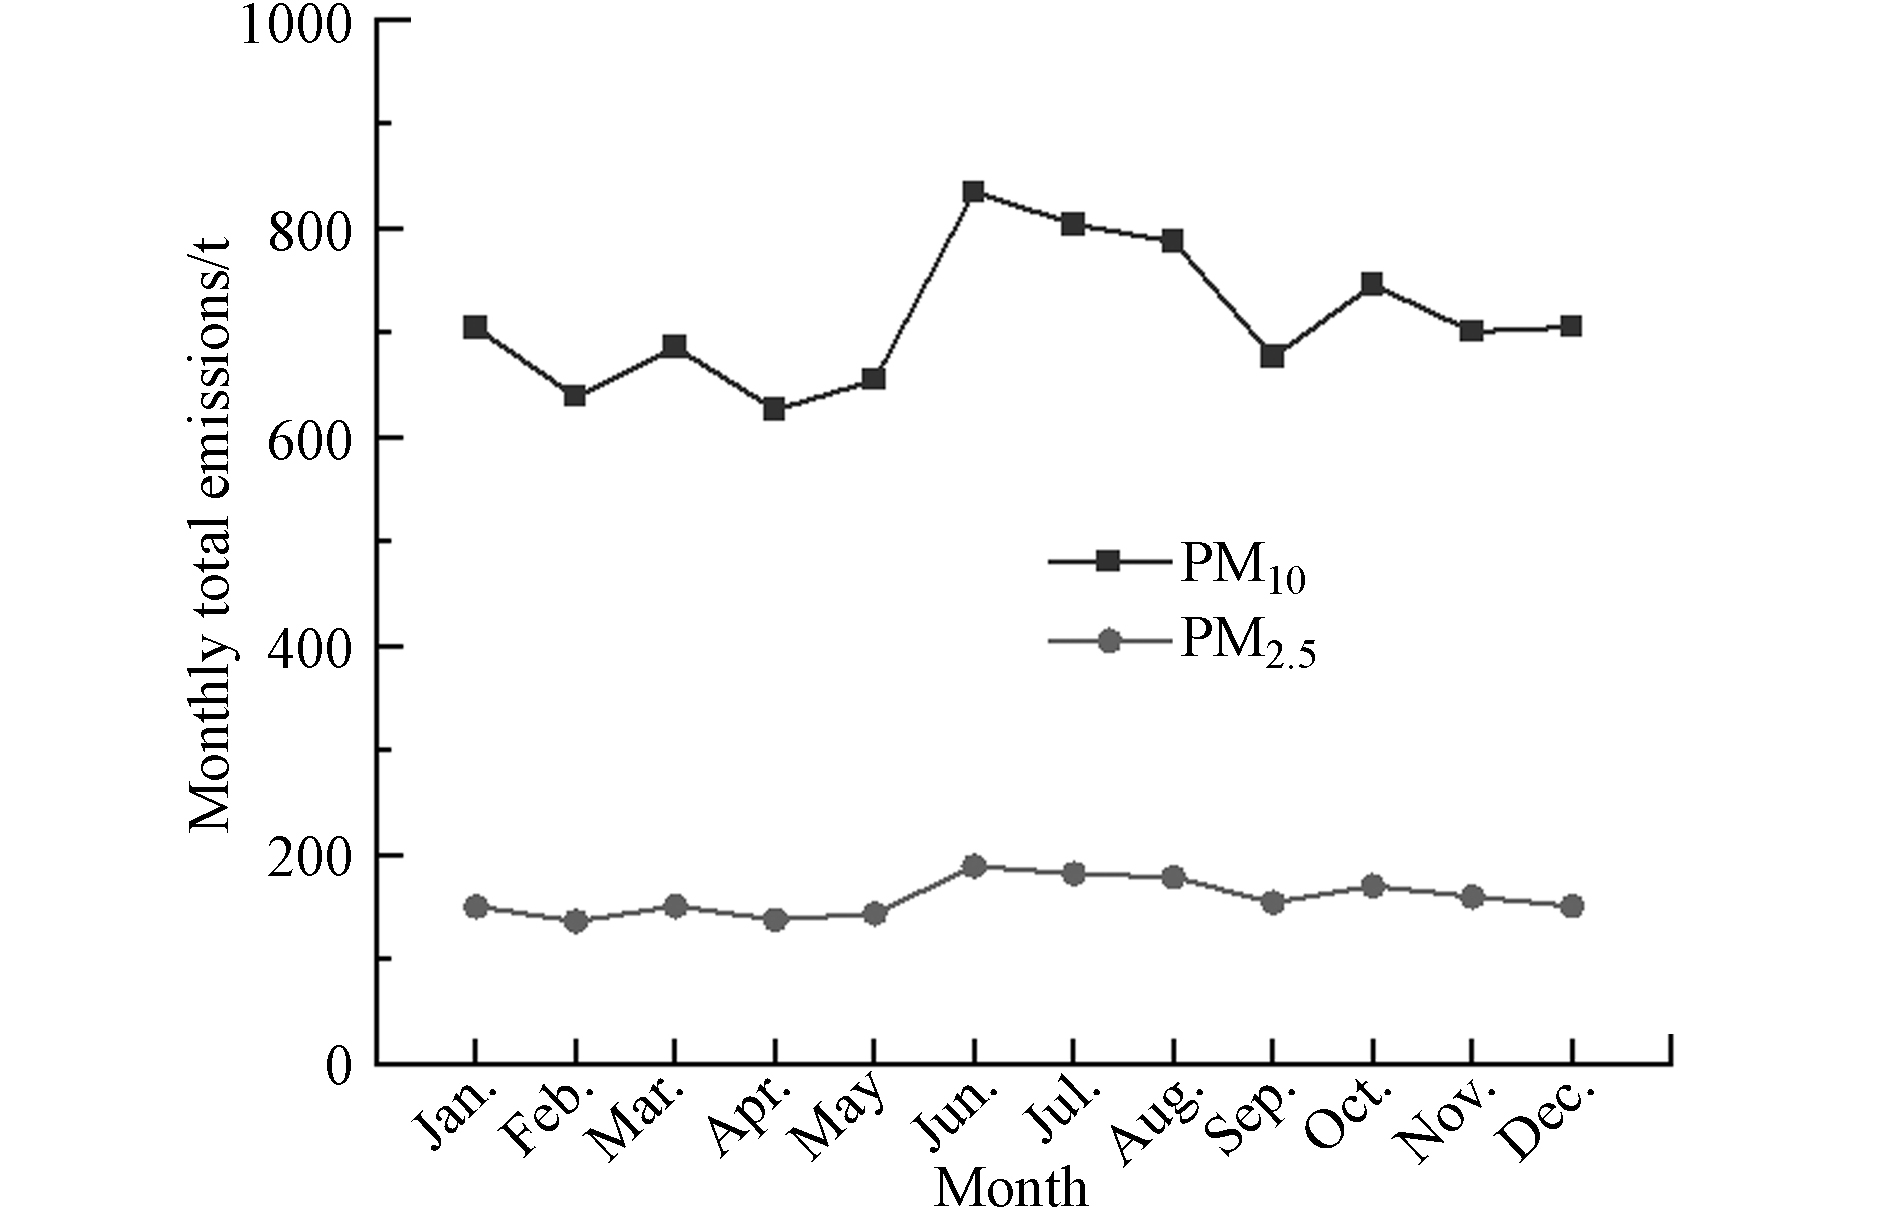
西宁市2018年12个月的道路扬尘排放量见图4. 图4表明,道路扬尘PM2.5和PM10排放在整年都有发生,由于受到车流量、平均车重、降水等的季节性变化的影响,各月道路扬尘PM2.5和PM10排放量稍有差别.
总体来看,春季、秋季和冬季排放量较为接近,均小于夏季;春季、秋季和冬季PM2.5和PM10年排放量范围分别为136.50—170.00 t和638.49—745.75 t,夏季PM2.5和PM10排放量范围在178.60—189.09 t和787.03—834.64 t,道路扬尘排放量最大值出现在6月份. 出现这种差异主要是因为夏季为西宁市旅游旺季且不起尘天数少于7月和8月,车流量大于其他季节,从而导致排放量较大.
应用ArcGIS软件将西宁市分成3 km×3 km的网格,统计每个网格内不同等级道路长度,再结合西宁市各行政区2018年不同等级道路扬尘PM2.5和PM10排放因子数据和各类型道路车流量,计算出每个网格2018年道路扬尘PM2.5和PM10排放量,得到西宁市各行政区道路扬尘PM2.5和PM10排放空间分布图,见图5. 由图5可知,西宁市道路扬尘源PM2.5和PM10的排放呈相似的空间分布特征,城中4区路网密集、车流量大,网格排放量较大. 各行政区排放量主要沿着国道分布,排放量主要集中在国道上. 这是因为由表2可知国道与支路、省道、县道及乡村道路相比虽然排放因子较低,但是道路长度及车流量较高;而其他类型道路排放因子与国道相近,但道路长度及车流量小于国道,因此综上可知排放量主要集中在国道上.
-
道路扬尘不确定性主要是来源于粒度乘数、控制效率、车流量、平均车重以及道路长度. 不同道路类型的道路长度来源于GIS地图道路图层;平均车重是根据道路各种车流量的大小和每种车型的平均车重计算得到各道路类型各季节的平均车重;积尘负荷是通过采样获取,这三者对结果不确定性的影响较小. 各道路的车流量一部分是2019年现场摄录得到,还有一部分是从交管部门获取的2018年和2019年部分道路的卡口数据,但不管是现场摄录还是从交管部门获取的卡口数据,获得具体车流量的道路为少数典型道路,其余的道路车流量均采用类比的方式获得,与其实际车流量有一定差别,且车流量是一个动态值,不同时间段的车流量有所差异,故其存在一定的不确定性.
本研究采用蒙特卡罗方法,使用Oracle Crystal Ball软件,定量分析了西宁市2018年道路扬尘排放清单的不确定性. 设定随机抽样次数10000次,在置信区间为95%的条件下,模拟得到2018年西宁市道路扬尘PM2.5和PM10的不确定性范围分别为-26.49%—51.11%和-30.14%—30.06%.
将所得结果与其他城市道路扬尘排放清单不确定性结果相比较,如西安市[20] 2018年道路扬尘PM2.5和PM10的不确定性的范围分别为-63.1%—60.3%和-62.5%—63.3%以及武汉市[25]2016年PM2.5和PM10的不确定性范围分别为-31.8%—30.5%和-31.3%—32.9%,本研究不确定性与西安市和武汉市相当,均较小.
-
(1)2018年西宁市道路扬尘PM2.5和PM10排放量分别为1904.10 t和8563.09 t,其中在不同道路类型中主要国道是主要排放来源,各行政区中排放主要集中在大通县.
(2)本研究中得到城市道路排放因子排序为支路>次干道>主干道>快速路.
(3)西宁市道路扬尘排放月际变化较小,夏季排放量较高,且在6月出现最高值.
(4)蒙特卡罗方法定量分析结果表明,在95%的概率分布范围内,西宁市2018年道路扬尘PM2.5和PM10不确定性范围分别为: -26.49%—51.11%和-30.14%—30.06%.
西宁市道路扬尘排放清单及时空分布特征
Road dust emission inventory and its spatial-temporal distribution characteristics in Xining
-
摘要: 本研究通过实地采样与调查获取活动水平及相关数据,采用排放因子法建立2018年西宁市道路扬尘排放清单. 利用ArcGIS进行3 km×3 km的空间分配,分析了其时空分布特征,利用蒙特卡洛模拟分析了道路扬尘排放清单的不确定性. 结果表明,2018年西宁市道路扬尘PM2.5和PM10排放量分别为1904.10 t和8563.09 t,其中国道贡献率最高,分别为41.79%和39.74%. 主要排放地区为大通县,贡献率分别为36.32%和35.47%. 道路扬尘排放在全年各月出现差异,其中在6月出现最高值. 蒙特卡罗模拟结果表明,在95%的概率分布范围内,西宁市2018年道路扬尘PM2.5和PM10不确定性范围为-26.49%—51.11%和-30.14%—30.06%.Abstract: Based on the activity level and other related data obtained from field sampling and investigating, the road dust emission inventory in Xining City in 2018 was established by the emission factor method. The spatial distribution of 3 km×3 km was carried out using ArcGIS, its spatiotemporal distribution characteristics were analyzed, and the uncertainty analysis of road dust inventory was estimated using Monte Carlo simulation. The results showed that in 2018, the total emissions of PM2.5 and PM10 from road dust in Xining City were 1904.10 t and 8563.09 t, and the contribution ratios of the national highway were the highest, 41.79% and 39.74%, respectively. The main emission area was Datong County, with contribution ratios of 36.32% and 35.47%. Road dust emissions varied from month to month throughout the year, with the highest emissions occurring in June. The Monte Carlo simulation results showed that within the probability distribution range of 95%, the uncertainty ranges of PM2.5 and PM10 of road dust in Xining City in 2018 were -26.49%—51.11% and -30.14%—30.06%.
-
Key words:
- road dust /
- emission inventory /
- space-time allocation /
- uncertainty analysis /
- Xining City.
-

-
表 1 西宁市不同类型道路积尘负荷(g∙m−2)
Table 1. The silt loading of different types of roads in Xining(g∙m−2)
道路类型
Roads type主干道
Major arterial次干道
Minor arterial支路
Collector road快速路Freeway 高速公路Expressway 国道
National road省道
Provincial road县道
County road乡村道路
Village road最小值 0.23 0.28 0.45 0.23 0.09 0.21 0.41 0.28 0.45 最大值 1.70 2.09 2.47 1.70 0.26 0.90 1.73 2.09 2.47 平均值 0.58 0.87 1.53 0.58 0.16 0.55 0.97 0.87 1.53 表 2 西宁市各类型道路PM10和PM2.5的排放因子(g∙km−1)
Table 2. Emission factors of PM10 and PM2.5 for various types of roads in Xining(g∙km−1)
主干道
Major
arterial次干道
Minor
arterial支路
Collector road快速路
Freeway高速公路
Expressway国道
National road省道
Provincial road县道
County
road乡村道路
Village roadPM10 0.69 0.94 2.37 0.69 0.43 0.90 1.22 2.96 2.47 PM2.5 0.16 0.21 0.53 0.16 0.08 0.22 0.25 0.60 0.56 表 3 西宁市道路扬尘PM2.5和PM10排放因子与其他城市比较
Table 3. Comparisons of PM2.5 and PM10 emission factors of road fugitive dust in Xining with other cities
研究区域
Region道路类型
Road type排放因子/(g∙km−1)
Emission factors文献来源
Reference研究区域
Region道路类型
Road type排放因子/(g∙km−1)
Emission factors文献来源
ReferencePM2.5 PM10 PM2.5 PM10 西宁
(2018)主干道 0.16 0.69 本研究 北京 主干道 0.29 1.20 刘俊芳等[34] 次干道 0.21 0.94 次干道 0.31 1.29 支路 0.53 2.37 支路 0.38 1.56 快速路 0.16 0.69 快速路 0.18 0.76 西安
(2018)主干道 0.04 0.15 张帅等[20] 西安(2016) 主干道 0.38 1.31 杨乃旺等[21] 次干道 0.25 1.03 次干道 0.55 1.89 支路 0.26 1.09 支路 0.48 1.66 环路 0.03 0.13 环路 0.38 1.31 渭南 主干道 0.25 1.02 巴利萌等[35] 衡阳 主干道 0.27 1.14 谢磊等[36] 次干道 0.37 1.52 次干道 0.29 1.18 支路 0.44 1.83 支路 0.33 1.37 环路 - - 快速路 - - 成都 主干道 0.15 0.68 杨德容等[26] 武汉 主干道 0.16 0.54 祝嘉欣等[25] 次干道 0.17 0.70 次干道 0.17 0.57 支路 0.28 1.15 支路 0.27 0.92 快速路 0.16 0.68 环路 0.10 0.36 表 4 西宁市不同道路类型PM10和PM2.5排放情况
Table 4. PM10 and PM2.5 emissions from different road types in Xining
道路类型
Roads typePM2.5 PM10 年排放量/t
Annual Emissions贡献率/%
Contribution rate年排放量/t
Annual Emissions贡献率/%
Contribution rate主干道 69.42 3.65 260.18 3.04 次干道 88.64 4.66 356.89 4.17 支路 130.81 6.87 526.02 6.14 快速路 37.51 1.97 131.09 1.53 高速公路 283.82 14.91 1526.42 17.83 国道 795.69 41.79 3403.18 39.74 省道 76.02 3.99 384.41 4.49 县道 8.16 0.43 33.76 0.39 乡村道路 362.12 19.02 1693.89 19.78 企业道路 51.91 2.73 247.24 2.89 合计 1904.10 100.00 8563.09 100.00 表 5 西宁市各行政区PM10和PM2.5排放情况
Table 5. PM10 and PM2. 5 emissions in different Administrative District of Xining
行政区名称
Administrative DistrictPM2.5 PM10 年排放量/t
Annual Emissions贡献率/%
Contribution rate年排放量/t
Annual Emissions贡献率/%
Contribution rate城东区 143.56 7.54 548.41 6.40 城中区 132.20 6.94 615.23 7.18 城西区 65.90 3.46 235.62 2.75 城北区 84.29 4.43 435.61 5.09 大通县 691.54 36.32 3037.74 35.47 湟中县 335.30 17.61 1663.27 19.42 湟源县 189.93 9.97 884.90 10.33 生物园区 28.09 1.47 123.74 1.45 南川园区 57.89 3.04 301.02 3.52 东川园区 43.13 2.27 158.64 1.85 甘河园区 66.52 3.49 330.97 3.87 海湖新区 65.75 3.45 227.92 2.66 合计 1904.10 100.00 8563.09 100.00 -
[1] 潘月云, 李楠, 郑君瑜, 等. 广东省人为源大气污染物排放清单及特征研究[J]. 环境科学学报, 2015, 35(9): 2655-2669. PAN Y Y, LI N, ZHENG J Y, et al. Emission inventory and characteristics of anthropogenic air pollutant sources in Guangdong Province[J]. Acta Scientiae Circumstantiae, 2015, 35(9): 2655-2669 (in Chinese).
[2] ZHOU Y, CHENG S, CHEN D, et al. A new statistical approach for establishing high-resolution emission inventory of primary gaseous air pollutants[J]. Atmospheric Environment, 2014, 94: 392-401. doi: 10.1016/j.atmosenv.2014.05.047 [3] 李冬, 陈建华, 张月帆, 等. 道路扬尘中PM2.5粒度乘数的测定方法及特征[J]. 环境科学, 2021, 42(4): 1642-1648. LI D, CHEN J H, ZHANG Y F, et al. Determination method and characteristics of particle size multiplier of PM2.5 in road dust[J]. Environmental Science, 2021, 42(4): 1642-1648 (in Chinese).
[4] 李贝睿. 长株潭区域大气污染物排放源清单研究[D]. 湘潭: 湘潭大学, 2016. LI B R. Pollution sources emission inventory research of Changsha-Zhuzhou-Xiangtan urban agglomeration[D]. Xiangtan: Xiangtan University, 2016 (in Chinese).
[5] 环境保护部. 扬尘源颗粒物排放清单编制技术指南(试行)[R]. 北京: 环境保护部科技标准司, 2014. Department of Environmental Protection. Technical guide for preparation of particulate emission inventory from dust sources (Trial)[R]. Beijing: Department of Science and Technology Standards, Ministry of Environmental Protection, 2014 (in Chinese).
[6] ABU-ALLABAN M, GILLIES J A, GERTLER A W, et al. Tailpipe, resuspended road dust, and brake-wear emission factors from on-road vehicles[J]. Atmospheric Environment, 2003, 37(37): 5283-5293. doi: 10.1016/j.atmosenv.2003.05.005 [7] JOSE J, SRIMURUGANANDAM B. Source apportionment of urban road dust using four multivariate receptor models[J]. Environmental Earth Sciences, 2021, 80(19): 1-16. [8] AMATO F, CASSEE F R, van der GON H A C D, et al. Urban air quality: The challenge of traffic non-exhaust emissions[J]. Journal of Hazardous Materials, 2014, 275: 31-36. doi: 10.1016/j.jhazmat.2014.04.053 [9] GUSTAFSSON M, BLOMQVIST G, JRLSKOG I, et al. Road dust load dynamics and influencing factors for six winter seasons in Stockholm, Sweden[J]. Atmospheric Environment: X, 2019, 2: 100014. doi: 10.1016/j.aeaoa.2019.100014 [10] TIMMERS V, ACHTEN P. Non-exhaust PM emissions from electric vehicles[J]. Atmospheric Environment, 2016, 134: 10-17. doi: 10.1016/j.atmosenv.2016.03.017 [11] BOGACKI M, MAZUR M, OLENIACZ R, et al. Re-entrained road dust PM10 emission from selected streets of Krakow and its impact on air quality[J]. E3S Web of Conferences, 2018, 28: 01003. doi: 10.1051/e3sconf/20182801003 [12] Office of Air Quality Planning and Standards, US EPA. National Air Pollutant Emission Trends: 1900-1998[R]. Ntis, 1995. [13] CHOW J, WATSON J. Review of PM2.5 and PM10 apportionment for fossil fuel combustion and other sources by the chemical mass balance receptor model[J]. Energy & Fuels, 2002, 16(2): 222-260. [14] THORPE A, HARRISON R M. Sources and properties of non-exhaust particulate matter from road traffic: A review[J]. Science of the Total Environment, 2008, 400(1/2/3): 270-282. [15] GENG N B, WANG J, XU Y F, et al. PM2.5 in an industrial district of Zhengzhou, China: Chemical composition and source apportionment[J]. Particuology, 2013, 11(1): 99-109. doi: 10.1016/j.partic.2012.08.004 [16] KUHNS H. Vehicle-based road dust emission measurement—Part Ⅱ: Effect of precipitation, wintertime road sanding, and street sweepers on inferred PM10 emission potentials from paved and unpaved roads[J]. Atmospheric Environment, 2003, 37(32): 4573-4582. doi: 10.1016/S1352-2310(03)00529-6 [17] PATRA A, COLVILE R, ARNOLD S, et al. On street observations of particulate matter movement and dispersion due to traffic on an urban road[J]. Atmospheric Environment, 2008, 42(17): 3911-3926. doi: 10.1016/j.atmosenv.2006.10.070 [18] AMATO F, KARANASIOU A, MORENO T, et al. Emission factors from road dust resuspension in a Mediterranean freeway[J]. Atmospheric Environment, 2012, 61: 580-587. doi: 10.1016/j.atmosenv.2012.07.065 [19] SINGH V, BISWAL A, KESARKAR A P, et al. High resolution vehicular PM10 emissions over megacity Delhi: Relative contributions of exhaust and non-exhaust sources[J]. Science of the Total Environment, 2020, 699: 134273. doi: 10.1016/j.scitotenv.2019.134273 [20] 张帅, 李光华, 邓顺熙, 等. 西安市典型道路扬尘排放清单及化学组分[J]. 环境科学学报, 2022, 42(6): 318-328. ZHANG S, LI G H, DENG S X, et al. Emission inventory and chemical compositions of fugitive dust sources at typical roads in Xi’an, China[J]. Acta Scientiae Circumstantiae, 2022, 42(6): 318-328 (in Chinese).
[21] 杨乃旺, 宋文斌, 闫东杰, 等. 基于积尘负荷的西安市铺装道路扬尘排放研究[J]. 环境科学学报, 2021, 41(4): 1259-1266. YANG N W, SONG W B, YAN D J, et al. Emission characteristics of pavement road dust in Xi’an based on dust load method[J]. Acta Scientiae Circumstantiae, 2021, 41(4): 1259-1266 (in Chinese).
[22] 崔浩然, 樊守彬, 韩力慧, 等. 北京市大兴区道路积尘年际变化特征及管控研究[J]. 中国环境科学, 2021, 41(10): 4556-4564. CUI H R, FAN S B, HAN L H, et al. Interannual variation characteristics and control of road dust in Daxing District of Beijing[J]. China Environmental Science, 2021, 41(10): 4556-4564 (in Chinese).
[23] 许妍, 周启星. 天津城市交通道路扬尘排放特征及空间分布研究[J]. 中国环境科学, 2012, 32(12): 2168-2173. XU Y, ZHOU Q X. Emission characteristics and spatial distribution of road fugitive dust in Tianjin, China[J]. China Environmental Science, 2012, 32(12): 2168-2173 (in Chinese).
[24] 彭康. 珠江三角洲地区铺装道路扬尘PM10化学元素组分特征研究[J]. 化工管理, 2015(20): 209-210. PENG K. Chemical element composition characteristics of dust PM10 from paved roads in Pearl River Delta[J]. Chemical Enterprise Management, 2015(20): 209-210 (in Chinese).
[25] 祝嘉欣, 成海容, 虎彩娇, 等. 武汉市道路扬尘源排放清单及空间分布特征研究[J]. 南京信息工程大学学报(自然科学版), 2018, 10(5): 557-562. ZHU J X, CHENG H R, HU C J, et al. Study on the load distribution characteristics and source emission inventory of road dust in the city of Wuhan[J]. Journal of Nanjing University of Information Science & Technology (Natural Science Edition), 2018, 10(5): 557-562 (in Chinese).
[26] 杨德容, 叶芝祥, 杨怀金, 等. 成都市铺装道路扬尘排放清单及空间分布特征研究[J]. 环境工程, 2015, 33(11): 83-87. YANG D R, YE Z X, YANG H J, et al. Emission inventory and spatial distribution of paved road fugitive dust in Chengdu in Sichuan Province[J]. Environmental Engineering, 2015, 33(11): 83-87 (in Chinese).
[27] 国务院关于西宁市城市总体规划的批复[J]. 中华人民共和国国务院公报, 2016(1): 50-51. [28] 林宇, 姬亚芹, 林孜, 等. 西宁市土壤扬尘排放清单构建及时空分布特征[J]. 环境化学, 2022, 41(12): 4006-4015. LIN Y, JI Y Q, LIN Z, et al. Construction of emission inventory and temporal-spatial distribution of soil fugitive dust in Xining, China[J]. Environmental Chemistry, 2022, 2022, 41(12): 4006-4015 (in Chinese).
[29] 窦筱艳, 赵雪艳, 徐珣, 等. 应用化学质量平衡模型解析西宁大气PM2.5的来源[J]. 中国环境监测, 2016, 32(4): 7-14. DOU X Y, ZHAO X Y, XU X, et al. Source apportionment of PM2.5 in Xining by the chemical mass balance[J]. Environmental Monitoring in China, 2016, 32(4): 7-14 (in Chinese).
[30] 胡晓峰, 赵露, 李佳, 等. 西宁取暖季PM2.5水溶性离子的污染特征研究[J]. 环境污染与防治, 2019, 41(1): 95-100. HU X F, ZHAO L, LI J, et al. Research on pollution characteristics of water-soluble ions in PM2.5 during heating season in Xining[J]. Environmental Pollution & Control, 2019, 41(1): 95-100 (in Chinese).
[31] 杨益, 姬亚芹, 高玉宗, 等. 西宁市农牧源氨排放清单及其分布特征[J]. 环境科学, 2022, 43(4): 1844-1852. YANG Y, JI Y Q, GAO Y Z, et al. Agricultural ammonia emission inventory and its distribution in Xining city[J]. Environmental Science, 2022, 43(4): 1844-1852 (in Chinese).
[32] 啸宇. 187条路17座桥, 见证“西宁速度”[N]. 西宁晚报, 2022-09-20(A03). [33] 贺克斌. 城市大气污染源排放清单编制技术手册[R]. 北京: 清华大学, 2018. HE K B. Technical manual for preparation of discharge inventory of urban air pollution sources[R]. Beijing: Tsinghua University, 2018 (in Chinese).
[34] 刘俊芳, 樊守彬, 郭秀锐, 等. 基于车载移动监测的北京市丰台区道路扬尘源排放特征[J]. 环境科学学报, 2021, 41(11): 4423-4429. LIU J F, FAN S B, GUO X R, et al. Emission characteristics of fugitive dust sources on roads in Fengtai District, Beijing based on vehicle-mounted mobile monitoring[J]. Acta Scientiae Circumstantiae, 2021, 41(11): 4423-4429 (in Chinese).
[35] 巴利萌, 邓顺熙, 汪晶发, 等. 渭南主城区道路积尘负荷及交通扬尘颗粒物排放[J]. 环境污染与防治, 2020, 42(3): 353-357. BA L M, DENG S X, WANG J F, et al. Road dust loading in main urban area of Weinan and particulate matters emission released by vehicle fugitive dust[J]. Environmental Pollution & Control, 2020, 42(3): 353-357 (in Chinese).
[36] 谢磊, 丁艳纯, 史玲. 衡阳市主城区道路扬尘排放特征及影响因素[J]. 环境保护与循环经济, 2019, 39(4): 69-74. XIE L, DING Y C, SHI L. Characteristics and influencing factors of road dust emission in Hengyang city[J]. Environmental Protection and Circular Economy, 2019, 39(4): 69-74 (in Chinese).
-


 下载:
下载:


