-
土壤背景值(以下简称“背景值”),指在未受到人为干扰土壤成分的组成和各组分(元素)的含量[1]. 地球化学背景(Geochemical Background)的概念起源于勘查地球化学,是指无矿地质体中元素的正常丰度或者一个地区元素含量的正常变化[2 − 3]. 研究土壤背景值,有助于准确把握土地实际状况,对相关行业及标准的制定具有十分重要的参考价值. 土壤环境背景值和临界值的研究是环境土壤学研究的一项重要的基础工作,它对于评价土壤环境质量,确定土壤的环境容量等起着重要的作用[4],还是指导土壤重金属污染监测、评价及治理工作的基础[5]. 土壤重金属污染的隐蔽性和滞后性已然成为危害民众健康的隐形杀手,这主要涉及到“农用地-粮食安全”和“建设用地-人居环境”的健康发展,是关乎国家发展战略的重要基础保障. 此前,许多国家都开展了土壤背景值的研究工作[6 − 8]. 1982年国家将环境背景值调查研究列入“六五”科技攻关项目,在国家环保局、中国环境监测总站牵头下完成了对松辽平原土壤环境背景值调查的研究工作[9]. 1986年国家"七五"科技攻关计划实施期间完成了“全国土壤环境背景值调查研究”的相关课题[10],此后出版的《中国土壤元素背景值》(以下简称“前人研究”)是相关研究的重要参考,但该研究在贵州省仅有50个土壤样点,对探究全省土壤重金属的本底状况不够充分.
背景值应根据数据的分布特征采用不同方法表示,在其符合正态分布的情况下,一般可用算术均值表征元素背景值;当数据符合对数正态分布的情况下,可采用几何均值表示元素背景含量的集中趋势[11]. 自从Ahrens在花岗岩中发现元素的分布服从对数正态分布以来,勘查地球化学家通过对地球化学数据分布形式(正态或对数正态)的检验,来计算地球化学背景值[12 − 13]. 夏增禄认为土壤重金属背景值应该是一个表征该元素含量集中分布趋势的特征值,而不是一个具体的数值[14]. 因此,土壤重金属的背景值该如何确定,目前并没有统一的要求[15].
本文在2018年以贵州省自然土壤的镉(Cd)、钴(Co)、铬(Cr)、铜(Cu)、锰(Mn)、镍(Ni)、铅(Pb)、锌(Zn)、砷(As)和汞(Hg)为研究对象,针对贵州省自然土壤重金属含量及分布状况进行较为全面的调查,重新提出贵州省土壤重金属的背景值,由于距 “六五”和“七五”的研究间隔较长,因此,可为今后相关科研和农业生产提供更加准确、可靠的信息.
-
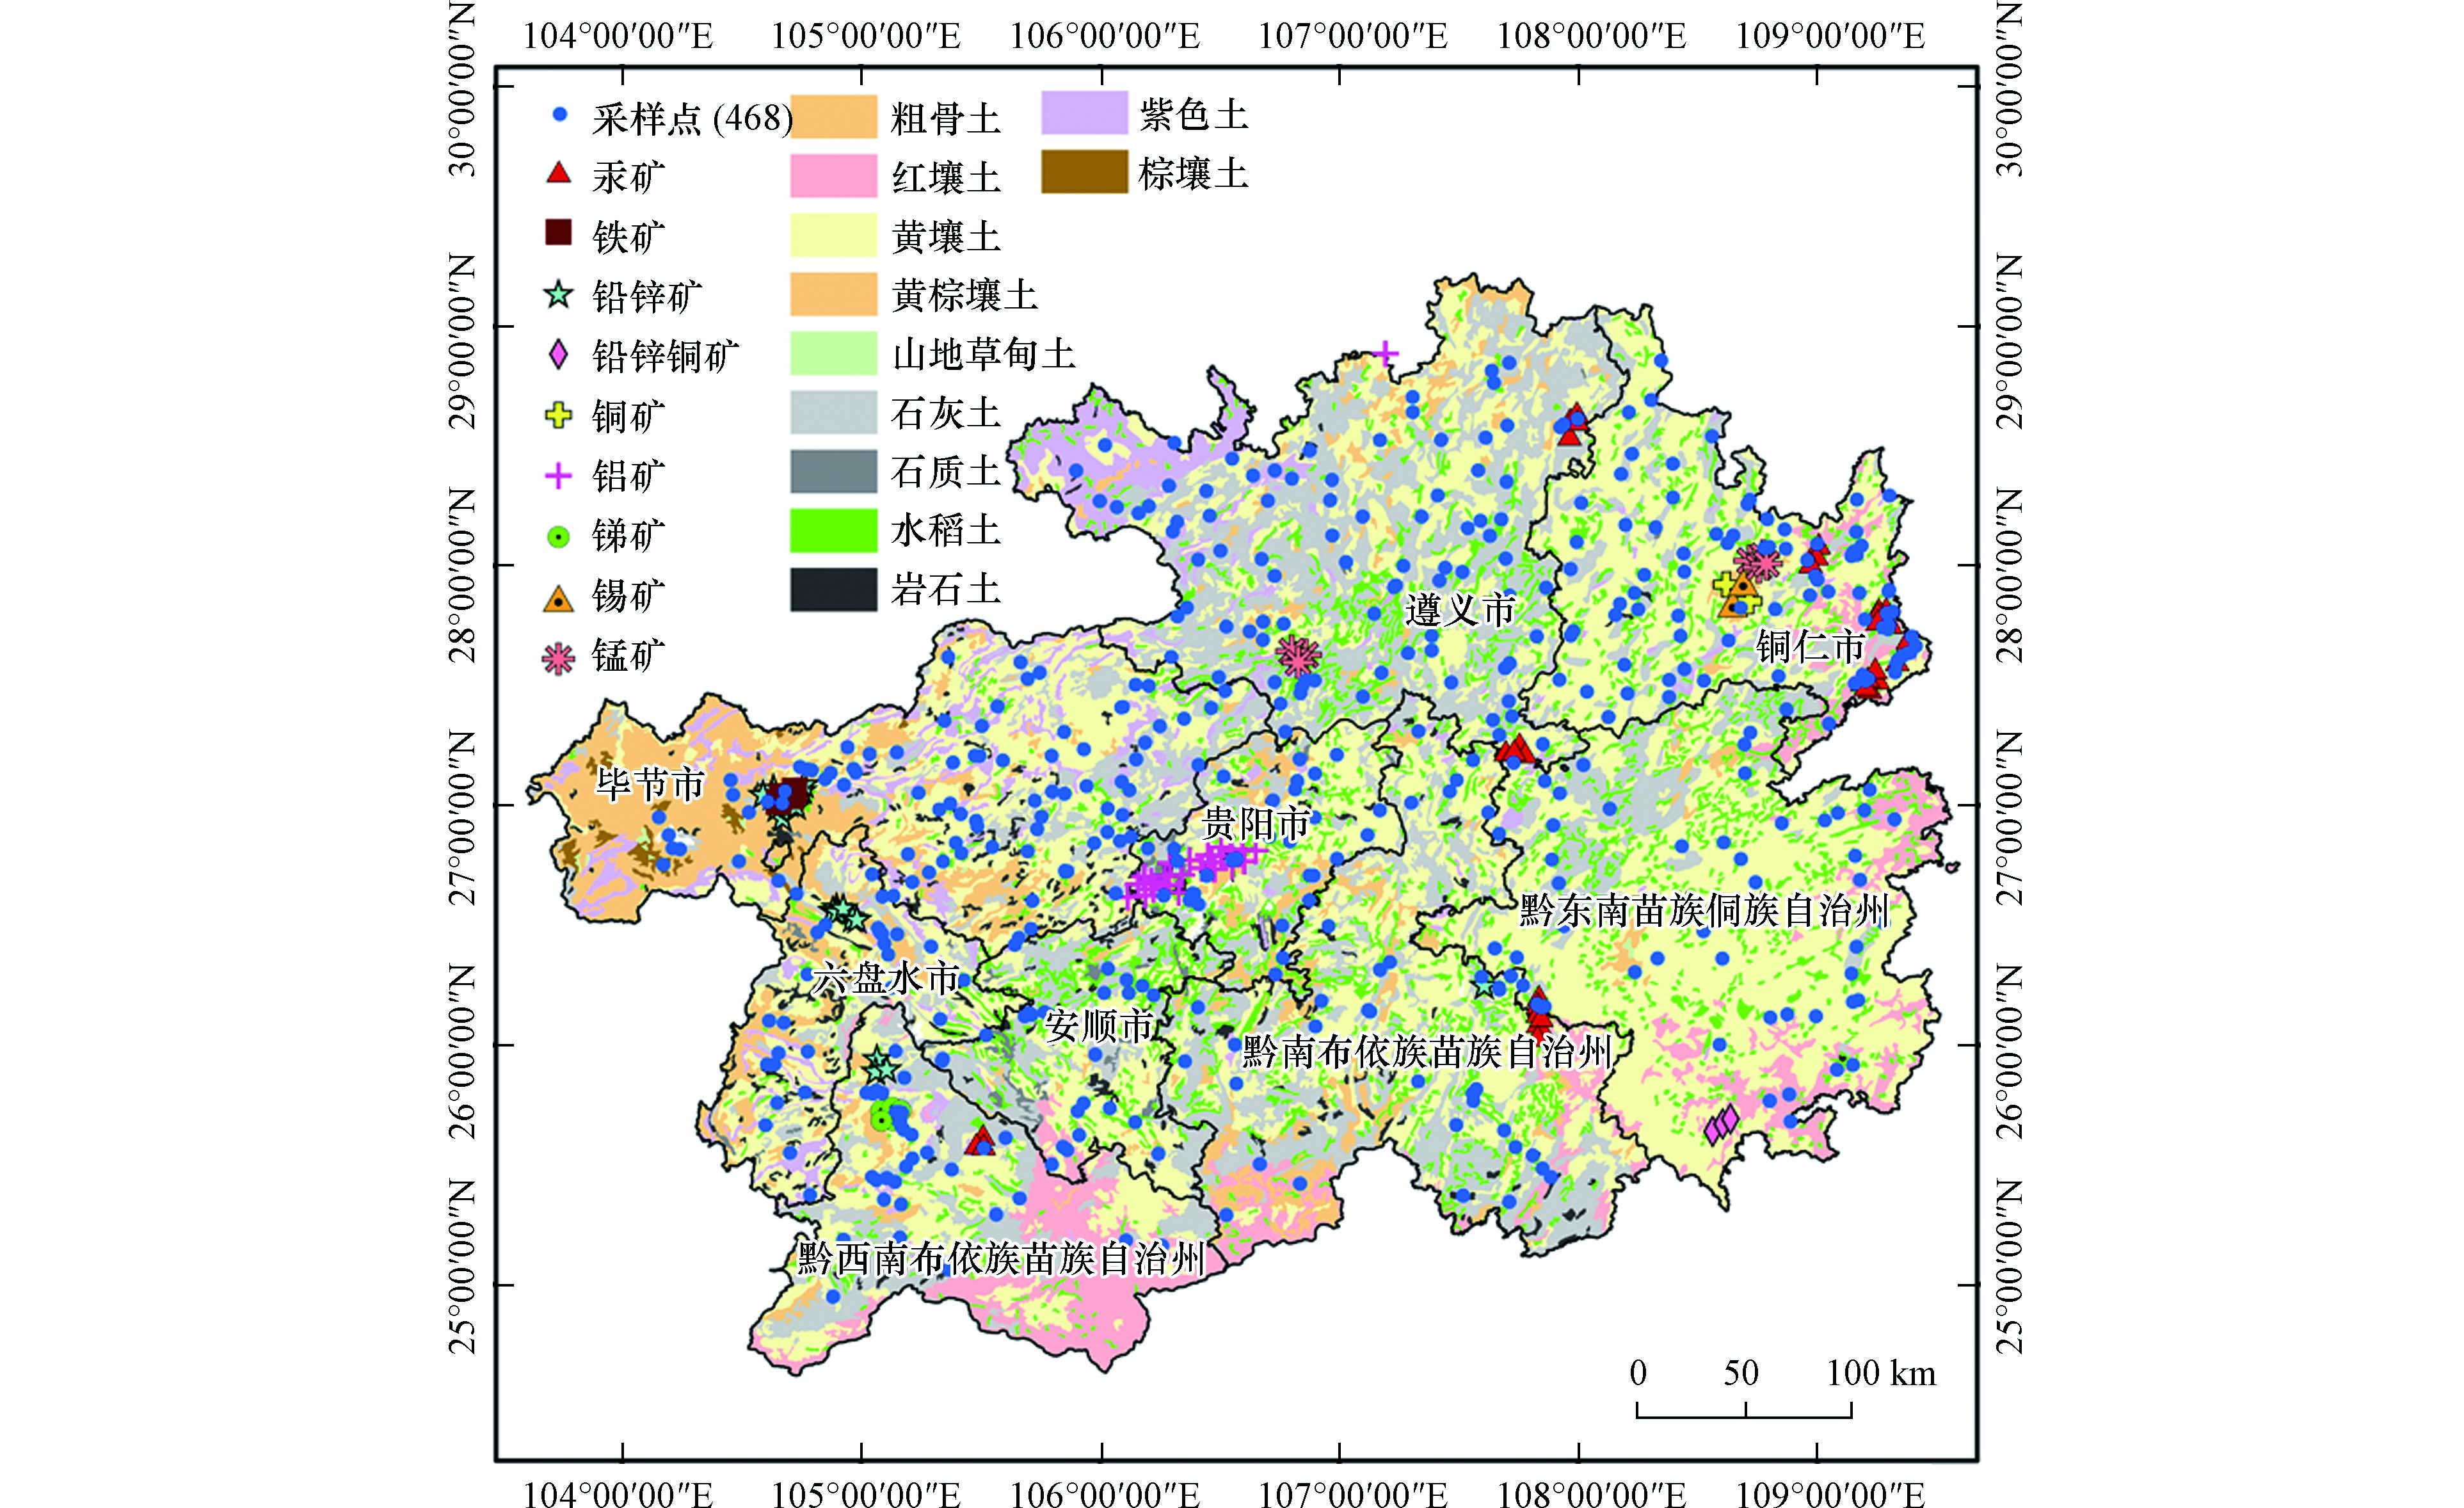
截至目前,贵州省下辖6个地级市和3个自治州(图1). 其中地级市有安顺市(文中简称“安顺”)、毕节市(文中简称“毕节”)、贵阳市(文中简称“贵阳”)、六盘水市(文中简称“六盘水”)、铜仁市(文中简称“铜仁”)、遵义市(文中简称“遵义”);3个自治州分别为黔西南布依族苗族自治州(文中简称“黔西南”)、黔南布依族苗族自治州(文中简称“黔南州”)和黔东南苗族侗族自治州(文中简称“黔东南”).
贵州省地处云贵高原东部,东靠湖南,南邻广西,西毗云南,北连四川和重庆. 省内地形地貌复杂,土壤类型多样,是西南喀斯特(岩溶)地区的中心地带,直接影响土壤的发育与分布[16]. 以贵州为中心的西南岩溶地貌区域占我国土地面积的1/3,全省面积的62%属喀斯特地貌区[17]. 贵州省矿产资源丰富,有42种矿产资源储量排名居全国前十,矿产储量排名居全国前三位的有20种,还是我国十大有色金属产区之一[18 − 19].
-
样品采集:采样时间为2018年7—10月,本次场调工作共采集自然土壤样品468 个(图1),涉及粗骨土(13 个)、红壤土(28 个)、黄壤土(213 个)、黄棕壤土(24 个)、山地草甸土(1个)、石灰土(111 个)、石质土(1 个)、水稻土(52 个)、岩石土(7 个)、紫色土(14 个)、棕壤土(4 个),共11 个土壤类型. 采集的土壤样品均来自道路沿线附近(远离道路300 m以上的区域)[10],除水稻土外,其余样品均为远离工农业活动、没有或人为影响小的自然林地和荒草地的自然土壤. 为了尽量降低环境对土壤的影响,采样时先去除0—20 cm表层土,收集20 cm以下的土壤作为样品,每个土样保留不少于1 kg,均采用单点法和随机采样的原则进行,平均布点密度约为19×19 km2.
样品前处理:土壤样品从采集到前处理的整个过程未曾接触过金属工具,以防人为因素导致样品受到污染. 土壤样品需在室内自然风干,拣出杂质,用木槌捣碎后,再用玛瑙研钵研碎,过0.149 mm尼龙筛,保存在信封中,用于测定土壤重金属含量.
样品检测与质量控制:Cd、Co、Cr、Cu、Mn、Ni、Pb和Zn采用U.S. EPA的HNO3-H2O2法进行消解[20],并用电感耦合等离子体发射光谱(ICP-OES)和电感耦合等离子体质谱(ICP-MS)测定含量;而As和Hg用1:1王水浸提法进行消解[21],用原子荧光形态分析仪(AFS-9700)测定含量. 分析过程中加入石灰岩土壤标准物质(GSS-4)进行质量控制,其Cd、Co、Cr、Cu、Mn、Ni、Pb、Zn、As和Hg回收率分别为86.4%—96.4%、88.6%—93.2%、89.7%—105.3%、94.6%—103.2%、85.5%—94.7%、86.5%—98.5%、84.7%—105.7%、75.2%—96.4%、96.0%—108%和 83.7 %—98.1%. 随机选取10%的样品进行重复测试,相对误差在±5%以内[22].
数据处理:所有数据均通过Microsoft Office Excel 2019进行录入和整理,利用IBM SPSS Statistics 23对数据进行统计分析,通过该软件的 Kolmogorov-Smirnov正态性检验模块对数据进行正态检验. 利用ArcGIS10.7、OriginPro2022进行相关图形的绘制工作. 原始数据中的离群值,沿用前人研究的方法(PauTa法)进行剔除[10,23],便于两次研究的对比. 本研究“省域推荐值”的剔除比例为0.2%—1.7%、“市域推荐值”的剔除比例为1.2%—4.0%,“土类推荐值”的剔除比例为0.5%—4.2%,在全国样本统计中各元素异常值剔除比例介于0.5%—6.8%,平均剔除数据为2.8%[10].
-
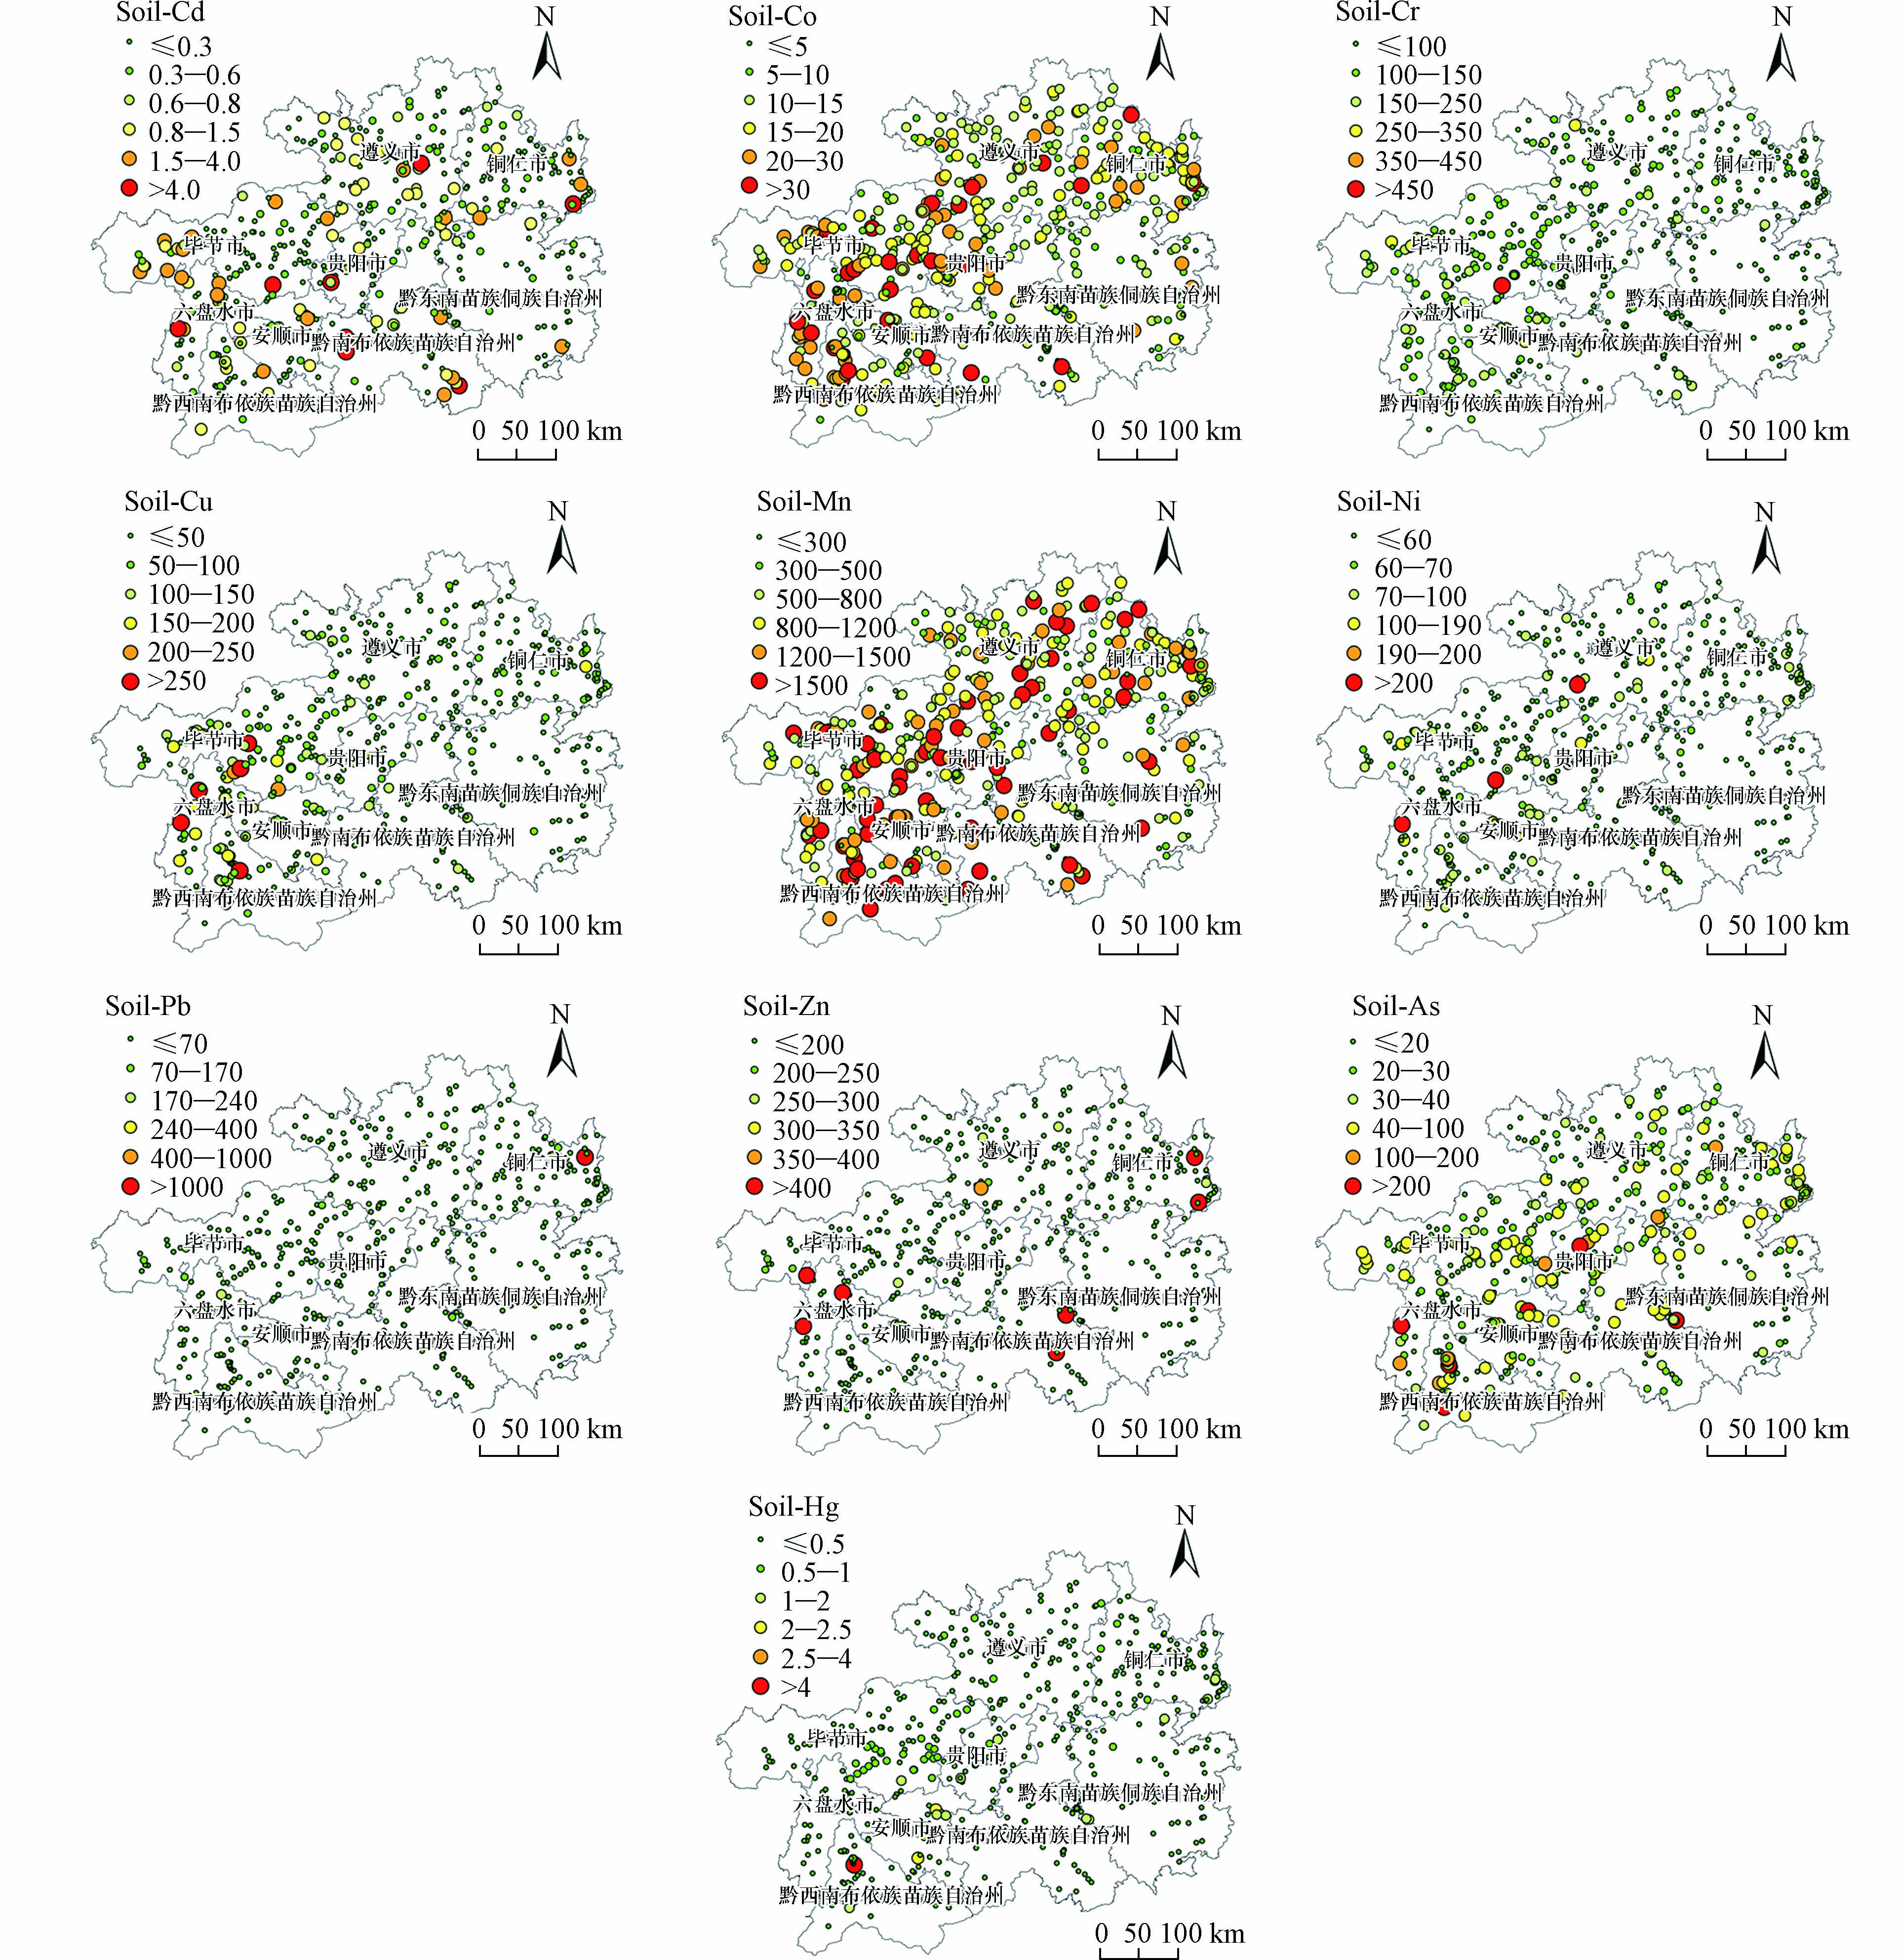
图2为贵州省自然土各重金属含量的空间分布情况. 为更好反映各元素含量在全省的均值水平,需对数据进行整理,表1为数据的基本统计情况,其原数据的偏度远大于0,峰度远大于3,经正态检验(K-S检验)均不符合正态分布(P<0.05);经对数转换后,仅有Cu和Hg符合正态分布(P>0.05),而其余元素仍不符合,但偏度都介于±1之间,因此可视为对称分布. 在数据统计中往往会因离群值的存在导致数据失真,对此,可采用剔除离群值的方式进行优化. 优化后,数据上、下侧未有明显异常值出现;另外,其偏度和峰度较原数据都有所减小,经正态检验,均不符合正态分布(P<0.05);对数转换后,Cu、Ni、Zn、As和Hg符合正态分布(P>0.05),其余元素通过偏度系数判断呈对称分布.
变异系数可反应元素含量在空间分布的离散程度. 将原数据同剔除一次离群值的数据进行比对(表2),Pb、As含量的变异系数的偏差最大,分别减小超过186.77%、102.80%;其次Cd、Zn、Ni、Hg分别减小超过31.09%、65.35%、30.06%、19.45%;其余元素减小均低于11.00%. 说明自然土中Cd、Ni 、Pb、Zn、As和Hg的含量存在较多的高、低值点位. 将剔除一次离群值的数据和多次迭代剔除的数据进行比较(表3),除Zn以外,其离散程度的变化均小于7.00%,证明变异系数受异常点位的影响较大,而在剔除一次离群值后,数据的离散程度趋于稳定(与多次迭代剔除相比较).
均值可反映元素含量的集中趋势,其中几何均值、中位数和采用剔除离群值的方法可有效削弱高值在均值计算中的权重,使最终结果接近实际. 有研究表明,原始数据在偏态分布下以多次迭代剔除离群值的方法修正均值,对数据信息的损失较大,会影响原有数据的集中趋势[24]. 而剔除的数据在找矿地球化学研究中往往包含重要信息,在环境地球化学评价中是包含污染信息的数据,这种方法会忽视实际数据所隐含的真实状况[25]. 为避免异常点位对整体数据造成偏差,采用剔除一次离群值的方式(下文中“市域推荐值”和“土类推荐值”都以此为基础进行分类统计),以保证最终取值的可信度.
根据优化前后数据偏差的对比,各元素的中位数偏差更接近原数据. 结合数据(剔除一次离群值的数据)的分布特征判断, Cu、Ni、Zn、As和Hg的含量用几何均值表示,而Cd、Co、Cr、Mn、Pb的含量用中位数表示更为合理. 综上所述,贵州省自然土中重金属含量的推荐值分别为:ω(Cd)0.220 mg·kg−1、ω(Co)12.35 mg·kg−1、ω(Cr)87.68 mg·kg−1、ω(Cu)33.70 mg·kg−1、ω(Mn)668.7 mg·kg−1、ω(Ni)33.99 mg·kg−1、ω(Pb)19.91 mg·kg−1、ω(Zn)88.88 mg·kg−1、ω(As)21.29 mg·kg−1和ω(Hg)0.151 mg·kg−1.
-
表4为前人研究(文献[10])的相关数据,以省域推荐值与其比较(表5),差异明显,Hg含量的偏差最大,达到77.41%;Co、Cu、Pb、As的含量偏差均超过25%;其次,Cd、Cr、Mn、Ni、Zn的含量偏差较小,均低于8%. 导致数据偏差的原因首先与样本数量的增加有直接关系,本研究的采样密度约为每点19×19 km2,而前人研究中的采样密度仅为每个点59×59 km2. 其次,采样方式的不同也是造成数据偏差的重要原因. 本次的采样点均为道路沿线展开的随机采样,这种方式更贴近社会的活动区域,对样点附近的生产、生活指导性更强,但也因此易受人为因素的干扰;而前人研究则采用均匀布点的方式进行,这种方式更利于表达地理空间中的宏观分布,但若出现点位数据异常则易造成局部地区偏低或偏高的估计. 因此,两种采样方式各有优劣. 另外,两次研究的间隔时间较长,在此期间我国工业和城市化发展迅速,导致生态环境也发生了巨大变化.
-
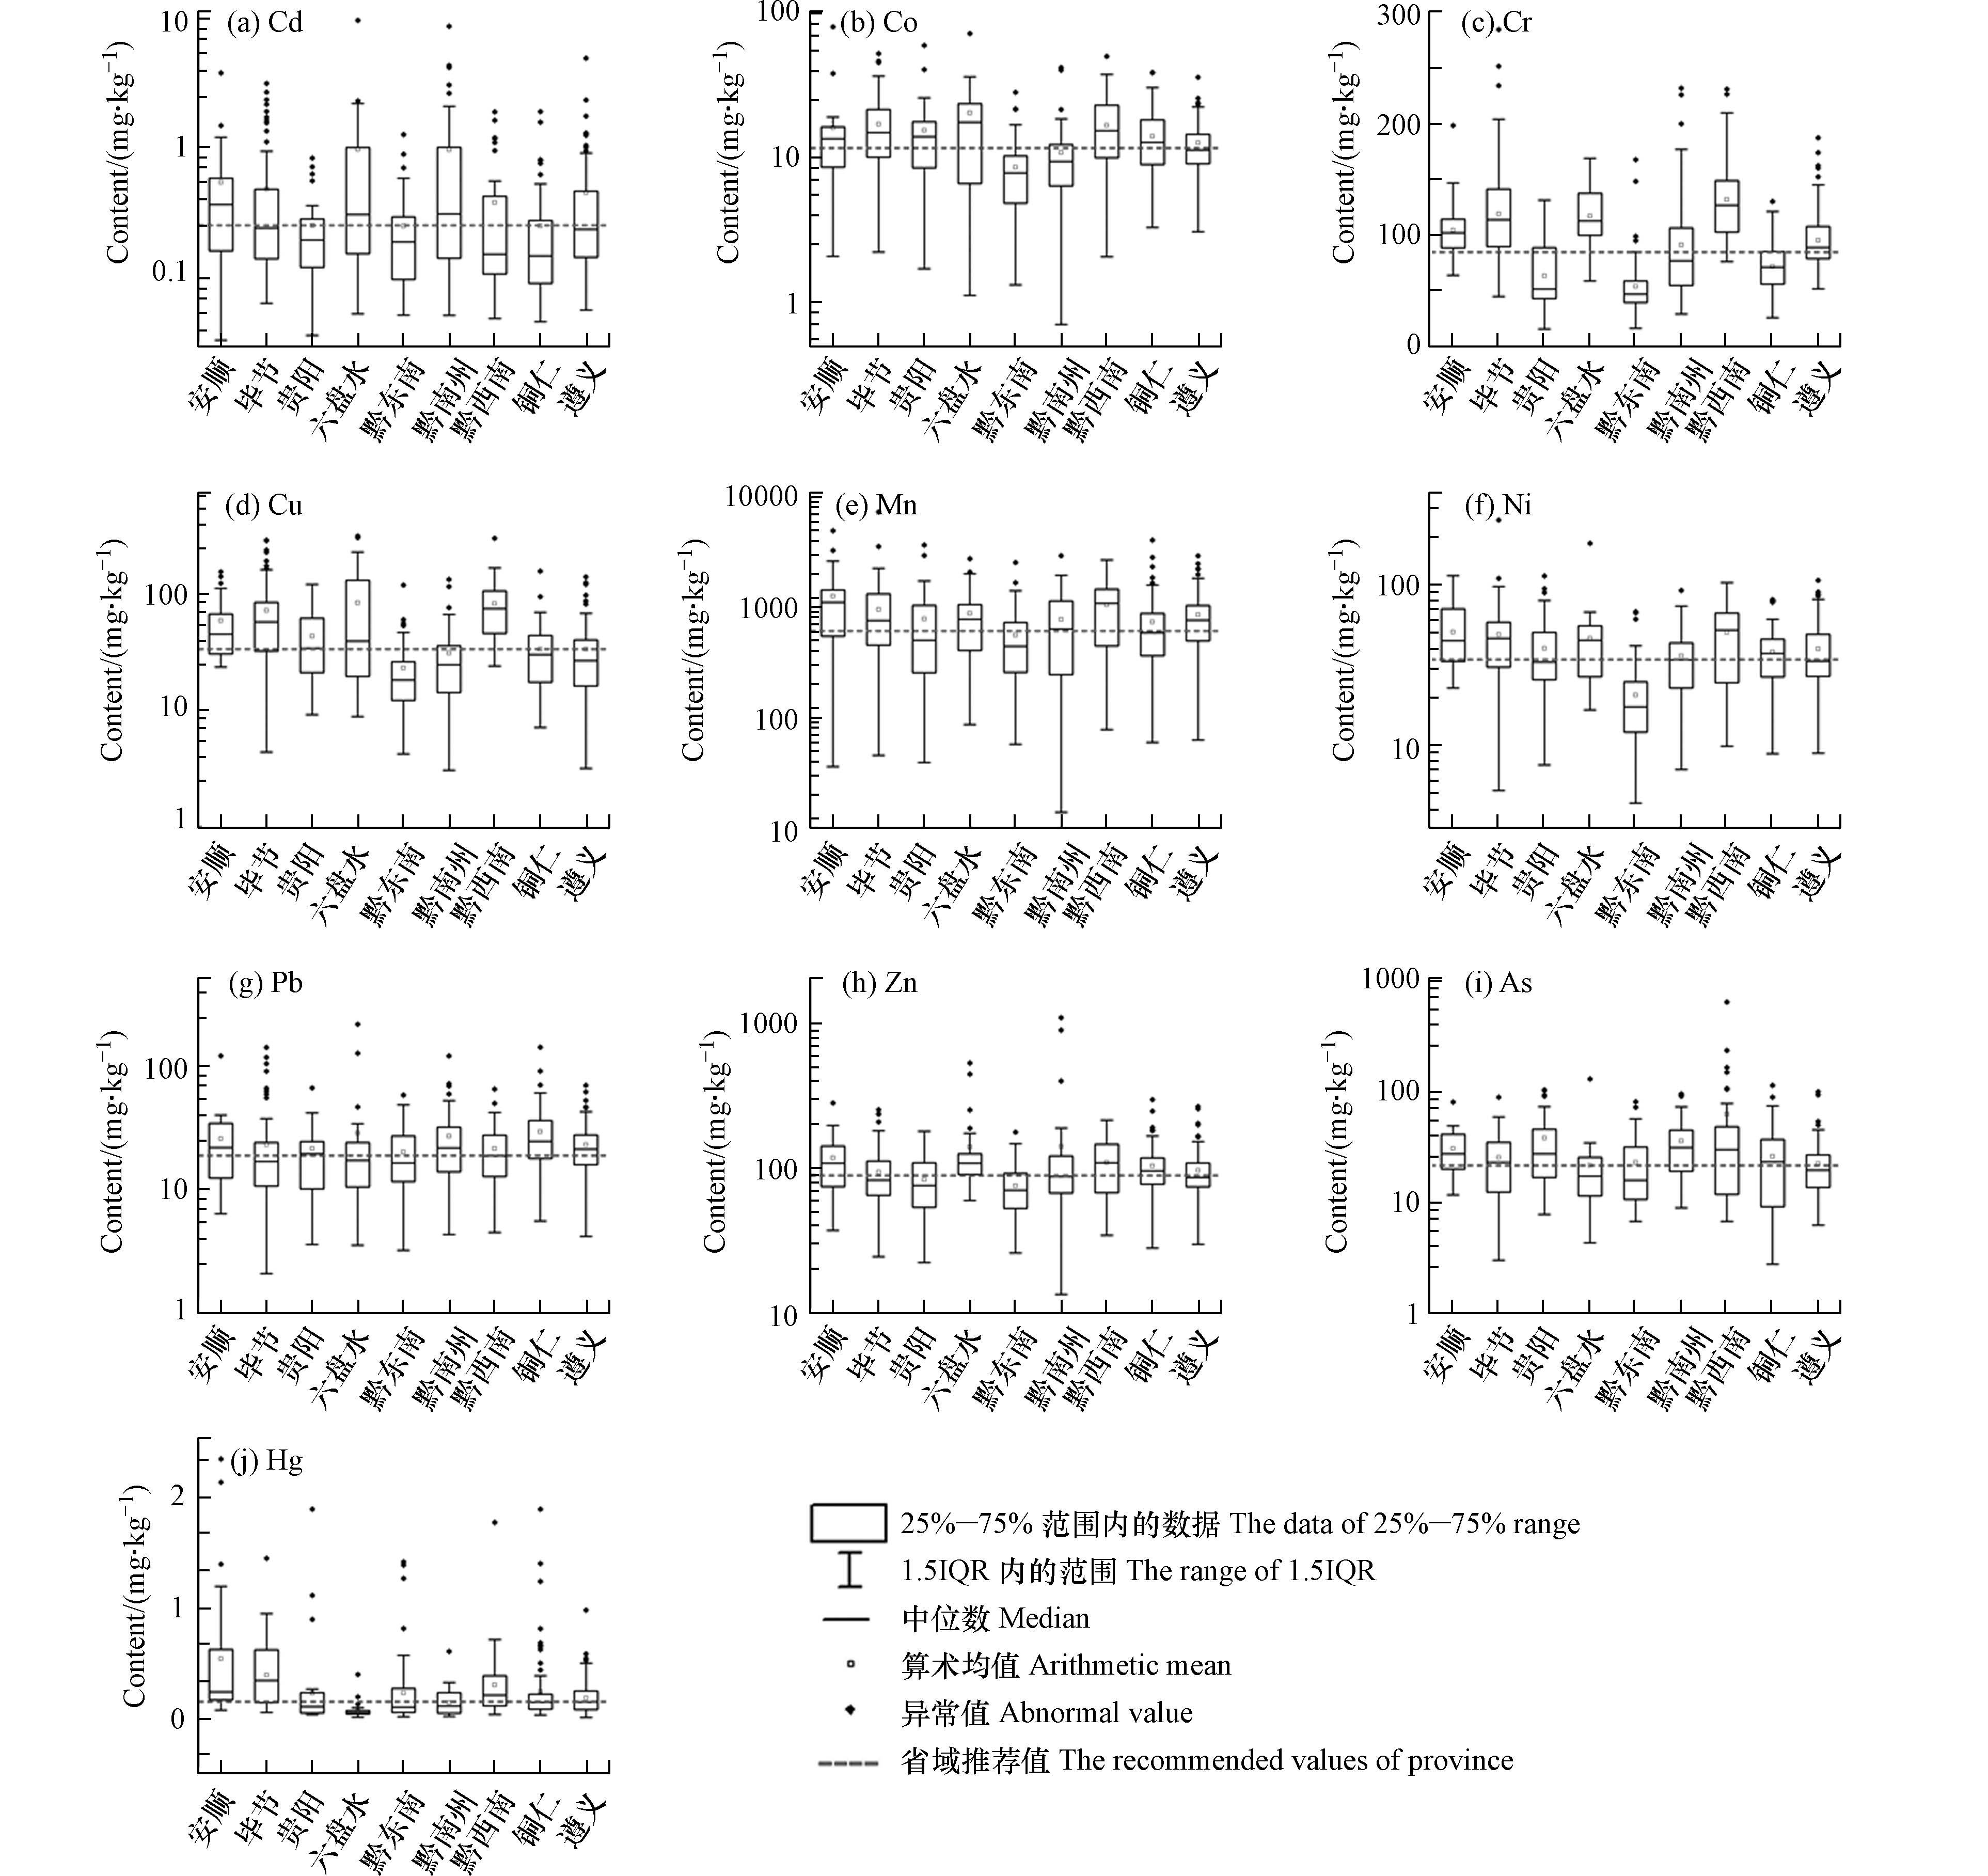
由于贵州省地质环境复杂,矿产资源丰富且分布广泛,各地背景土的重金属含量较省域推荐值可能存在偏高或偏低的估计,因此,对贵州省各地的背景土重金属含量进行单独统计是必要的(图3). 按照贵州省地级行政区划对数据进行分类,经正态检验,各元素均不符合正态分布,对数转换后呈正态分布或对称分布,因此,采用几何均值代表各地元素含量的均值水平较为合理(表6).
-
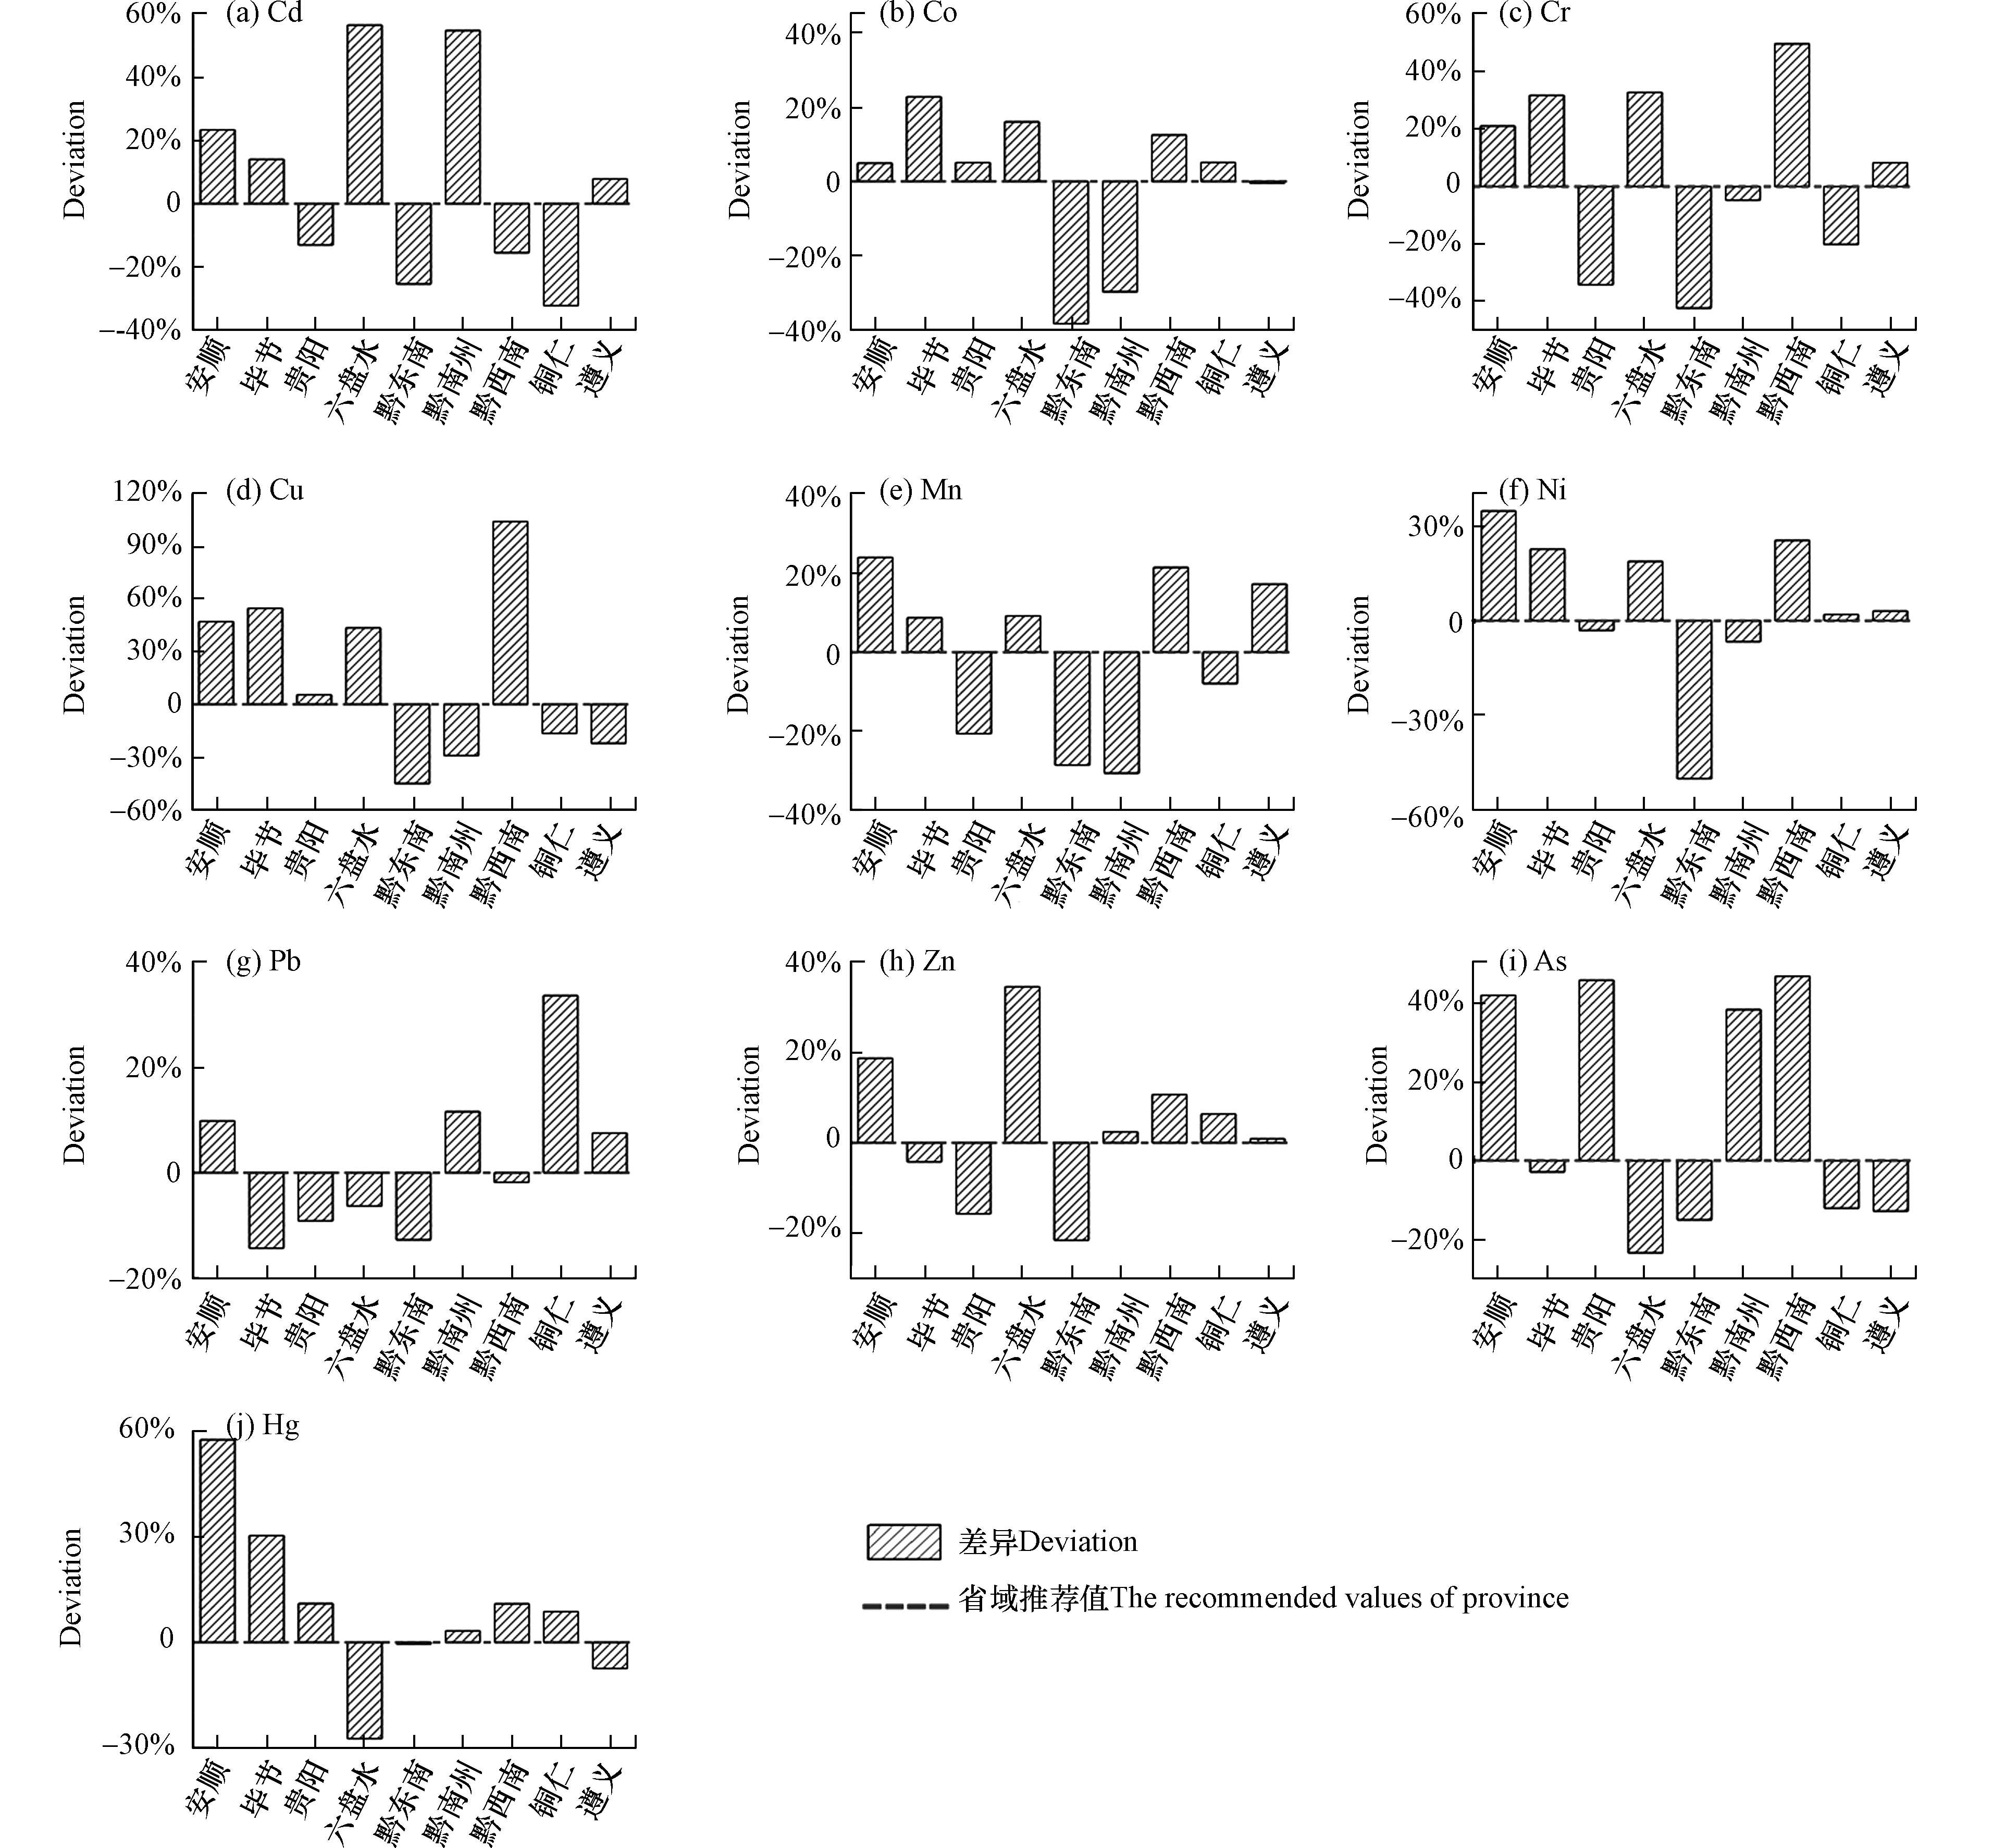
将市域推荐值与省域推荐值进行对比,有助于更好了解各地背景土重金属含量的实际状况,以省域推荐值为基准(图中以虚线表示),结合各元素在不同行政区划下的偏差水平进行对比研究.
由图4可知,安顺背景土的元素含量均超过省域推荐值,以Hg、As、Cu的表现最为突出,分别达到ω(Hg)0.238 mg·kg−1、ω(As)30.22 mg·kg−1、ω(Cu)49.63 mg·kg−1,超出省域推荐值57.91%、41.96%、47.26%;其次Cd、Cr、Mn、Ni和Zn的含量较省域推荐值偏高,分别达到ω(Cd)0.314 mg·kg−1、ω(Cr)102.3 mg·kg−1、ω(Mn)766.1 mg·kg−1、ω(Ni)45.83 mg·kg−1和ω(Zn)105.6 mg·kg−1,超出省域推荐值23.40%、21.12%、24.08%、34.83%和18.78%;而Co、Pb的含量超出的最少,分别为ω(Co)12.27 mg·kg−1、ω(Pb)20.72 mg·kg−1,仅超出省域推荐值4.92%、9.86%. 以安顺为中心(图2),与其毗邻的毕节、六盘水、黔西南的矿产资源丰富、工矿业发达,尤其以煤炭资源为代表,区域内存在“兴仁交乐”、“兴仁潘家庄”、“安龙戈塘”、“安顺轿子山”和“织金珠藏”五处典型的喀斯特煤产区[26]. Hg、As是煤中伴生的有害元素,因此,也是造成当地环境中Hg、As含量偏高的一个重要来源. 另外,黔西南的“兴仁-兴义-普安”存在As的高度异常分布,而安龙县附近的高砷煤矿、金锑砷矿都是造成As含量偏高的重要原因[27]. 有资料显示,滇黔桂三省交界处的Cd地球化学异常强度高,且梯度和浓集中心明显,受地质高背景的影响,自然土壤中的Cd含量明显偏高[28]. 孔祥宇等在对贵州省稻田土壤重金属分布特征的研究中发现Ni与Cu的空间分布十分形似,并在元素的相关性分析中也表明两元素间存在很强的正相关[29], 这与本研究在市域分布的表现相似(图4),除遵义和铜仁以外,安顺、毕节、六盘水、黔西南的Ni、Cu含量均高于省域推荐值,其余地区表现为偏低的情况.
然而,黔东南与省域推荐值的比较结果与安顺截然相反(图4),涉及的元素含量均低于省域推荐值,以Co、Cr、Cu、Ni的表现最为突出,分别为ω(Co)7.202 mg·kg−1、ω(Cr)48.57 mg·kg−1、ω(Cu)18.47 mg·kg−1、ω(Ni)16.94 mg·kg−1, 低于省域推荐值38.39%、42.50%、45.20%、50.16%. 这与贵州省喀斯特地貌的分布直接相关,黔东南位于该省喀斯特地貌区的东缘,向黄壤土逐渐过渡的交界地带,州内除黔南和铜仁的交界地带有石灰土和少量的黄棕壤土分布,东部(与湖南交界)和南部(与广西交界)有红壤土分布,其余均以黄壤土为主. 在贵州的自然土壤中,红壤土、黄壤土的重金属含量普遍低于其他类型的土壤(图5). 总体而言,贵州省背景土壤的重金属含量在地理空间上呈现出西北高、东南低的分布特点.
-
土壤是一个复杂的多相体系,其母质的风化与成土作用是影响土壤基本性质和地球化学背景浓度的重要控制因素,不同的成土母质或地质背景应具有不同的地球化学基准和背景浓度[25]. 贵州省土壤类型主要为红壤土、黄壤土、黄棕壤土、石灰土、水稻土、紫色土[29]. 对省内的主要土类重新统计,明确不同土类中各元素的含量水平和分布特征(图5),经正态检验,各元素均不符合正态分布,对数转换后呈正态分布或对称分布,因此,采用几何均值代表各元素的含量较为合理(表7).
-
以省域推荐值为基准与土类推荐值进行比较(图6),通过偏差的程度,有助于更好的了解该省主要土类下背景土重金属含量的实际状况.
黄棕壤土是该省重要的地带性土壤,主要分布在黔西北、黔北海拔较高的山地一带. 主要成土母质为砂岩、砂页岩、页岩、玄武岩等风华物[29]. 研究显示,该类土壤对Cd具有较高的富集表现,其ω(Cd)达到0.453 mg·kg−1,远超省域推荐值78.05%. 何邵麟在对贵州Cd地球化学行为的研究中指出:高Cd背景主要分布在碳酸盐岩布露区,特别是黔西和黔东铅锌矿成矿带、黔西南和黔南台地边缘生物礁滩相碳酸盐岩分布区[30]. 所以,当地的成土母质在风化和成土作用下,更易形成利于Cd沉淀、吸附和富集的土壤. 其次,黄棕壤的ω(Hg)达到0.191 mg·kg−1,超过省域推荐值26.76%,较其它土类不超过4.00%的水平而言表现尤为突出. 由图1可知,黄棕壤土主要分布在毕节中西部、六盘水和黔西南的北部一带,有资料显示“兴仁交乐”、“兴仁潘家庄”、“安龙戈塘”、“安顺轿子山”和“织金珠藏”五个煤产区的表层土壤总汞浓度范围为98.67—1801.06 μg·kg−1,平均值为(499.93±320.53) μg·kg−1[26]. 六盘水的“盘县”、“六枝”、“水城”三大煤田的煤炭中,汞的均值分别为0.297、0.748、0.692 μg·g−1[31]. 由此判断,贵州黄棕壤的汞含量偏高与当地富煤的地质背景有密切关系.
石灰土是贵州省重要的土壤类型,分布面积广泛. 除黔东南轻变质岩、砂页岩地区外,凡有石灰岩的地方都有石灰土分布[29]. 在该土类中除了Cu含量低于省域推荐值,ω(Cu)为30.83 mg·kg−1,较全省低8.53%;其余元素含量均超过省域推荐值,其中Cd、Mn、Pb的含量较高,分别达到0.285 mg·kg−1、740.7 mg·kg−1、21.41 mg·kg−1,超过省域推荐值的12.17%、19.98%、13.54%. 这与贵州碳酸盐岩地区中性至碱性岩溶水为主的地质背景,以及亲铜性成矿元素具备次生富集趋势的特点高度相关[32].
水稻土发育于各类自然土,是人为水耕熟化而形成的耕作土壤,在贵州各地均有分布,以黔中、黔南、黔东较为集中. 由图6可知水稻土Pb、As含量高于省域推荐值,分别为23.34 mg·kg−1、24.53 mg·kg−1,超出省域推荐值23.73%、15.22%. 本课题组在对贵州水稻土Cd含量的调查过程中发现:“都匀-丹寨”一带的水稻土Cd含量普遍偏高,与当地铅锌矿带导致的高背景密切相关,ω(Cd)普遍高于0.8 mg·kg−1,而在铅锌矿厂附近水稻土ω(Cd)最高可超过10 mg·kg−1,但在本研究中,ω(Cd)的土类推荐值仅为0.1963 mg·kg−1,且低于省域推荐值22.76%. 由此判断,对于高背景和工矿区附近的水稻土,土类推荐值的Cd含量存在偏低的估计,由于水稻土形成的特殊性,需要结合当地的成土母质进行针对性研究才更具代表性. 有文献显示,遵义和黔东南广泛分布富含Cd、As元素的黑色页岩[32]. 贵州大学对当地水稻Cd富集机理的研究指出:西南喀斯特地区土壤Cd具有“高地质背景,低污染风险”的特征[33].
-
1)省域尺度下,开展大样本量数据的研究工作,首先应对原始数据进行正态检验;其次,根据数据的分布状况确定离群值的剔除方法,并采用剔除一次离群值的方式对原始数据进行优化;最后,对优化后的数据进行统计,由此得到土壤背景元素均值水平的可信度更高.将优化好的数据按照“市域尺度”和“主要土类”进行分类统计,对不同分类下的背景元素均值水平与省域推荐值进行比较,有助于明确各重金属含量的区域性分布状况.
2)市域尺度下,贵州省背景土的重金属含量总体表现为西北高、东南低的空间分布特征.
3)主要土类下,黄棕壤土和石灰土表现出对重金属较强的富集特点. 研究发现,黄棕壤土在全省的分布范围与市域尺度下重金属含量高值区域的空间分布基本吻合.位于重金属地质高背景区和工矿区附近的水稻土,土类推荐值存在偏低的估计,需要以当地的成土母质为切入点进行针对性研究,才能准确计算出当地水稻土重金属含量的均值状况.
贵州省土壤重金属背景值再研究
Redistribution of heavy metal background in soil in Guizhou Province
-
摘要: 为探究贵州省背景土重金属含量的基本状况,进行了系统的场调工作,共采集自然土样468 件. 通过统计学和对比研究的方法,在“省域尺度”、“市域尺度”和“主要土类”的3个视角下重新提出贵州省土壤重金属的背景值. 结果表明,省域推荐值分别为ω(Cd)0.220 mg·kg−1、ω(Co)12.35 mg·kg−1、ω(Cr)87.68 mg·kg−1、ω(Cu)33.70 mg·kg−1、ω(Mn)668.7 mg·kg−1、ω(Ni)33.99 mg·kg−1、ω(Pb)19.91 mg·kg−1、ω(Zn)88.88 mg·kg−1、ω(As)21.29 mg·kg−1和ω(Hg)0.151 mg·kg−1. 与《中国土壤元素背景值》相比,Hg含量提高77.41%;Cu和As含量分别提高25.28%和33.06%;而Co和Pb含量低于省域推荐值,分别降低29.83%和36.39%. 市域尺度下,贵州省背景土的重金属含量在地理空间上呈西北高、东南低的分布特点,其中,安顺市所有元素的均值水平均超过省域推荐值,超出5%—60%;而黔东南全部未超. 主要土类下,黄棕壤土和石灰土表现出对重金属较强的富集特点,其中黄棕壤土在全省的分布与市域推荐值的高值区域基本吻合,毕节的中西部、六盘水和黔西南的北部都以黄棕壤为主要土类,研究涉及的重金属含量普遍偏高. 水稻土的重金属含量受成土母质和人为因素的叠加影响,对于地质高背景区和工矿区附近,其含量水平较土类推荐值存在偏低的估计,需要开展针对性的研究工作. 省域推荐值对于了解各重金属的实际分布存在局限性,因此,市域推荐值和土类推荐值有助于识别重金属含量的区域性分布特征.Abstract: In order to explore the background value of soil heavy metals in Guizhou Province, We have conducted a systematic survey in the local, and 468 natural soil samples were collected. By means of statistics and comparative study, through the three perspectives of "province", "cities" and "main soil types", the background values of soil heavy metals in Guizhou Province are re-proposed. The recommended value of province as follows: ω(Cd)0.220 mg·kg−1, ω(Co)12.35 mg·kg−1, ω(Cr)87.68 mg·kg−1, ω(Cu)33.70 mg·kg−1, ω(Mn)668.7 mg·kg−1, ω(Ni)33.99 mg·kg−1, ω(Pb)19.91 mg·kg−1, ω(Zn)88.88 mg·kg−1, ω(As)21.29 mg·kg−1和ω(Hg)0.151 mg·kg−1. Compared with the Background Values of Soil Elements in China, the Hg content increased by 77.41%, followed by the Cu and As contents increased by 25.28% and 33.06%; while the Co and Pb contents were lower than the provincial recommended values and decreased by 29.83% and 36.39%. At the city scale, the content of heavy metals in the background soils of Guizhou Province shows a geographical distribution characteristic of high in the northwest and low in the southeast. The average levels of all elements in Anshun exceed the provincial recommended values, the excess value ranges from 5% to 60%, while those in Qiandongnan by contrast. Among the main soil types, yellow-brown soil and lime soil showed a strong trend of heavy metal enrichment, and the coverage of yellow-brown soil in the whole province was basically similar to the regional distribution of the high value of heavy metal content in the recommended value of the city. Yellow brown soil is the main soil type in the central and western parts of Bijie, Liupanshui and the northern part of Qianxinan, and the content of heavy metals involved is generally high. The content of heavy metals in paddy soil is affected by the superposition of soil parent materials and human factors. For paddy soils in high background areas and near industrial and mining areas in the province, their content levels are estimated to be lower than the recommended values for soil types, which need to be targeted to research. The provincial recommended value has a high or low estimate about the average level with a particular element in a local area. Therefore, the proposal of the recommended value about the cities and the soil types can help to better understand the regional distribution characteristics.
-
Key words:
- Guizhou Province /
- natural soil /
- the background value /
- heavy metal /
- administrative division /
- soil types.
-

-
表 1 贵州省自然土壤重金属含量基本统计(mg·kg−1)
Table 1. Statistical results of heavy metal content about natural soils in Guizhou Province(mg·kg−1)
名称
Name特征值
ItemsCd Co Cr Cu Mn Ni Pb Zn As Hg 原数据
Raw dataN 468 468 468 468 468 468 468 468 468 465 算术均值 0.519 14.24 94.14 47.89 857.9 41.27 26.86 106.4 33.20 0.265 几何均值 0.260 11.29 83.57 33.48 588. 6 34.13 18.88 90.55 22.02 0.147 中位数 0.220 12.08 87.25 32.38 657.5 36.19 19.91 90.25 22.48 0.148 算术标准差 1.032 10.63 48.76 47.21 778.2 29.76 60.65 89.69 58.75 0.387 几何标准差 2.790 2.072 1.648 2.335 2.660 1.879 2.173 1.689 2.209 2.989 最小值 0.033 0.356 14.07 1.523 10.56 3.147 0.370 13.32 2.719 0.003 最大值 11.40 104.9 528.8 314.0 7343 312.8 1256 1105 653.2 5.171 偏度 6.21 3.10 2.39 2.65 3.16 4.22 18.05 6.19 8.06 5.96 偏度(对数转换后) 0.88 −0.84 −0.39 −0.02 −1.01 −0.40 −0.39 0.53 0.64 −0.13 峰度 50.37 17.19 14.31 9.10 17.86 31.53 363.3 53.13 74.95 59.48 变异系数 1.99 0.75 0.52 0.99 0.91 0.72 2.26 0.84 1.77 1.46 数据(剔除一次离群值)
Data(removing one-time outliers)N 465 460 463 467 462 463 463 460 463 460 剔除比例/% 0.64 1.71 1.07 0.21 1.28 1.07 1.07 1.71 1.07 1.08 算术均值 0.458 14.25 93.88 47.99 868.9 39.84 23.91 98.84 27.87 0.256 几何均值 0.254 11.69 84.47 33.70 617.4 33.99 18.86 88.88 21.29 0.151 中位数 0.220 12.35 87.68 32.39 668.7 36.16 19.91 90.11 21.92 0.150 算术标准差 0.694 9.712 44.05 47.21 777.2 22.09 18.83 50.38 24.31 0.314 几何标准差 2.682 1.917 1.598 2.308 2.433 1.809 2.007 1.581 2.067 2.817 最小值 0.033 1.315 19.47 3.083 36.53 5.201 0.370 21.70 2.719 0.008 最大值 5.347 80.92 285.6 314.0 7343 180.3 143.1 435.1 233.1 2.345 偏度 3.72 2.39 1.25 2.65 3.19 1.28 3.02 2.36 3.21 3.05 偏度(对数转换后) 0.74 −0.41 −0.26 0.06 −0.59 −0.54 −0.64 −0.01 0.09 0.05 峰度 16.8 9.67 2.43 9.10 18.04 3.53 13.20 10.04 16.52 12.11 变异系数 1.52 0.68 0.47 0.98 0.89 0.55 0.79 0.5097 0.87 1.23 数据(多次迭代剔除离群值)
Data(removing Multi-iterate outliers)N 463 454 460 467 458 460 457 455 462 460 剔除比例/% 1.07 3.21 1.71 0.21 2.14 1.71 2.35 2.78 1.28 1.08 算术均值 0.437 14.24 94.37 47.99 876.1 40.06 24.25 97.12 27.43 0.256 几何均值 0.251 11.90 85.28 33.70 632.3 34.40 19.58 88.53 21.18 0.151 中位数 0.219 12.46 88.11 32.39 681.0 36.31 20.03 90.10 21.90 0.150 数据(多次迭代剔除离群值)
Data(removing Multi-iterate outliers)算术标准差 0.623 9.163 43.79 47.21 776.7 21.99 18.77 43.52 22.38 0.314 几何标准差 2.634 1.843 1.576 2.308 2.352 1.779 1.917 1.543 2.051 2.817 最小值 0.033 2.063 23.67 3.083 50.55 6.478 3.070 24.28 2.719 0.008 最大值 4.377 72.75 285.6 314.0 7343 180.3 143.1 299.0 163.7 2.345 偏度 3.39 2.07 1.28 2.65 3.21 1.30 3.06 1.38 2.50 3.05 偏度(对数转换后) 0.70 −0.24 −0.13 0.06 −0.46 −0.44 −0.06 −0.13 0.03 0.05 峰度 13.83 6.91 2.49 9.10 18.15 3.61 13.39 2.96 8.93 12.11 变异系数 1.42 0.64 0.46 0.98 0.89 0.55 0.77 0.45 0.82 1.23 注:N表示样本数量;偏度、 峰度、变异系数都为无量纲数据;剔除比例=(原数据的样本数量-一次或多次迭代剔除离群值后的样本数量)/原数据的样本数量×100%.
Note: N is the number of samples; The Skewness, Kurtosis and CV are all dimensionless data; Rejection ratio = (Raw data - Number of samples after one or multi-iterate of outliers were removing)/ Raw data×100% .表 2 原数据与剔除一次离群值数据的偏差(%)
Table 2. The deviation between raw data and the data with removing one-time outliers(%)
数据类型
Data types偏差
DeviationCd Co Cr Cu Mn Ni Pb Zn As Hg 中位数 Median 0.23 −2.19 −0.49 −0.03 −1.67 0.08 0.00 0.16 2.55 −1.01 算术均值 Arithmetic mean 13.33 −0.07 0.28 −0.21 −1.27 3.59 12.34 7.65 19.12 3.29 几何均值 Geometry mean 2.40 −3.42 −1.07 −0.65 −4.66 0.41 0.11 1.88 3.43 −2.28 变异系数 CV 31.09 9.48 10.40 0.20 1.40 30.06 186.77 65.35 102.80 19.45 注:偏差=(原数据-剔除一次离群值的数据)/剔除一次离群值的数据×100%.
Note: Deviation =(Raw data – The data with removing one-time outliers)/ The data with removing one-time outliers×100% .表 3 剔除一次离群值和多次迭代剔除离群值数据间的偏差(%)
Table 3. The deviation between removing one-time and removing multi-iterate outliers data(%)
数据类型
Data types偏差
DeviationCd Co Cr Cu Mn Ni Pb Zn As Hg 中位数 Median 0.16 −0.91 −0.49 0 −1.81 −0.42 −0.59 0.01 0.10 0 算术均值 Arithmetic mean 4.65 0.04 −0.51 0 −0.82 −0.55 −1.39 1.77 1.62 0 几何均值 Geometry mean 1.29 −1.79 −0.95 0 −2.36 −1.18 −3.66 0.39 0.51 0 变异系数 CV 6.57 5.94 1.12 0 0.90 1.03 1.72 13.74 6.90 0 注:偏差=(剔除一次离群值的数据-多次迭代剔除离群值的数据)/多次迭代剔除离群值的数据×100%.
Note: Deviation =(The data with removing one-time outliers – The date with removing multi-iterate outliers)/The date with removing multi-iterate outliers×100% .表 4 前人研究的相关数据(mg·kg−1) [10]
Table 4. The relevant data from previous research (mg·kg−1)
项目
Items*Cd Co Cr Cu Mn Ni Pb Zn As Hg N 50 50 50 50 50 50 50 50 50 50 算术均值Arithmetic mean 0.659 19.2 95.9 32.0 794 39.1 35.2 99.5 20.0 0.110 算术标准差Arithmetic SD 1.406 8.97 63.21 20.76 723.5 22.4 19.59 56.01 14.55 0.069 几何均值Geometry mean 0.209 17.6 84.4 26.9 529 32.9 31.3 86.9 16.0 0.085 几何标准差Geometry SD 3.778 1.50 1.60 1.81 2.7 1.88 1.60 1.68 1.93 2.25 变异系数CV 2.13 0.47 0.66 0.65 0.91 0.57 0.56 0.56 0.73 0.63 注:*N表示样本数量,变异系数为无量纲数据. Note:* N indicates the number of samples, CV is dimensionless data. 表 5 省域推荐值与前人研究的数据对比(%)
Table 5. Compare the Recommended values of province research(%)
数据类型
Data types偏差
DeviationCd Co Cr Cu Mn Ni Pb Zn As Hg Na 830 820 826 834 824 826 826 820 826 820 ωa 5.07 −29.83 3.886 25.28 −7.57 3.31 −36.39 2.28 33.06 77.41 变异系数CV −28.73 45.00 −28.91 51.35 −1.70 −2.72 40.61 −8.98 19.49 94.60 注:Na即样本量N的偏差,Na =(省域推荐值的样本量-前人研究的样本量)/前人研究的样本量×100%;ωa即土壤重金属含量ω的偏差,ωa=(省域推荐值-前人研究的几何均值)/前人研究的几何均值×100%.
Note: Na is the deviation of the sample size, Na = (Sample size of provincial recommended value - sample size of previous studies)/sample size of previous studies ×100%; ωa is the deviation of soil heavy metal content, ωa= (Provincial recommended value - geometric mean of previous studies)/Geometric mean of previous studies ×100%.表 6 贵州省各地域背景土重金属含量的数据优化及推荐值
Table 6. Optimization and recommended values of soil heavy metal content about cities in Guizhou Province
地点
Sites特征值
Items元素
ElementsCd Co Cr Cu Mn Ni Pb Zn As Hg 遵义
ZunyiN 86 86 85 87 85 86 87 86 86 84 剔除比例/% 1.15 1.15 2.30 0.00 2.30 1.15 0.00 1.15 1.15 2.33 几何均值/( mg·kg−1) 0.274 11.64 91.47 26.20 724.1 35.03 20.29 89.70 18.56 0.140 铜仁
TongrenN 81 82 81 82 83 82 80 81 83 81 剔除比例/% 2.41 1.20 2.41 1.20 0.00 1.20 3.61 2.41 0.00 0.00 几何均值/( mg·kg−1) 0.172 12.29 67.42 28.11 568.1 34.66 25.23 94.55 18.71 0.164 黔西南
QianxinanN 35 35 35 35 35 35 35 35 35 33 剔除比例/% 0.00 0.00 0.00 0.00 0.00 0.00 0.00 0.00 0.00 2.94 黔西南
Qianxinan几何均值/( mg·kg−1) 0.215 13.15 126.5 68.90 750.1 42.64 18.52 98.38 31.25 0.168 黔南州
QiannanzhouN 41 40 40 40 41 40 40 41 41 42 剔除比例/% 0.00 2.44 2.44 2.44 0.00 2.44 2.44 0.00 0.00 0.00 几何均值/( mg·kg−1) 0.394 8.214 80.39 23.86 427.8 31.71 21.06 91.04 29.46 0.156 黔东南
QiandongnanN 51 52 52 52 51 52 51 52 51 52 剔除比例/% 1.92 0.00 0.00 0.00 1.92 0.00 1.92 0.00 1.92 1.89 几何均值/( mg·kg−1) 0.189 7.202 48.57 18.47 440.4 16.94 16.45 69.64 18.09 0.150 六盘水
LiupanshuiN 29 29 29 29 28 28 28 29 28 28 剔除比例/% 0.00 0.00 0.00 0.00 3.45 3.45 3.45 0.00 3.45 3.45 几何均值/( mg·kg−1) 0.398 13.57 112.2 48.41 674.1 40.38 17.67 119.7 16.30 0.109 贵阳
GuiyangN 30 30 31 31 31 31 31 31 31 31 剔除比例/% 3.23 3.23 0.00 0.00 0.00 0.00 0.00 0.00 0.00 0.00 几何均值/( mg·kg−1) 0.221 12.29 55.50 35.55 489.6 32.94 17.13 74.86 31.05 0.168 毕节
BijieN 84 84 84 85 83 83 85 84 85 85 剔除比例/% 1.18 1.18 1.18 0.00 2.35 2.35 0.00 1.18 0.00 0.00 几何均值/( mg·kg−1) 0.290 14.36 111.4 52.19 671.4 41.71 16.15 85.11 20.68 0.197 安顺
AnshunN 25 25 24 25 25 25 25 25 24 24 剔除比例/% 0.00 0.00 −4.00 0.00 0.00 0.00 0.00 0.00 −4.00 0.00 几何均值/( mg·kg−1) 0.314 12.27 102.3 49.63 766.1 45.83 20.72 105.6 30.22 0.238 注:N指剔除一次离群值后的样本数量.
Note: N is the number of samples after removing one-time outliers.表 7 主要土类下背景土重金属含量的数据优化及推荐值
Table 7. Optimization and recommended values of soil heavy metal content in main soil types
土类
Soil types项目
Items元素
ElementsCd Co Cr Cu Mn Ni Pb Zn As Hg 红壤土
Red soilN 28 28 28 28 28 28 28 27 28 26 剔除比例/% 0.00 0.00 0.00 0.00 0.00 0.00 0.00 3.57 0.00 3.70 几何均值/(mg·kg−1) 0.207 8.135 51.56 23.06 473.3 22.22 15.84 69.96 20.32 0.157 黄壤土
Yellow soilN 211 209 209 212 209 212 210 209 210 209 剔除比例/% 0.94 1.88 1.88 0.47 1.88 0.47 1.41 1.88 1.41 0.48 几何均值/(mg·kg−1) 0.226 11.66 82.80 35.96 604.9 33.86 17.35 87.30 20.46 0.150 黄棕壤土
Yellow-brown soilN 24 24 24 24 24 24 24 23 23 24 剔除比例/% 0.00 0.00 0.00 0.00 0.00 0.00 0.00 4.17 4.17 0.00 几何均值/(mg·kg−1) 0.453 12.98 108.9 41.90 507.4 40.58 18.32 90.46 20.16 0.191 石灰土
Lime soilN 111 109 110 111 110 111 111 110 110 108 剔除比例/% 0.00 1.80 0.90 0.00 0.90 0.00 0.00 0.90 0.90 1.82 几何均值/(mg·kg−1) 0.285 11.99 90.19 30.83 740.7 35.48 21.41 92.52 21.67 0.152 水稻土
Paddy soilN 51 51 52 52 51 52 52 51 52 53 剔除比例/% 1.92 1.92 0.00 0.00 1.92 0.00 0.00 1.92 0.00 1.85 几何均值/(mg·kg−1) 0.196 11.37 82.39 34.05 537.0 35.70 23.34 90.89 24.53 0.150 紫色土
Purple soilN 14 14 14 14 14 14 14 14 14 14 剔除比例/% 0.00 0.00 0.00 0.00 0.00 0.00 0.00 0.00 0.00 0.00 几何均值/(mg·kg−1) 0.354 12.45 67.79 33.29 714.2 32.99 14.35 86.85 13.57 0.153 注:N指剔除一次离群值后的样本数量.
Note: N is the number of samples after removing one-time outliers. -
[1] 张山岭, 杨国义, 罗薇, 等. 广东省土壤无机元素背景值的变化趋势研究[J]. 土壤, 2012, 44(6): 1009-1014. doi: 10.3969/j.issn.0253-9829.2012.06.020 ZHANG S L, YANG G Y, LUO W, et al. Changes of background values of inorganic elements in soils of gunagdong Province[J]. Soils, 2012, 44(6): 1009-1014 (in Chinese). doi: 10.3969/j.issn.0253-9829.2012.06.020
[2] HAWKES H E, WEBB J S. Geochemistry in mineral exploration[M]. New York: Harper & Row, 1962. [3] LEVINSON A A. Introduction to exploration geochemistry[M]. 2d ed Wilmette Ill : Applied Pub , 1980. [4] 许炼烽, 刘腾辉. 广东土壤环境背景值和临界含量的地带性分异[J]. 华南农业大学学报, 1996, 17(4): 58-62. XU L F, LIU T H. The zonal differentiation of soil environmental background values and critical contents in Guangdong[J]. Journal of South China Agricultural University, 1996, 17(4): 58-62. (in Chinese)
[5] 陈同斌, 郑袁明, 陈煌, 等. 北京市土壤重金属含量背景值的系统研究[J]. 环境科学, 2004, 25(1): 117-122. doi: 10.3321/j.issn:0250-3301.2004.01.026 CHEN T B, ZHENG Y M, CHEN H, et al. Background concentrations of soil heavy metals in Beijing[J]. Environmental Science, 2004, 25(1): 117-122 (in Chinese). doi: 10.3321/j.issn:0250-3301.2004.01.026
[6] ANDER E L, JOHNSON C C, CAVE M R, et al. Methodology for the determination of normal background concentrations of contaminants in English soil[J]. Science of the Total Environment, 2013, 454/455: 604-618. doi: 10.1016/j.scitotenv.2013.03.005 [7] CASTRO J E, FERNANDEZ A M, GONZALEZ-CACCIA V, et al. Concentration of trace metals in sediments and soils from protected lands in south Florida: Background levels and risk evaluation[J]. Environmental Monitoring and Assessment, 2013, 185(8): 6311-6332. doi: 10.1007/s10661-012-3027-9 [8] CHEN J S, WEI F S, ZHENG C J, et al. Background concentrations of elements in soils of China[J]. Water, Air, and Soil Pollution, 1991, 57(1): 699-712. [9] 魏复盛, 陈静生, 吴燕玉, 等. 中国土壤环境背景值研究[J]. 环境科学, 1991, 12(4): 12-19, 94. doi: 10.3321/j.issn:0250-3301.1991.04.015 WEI F S, CHEN J S, WU Y Y, et al. Study on the background contents on 61 elements of soils in China[J]. Environmental Science, 1991, 12(4): 12-19, 94 (in Chinese). doi: 10.3321/j.issn:0250-3301.1991.04.015
[10] 国家环境保护局主持, 中国环境监测总站主编. 中国土壤元素背景值[M]. 北京: 中国环境科学出版社, 1990. National environmental protection agency host, China environmental monitoring station chief editor. Background values of soil elements in China [M]. Beijing: China Environmental Science Press, 1990(in Chinese).
[11] HOLMGREN G G S, MEYER M W, CHANEY R L, et al. Cadmium, lead, zinc, copper, and nickel in agricultural soils of the United States of America[J]. Journal of Environmental Quality, 1993, 22(2): 335-348. [12] AHRENS L H. The lognormal distribution of the elements (a fundamental law of geochemistry and its subsidiary)[J]. Geochimica et Cosmochimica Acta, 1954, 5(2): 49-73. doi: 10.1016/0016-7037(54)90040-X [13] AHRENS L H. A fundamental law of geochemistry[J]. Nature, 1953, 172(4390): 1148. doi: 10.1038/1721148a0 [14] 夏增禄. 土壤元素背景值及其研究方法[M]. 北京: 气象出版社, 1987. XIA Z L. Background value of soil elements and its research method[M]. Beijing: China Meteorological Press, 1987(in Chinese).
[15] 邢克孝, 杨卫东. 千山土壤中铬、汞微量元素的自然背景值研究[J]. 辽宁大学学报(自然科学版), 1986, 13((1): ): 52-56. XING K X, YANG W D. Study of the natural background values of Cr and Hg element in thousand-mountains soil[J]. Journal of Liaoning University (Natural Sciences Edition), 1986, 13(1): 52-56 (in Chinese).
[16] 陈默涵, 何腾兵, 黄会前. 贵州地形地貌对土壤类型及分布的影响[J]. 贵州大学学报(自然科学版), 2016, 33(5): 14-16, 35. CHEN M H, HE T B, HUANG H Q. The effect of landform on the types and distribution of soils in Guizhou[J]. Journal of Guizhou University (Natural Sciences), 2016, 33(5): 14-16, 35 (in Chinese).
[17] 曹建华, 袁道先, 潘根兴. 岩溶生态系统中的土壤[J]. 地球科学进展, 2003, 18(1): 37-44. CAO J H, YUAN D X, PAN G X. Some soil features in Karst ecosystem[J]. Advance in Earth Sciences, 2003, 18(1): 37-44 (in Chinese).
[18] 徐一帆, 张凯, 王源. 贵州矿产资源开发利用现状[J]. 凯里学院学报, 2016, 34(6): 139-141. XU Y F, ZHANG K, WANG Y. Present situation of development and utilization of mineral resources in Guizhou[J]. Journal of Kaili University, 2016, 34(6): 139-141 (in Chinese).
[19] 张涤. 浅析贵州矿产资源及其开发利用[J]. 贵州地质, 2003, 20(3): 150-153, 144. ZHANG D. Analysis on the mineral resources of Guizhou and its exploitation[J]. Guizhou Geology, 2003, 20(3): 150-153, 144 (in Chinese).
[20] KIMBROUGH D E, WAKAKUWA J R. Acid digestion for sediments, sludges, soils, and solid wastes. A proposed alternative to EPA SW 846 Method 3050[J]. Environmental Science & Technology, 1989, 23(7): 898-900. [21] GB-T22105.1-2008, 土壤中总汞的测定[S]. GB-T22105.1-2008, Determination of total mercury in soil[S] (in Chinese).
[22] 国家药典委员会. 中华人民共和国药典-三部: 2015年版[M]. 北京: 中国医药科技出版社, 2015. National pharmacopoeia commission. People’s republic of China (PRC) pharmacopoeia-part III: 2015 edition[M]. Beijing: China Medical Science and Technology Press, 2015(in Chinese).
[23] 魏复盛, 杨国治, 蒋德珍, 等. 中国土壤元素背景值基本统计量及其特征[J]. 中国环境监测, 1991, 7(1): 1-6. WEI F S, YANG G Z, JIANG D Z, et al. Basic statistics and characteristics of background values of soil elements in China[J]. Environmental Monitoring in China, 1991, 7(1): 1-6 (in Chinese).
[24] 王佛鹏, 宋波, 周浪, 等. 广西西江流域土壤重金属背景值再研究[J]. 环境科学学报, 2018, 38(9): 3695-3702. WANG F P, SONG B, ZHOU L, et al. Redistribution of heavy metal background in soil of Xijiang River Basin in Guangxi[J]. Acta Scientiae Circumstantiae, 2018, 38(9): 3695-3702 (in Chinese).
[25] 成杭新, 李括, 李敏, 等. 中国城市土壤化学元素的背景值与基准值[J]. 地学前缘, 2014, 21(3): 265-306. CHENG H X, LI K, LI M, et al. Geochemical background and baseline value of chemical elements in urban soil in China[J]. Earth Science Frontiers, 2014, 21(3): 265-306 (in Chinese).
[26] 梁隆超. 西南喀斯特煤矿区汞的表生环境地球化学研究[D]. 贵阳: 贵州大学, 2020. LIANG L C. Supergene environmental geochemistry of mercury in Karst coal mining areas, southwest China[D]. Guiyang: Guizhou University, 2020 (in Chinese).
[27] 黄志勇. 黔西南高砷煤与卡林型金矿成因关系研究[D]. 贵阳: 贵州大学, 2008. HUANG Z Y. Research on origin between high-arsenic coal and carlin-type gold deposit in southwestern of Guizhou Province[D]. Guiyang: Guizhou University, 2008 (in Chinese).
[28] 谢学锦, 程志中, 张立生. 中国西南地区76种元素地球化学图集[M]. 北京: 地质出版社, 2008. XIE X J, CHENG Z Z, ZHANG L S. Geochemical atlas of 76 elements in southwest China[M]. Beijing: Geological Publishing House, 2008(in Chinese).
[29] 孔祥宇, 黄国培, 程天金, 等. 贵州省稻田土壤重金属分布特征[J]. 矿物岩石地球化学通报, 2018, 37(6): 1084-1091. KONG X Y, HUANG G P, CHENG T J, et al. Distribution characteristics of heavy metals in paddy soils of Guizhou Province[J]. Bulletin of Mineralogy, Petrology and Geochemistry, 2018, 37(6): 1084-1091 (in Chinese).
[30] 何邵麟, 龙超林, 刘应忠, 等. 贵州地表土壤及沉积物中镉的地球化学与环境问题[J]. 贵州地质, 2004, 21(4): 245-250. HE S L, LONG C L, LIU Y Z, et al. Geochemistry and environment of the cadmium in the soil and sediments at the surface of Guizhou Province[J]. Guizhou Geology, 2004, 21(4): 245-250 (in Chinese).
[31] 冯新斌, 洪业汤, 倪建宇, 等. 贵州煤中汞的分布、赋存状态及对环境的影响[J]. 煤田地质与勘探, 1998, 26(2): 12-14. FENG X B, HONG Y T, NI J Y, et al. Distribution and occurrence mode of mercury in some coals of Guizhou Province and its environmental impact[J]. Coal Geology & Exploration, 1998, 26(2): 12-14 (in Chinese).
[32] 何邵麟. 贵州表生沉积物地球化学背景特征[J]. 贵州地质, 1998, 15(2): 149-156. HE S L. Geochemical background of SupergeneSediments in Guizhou[J]. Guizhou Geology, 1998, 15(2): 149-156 (in Chinese).
[33] 杨寒雯, 刘秀明, 刘方, 等. 喀斯特高镉地质背景区水稻镉的富集、转运特征与机理[J]. 地球与环境, 2021, 49(1): 18-24. YANG H W, LIU X M, LIU F, et al. Translocation and accumulation of cadmium in rice in a Karst area with high geochemical background and its mechanism[J]. Earth and Environment, 2021, 49(1): 18-24 (in Chinese).
[34] 田嘉禹, 刘俐, 汪群慧, 等. 中美土壤元素背景值调查研究中数理统计方法运用及影响[J]. 环境科学研究, 2020, 33(3): 718-727. TIAN J Y, LIU L, WANG Q H, et al. Application and impact of statistic methods on the soil background values in China and the United States[J]. Research of Environmental Sciences, 2020, 33(3): 718-727 (in Chinese).
[35] 马玉, 李团结, 高全洲, 等. 珠江口沉积物重金属背景值及其污染研究[J]. 环境科学学报, 2014, 34(3): 712-719. MA Y, LI T J, GAO Q Z, et al. Background values and contamination of heavy metals in sediments from the Pearl River Estuary[J]. Acta Scientiae Circumstantiae, 2014, 34(3): 712-719 (in Chinese).
[36] 罗慧, 刘秀明, 王世杰, 等. 中国南方喀斯特集中分布区土壤Cd污染特征及来源[J]. 生态学杂志, 2018, 37(5): 1538-1544. LUO H, LIU X M, WANG S J, et al. Pollution characteristics and sources of cadmium in soils of the Karst area in South China[J]. Chinese Journal of Ecology, 2018, 37(5): 1538-1544 (in Chinese).
[37] 盛茂银, 刘洋, 熊康宁. 中国南方喀斯特石漠化演替过程中土壤理化性质的响应[J]. 生态学报, 2013, 33(19): 6303-6313. doi: 10.5846/stxb201305080979 SHENG M Y, LIU Y, XIONG K N. Response of soil physical-chemical properties to rocky desertification succession in South China Karst[J]. Acta Ecologica Sinica, 2013, 33(19): 6303-6313 (in Chinese). doi: 10.5846/stxb201305080979
[38] 王勇辉, 焦黎. 中国夏尔希里土壤环境背景值特征及评价[J]. 土壤通报, 2015, 46(3): 754-761. doi: 10.19336/j.cnki.trtb.2015.03.039 WANG Y H, JIAO L. Characteristics and evaluation of the environmental background of soil in xarxili of China[J]. Chinese Journal of Soil Science, 2015, 46(3): 754-761 (in Chinese). doi: 10.19336/j.cnki.trtb.2015.03.039
-


 下载:
下载:


