

 下载:
下载:
-
气溶胶是指悬浮在大气中的固体颗粒或液滴形成的胶体分散体系,在局地或全球的辐射平衡和气候变化中扮演着重要角色。气溶胶可以通过吸收和散射作用改变地-气系统的辐射收支[1-3],可以作为云凝结核、冰核影响云微物理特性和云的发生发展进而影响辐射收支和降水过程[4-7]。气溶胶浓度或组成成分的任何变化都会以各种方式影响辐射收支、天气和气候变化[8-10]。随着城市化和工业化进程的加快,气溶胶对天气、气候和空气质量的影响越来越引起人们的重视[11-13]。大量的研究基于站点资料[14]、飞机或船载观测[15]、卫星遥感[16]和模式模拟[17-18]探讨了亚洲气溶胶的时空分布特征、输送过程及其对辐射收支、气温和降水的影响。
目前关于气溶胶辐射效应的研究主要是基于数值模式,但是不同模式的模拟结果之间有很大的差异[19]。模拟结果中气溶胶气候效应的不确定性可能来源于气溶胶光学厚度(AOD)、吸收特性和粒径分布等特性的误差[20],其中最主要的原因就是不够精确的气溶胶垂直分布[21-22]。模式的输入场来源于观测到的气溶胶性质并对其垂直剖面进行假设,然而这个假设存在很大的不确定性,现实中气溶胶的垂直分布与这些假设的差异较大[23]。此外,影响气溶胶间接辐射效应的一个重要因素就是气溶胶和云的混合状态[24]。研究表明,当气溶胶与云混合时气溶胶浓度与云滴有效半径之间有很强的相关性,而当气溶胶和云分离时二者没有这样的相关性[24-25]。目前,关于气溶胶的研究主要是基于整层大气气溶胶光学厚度、波长指数(AE)和单次散射反照率(SSA)等属性的水平分布[26-27],或者基于站点资料或者现场观测分析局地气溶胶光学特性的演变[28]。仅通过有限的几个观测站和短暂的野外观测所获得的气溶胶资料,来研究气溶胶的物理特性、化学特性和光学特性是远远不够的,对特定区域内气溶胶垂直分布的认识还远不够精确。
此外,关于中国气溶胶的时空分布及其气候效应的研究主要集中在工业污染较重的京津冀地区[28-30]、珠三角[31]和沙尘暴频发中国西北地区[2,5-6,17]。华东地区气溶胶浓度高、成分复杂[32-33],多种类型气溶胶同时存在,对天气、气候系统的影响机制比单一类型气溶胶(如,中国西北地区的沙尘气溶胶)更加复杂[34]。城市工业排放的气溶胶足以在中尺度天气系统中发挥重要作用,引发气温、风场和降水分布的大规模变化[35]。气候变暖背景下,气溶胶的变化使得华东地区气候变化和生态环境演变研究面临着新的挑战,研究气溶胶的三维分布是降低其气候效应和生态环境效应研究中不确定性的必要条件[4,36]。构建华东地区气溶胶的三维分布,厘清气溶胶与云的混合情况有利于提升数值模式的模拟水平,对提高气候预测和短期天气预报的准确度具有十分重要的意义[37-38]。
本文利用卫星遥感资料和再分析数据,分析了华东地区气溶胶的三维分布,并在此基础上探讨了气溶胶与云的混合情况,以期为改进数值模式参数化方案提供资料基础,对后期研究气溶胶的气候效应有重要意义。
-
MERRA-2(Modern-Era Retrospective Analysis for Research and Applications, Version 2)是第一个卫星时代的全球再分析数据集,来自美国国家航空航天局(NASA)。MERRA-2数据相比其第一版(MERRA),更新了数据同化系统(EEO-5),减少了由观测系统带来的误差,加深了对大气、水循环中物理过程的理解[39]。MERRA-2提供了从1980年到现在持续的近实时气候分析,包括水平面数据(例如地面数据、柱整合数据)、标准气压层数据(42层)、模式层数据(72层)和模式边界数据。数据的水平分辨率统一为0.625°×0.5°(经度×纬度)。本文用到的数据为气溶胶诊断产品tavgm_2d_aer_Nx提供的气溶胶光学厚度(AOD)。
-
2006年发射升空的极轨卫星CALIPSO(Cloud-Aerosol Lidar and Infrared Pathfinder Satellite Observation)上搭载的双波长偏振激光雷:云-气溶胶正交极化激光雷达(CALIOP,Cloud-Aerosol Lidar with Orthogonal Polarization)可以提供卫星轨道上的对流层和低平流层中的气溶胶和云层的全面剖析资料[2,16-17,23]。精确获得气溶胶、云的垂直结构和分布特征有助于人们更好地了解它们在气候系统中的作用。本文用到的产品为CALIPSO 2级产品:APro和VFM,数据垂直分辨率:8.3 km以下为30 m,8.3~20.2 km为60 m。其中,APro产品提供了气溶胶消光系数(EXT)廓线,VFM产品提供了大气中云和气溶胶类型的垂直分布,气溶胶分为:沙尘、污染性沙尘、烟尘、洁净的大陆性气溶胶、污染的大陆性气溶胶和海洋性气溶胶等。
本文将CALIPSO APro产品提供的气溶胶EXT网格化到一个分辨率为1°× 1°×500 m(经度×纬度×高度)的三维矩阵[23],分析华东地区气溶胶的三维分布。结合VFM产品提供的气溶胶类型和APro产品提供的气溶胶EXT,根据式(1)对特定类型的气溶胶EXT在垂直方向上积分计算各种类型气溶胶光学厚度(AODTYPE)。此外,本文还根据消光系数加权平均高度探讨了各类气溶胶在垂直方向上的分布特征。
-
CloudSat卫星是一颗专用于观测云层和降水的极轨卫星,2006年4月28日和CALIPSO由同一枚火箭发射到太空。CloudSat卫星上搭载的基于毫米波长的云廓线雷达(CPR),可以以较高精度(500 m的垂直分辨率)在全球尺度上提供云的垂直结构和云滴微观物理性质,有利于提高对云量、内部结构及其分布乃至气候效应的理解。CloudSat2B-CLDCLASS-LIDAR产品基于激光雷达和云廓线雷达的观测结果提供了卫星轨道上云顶、云底的高度和云分类数据[40],可用于分析云的垂直分布特征。
CloudSat与CALIPSO卫星轨道相同且几乎同时过境(间隔10~15 s),本文认为这2个卫星的观测资料是同时的。类似于WANG et al[41]提出的沙尘云的检测方法,本文将卫星观测的视角中同时出现云和气溶胶而且距离在60 m以内定义为气溶胶与云混合,探讨了各种类型气溶胶与云混合的发生频率。其中,CALIPSO VFM产品提供了云和气溶胶及其类型的垂直分布,CloudSat 2B-CLDCLASS-LIDAR产品提供的云垂直分布用于改进CALIPSO产品中对云和气溶胶的误判[17]。本文研究的时间尺度为2007~2017年。
-
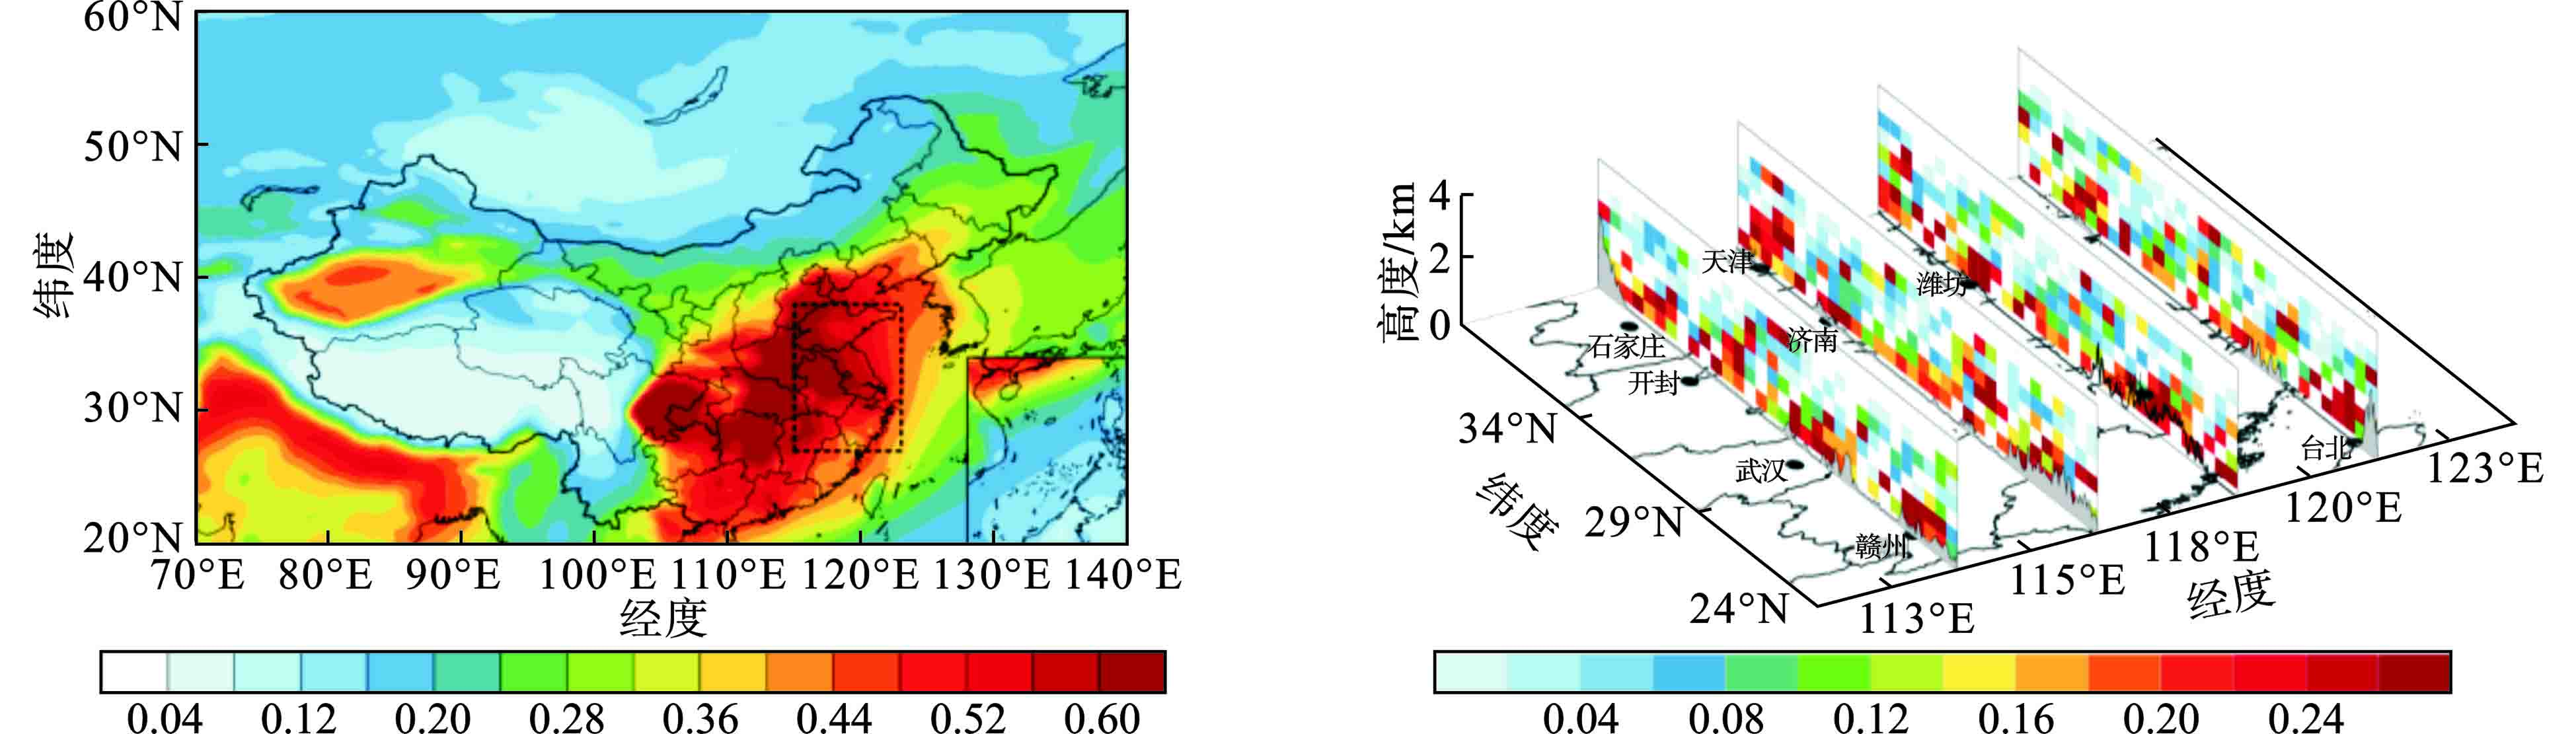
中国气溶胶光学厚度的水平分布和华东地区气溶胶消光系数的经向剖面,见图1。
图1a可知,中国气溶胶主要分布在中国东部地区、四川盆地以及沙漠遍布的塔里木盆地,华东地区(如图1中虚线框所示,27~38°N,115~123°E)由于经济发展快、人类活动频繁气溶胶含量较高,甚至明显高于沙尘暴频发的中国西北地区。为了更好地展现华东地区气溶胶的三维分布,本文扩大了图1b的范围。华东地区气溶胶含量较高尤其是安徽省北部和山东省西部(AOD>0.6),呈现西北高东南低的分布特征。图1b可知,气溶胶主要分布在人类活动频繁的大城市附近,气溶胶消光系数约为0.26 km−1且分布较高可以延伸到4 km的高空,其他地区气溶胶消光系数相对较小且主要分布在1 km以下的低空。这可能和城市人类活动排放高有关,此外,“城市热岛效应”引发的局地环流有利于气溶胶往高处输送。
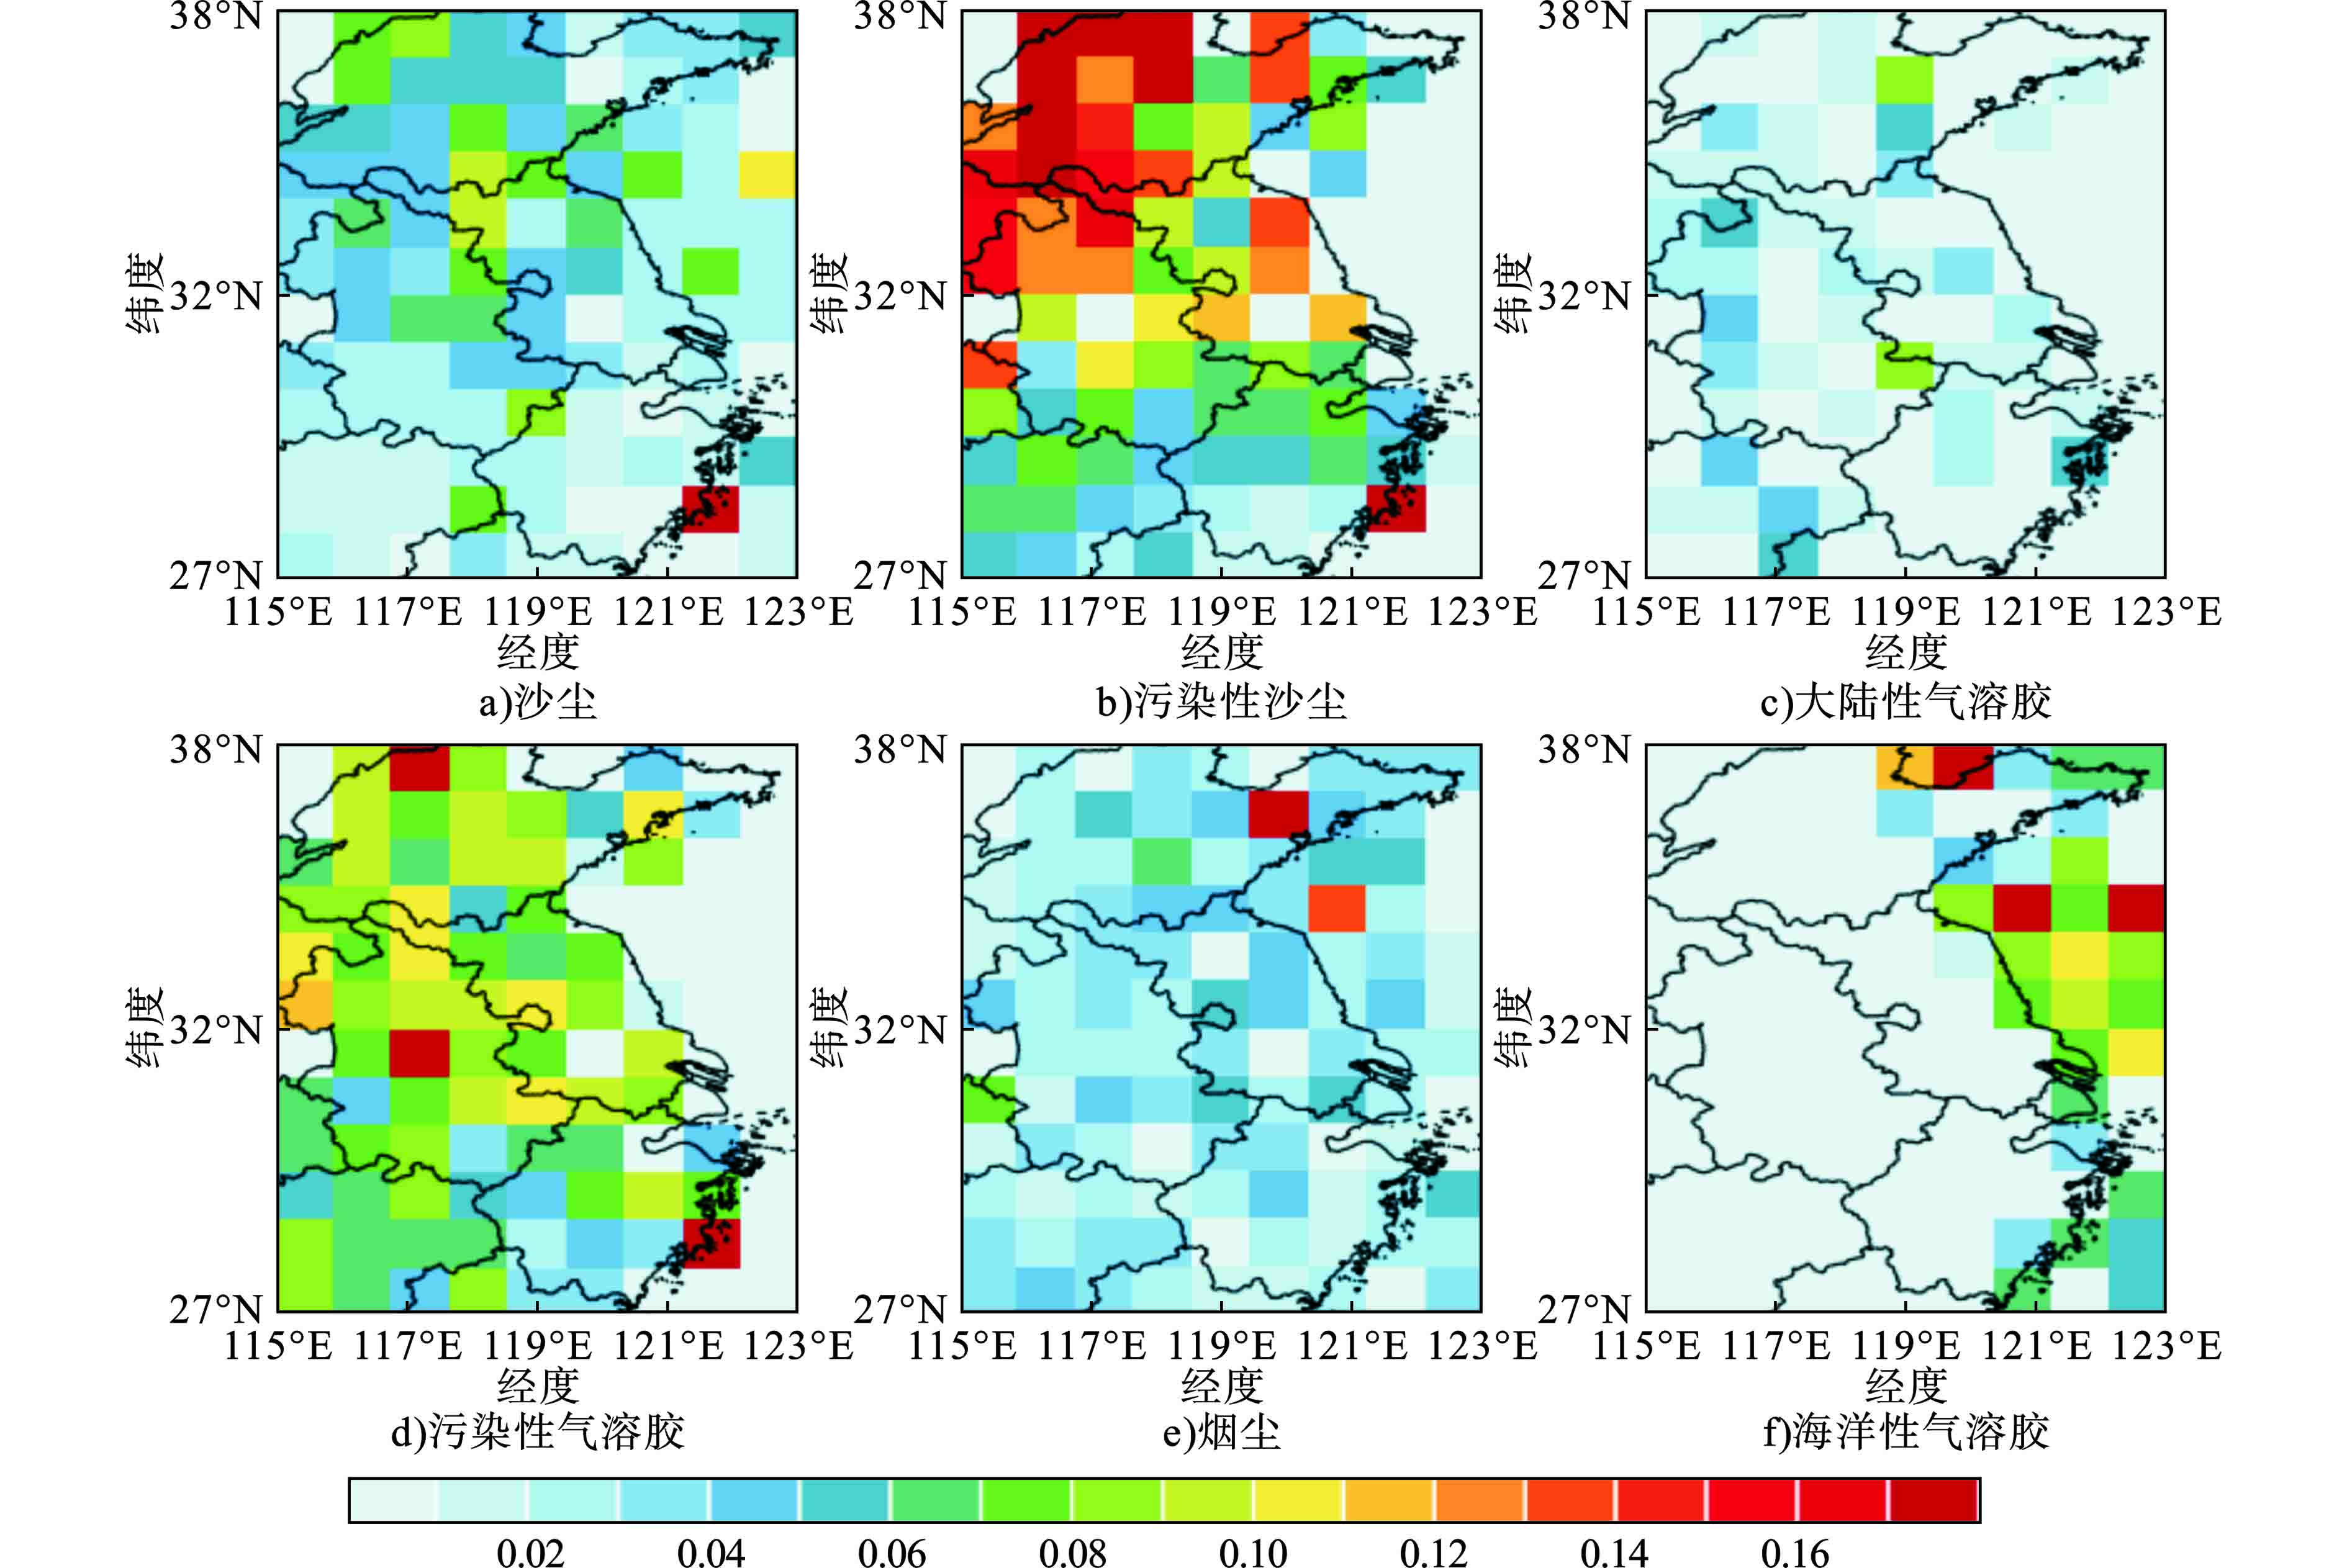
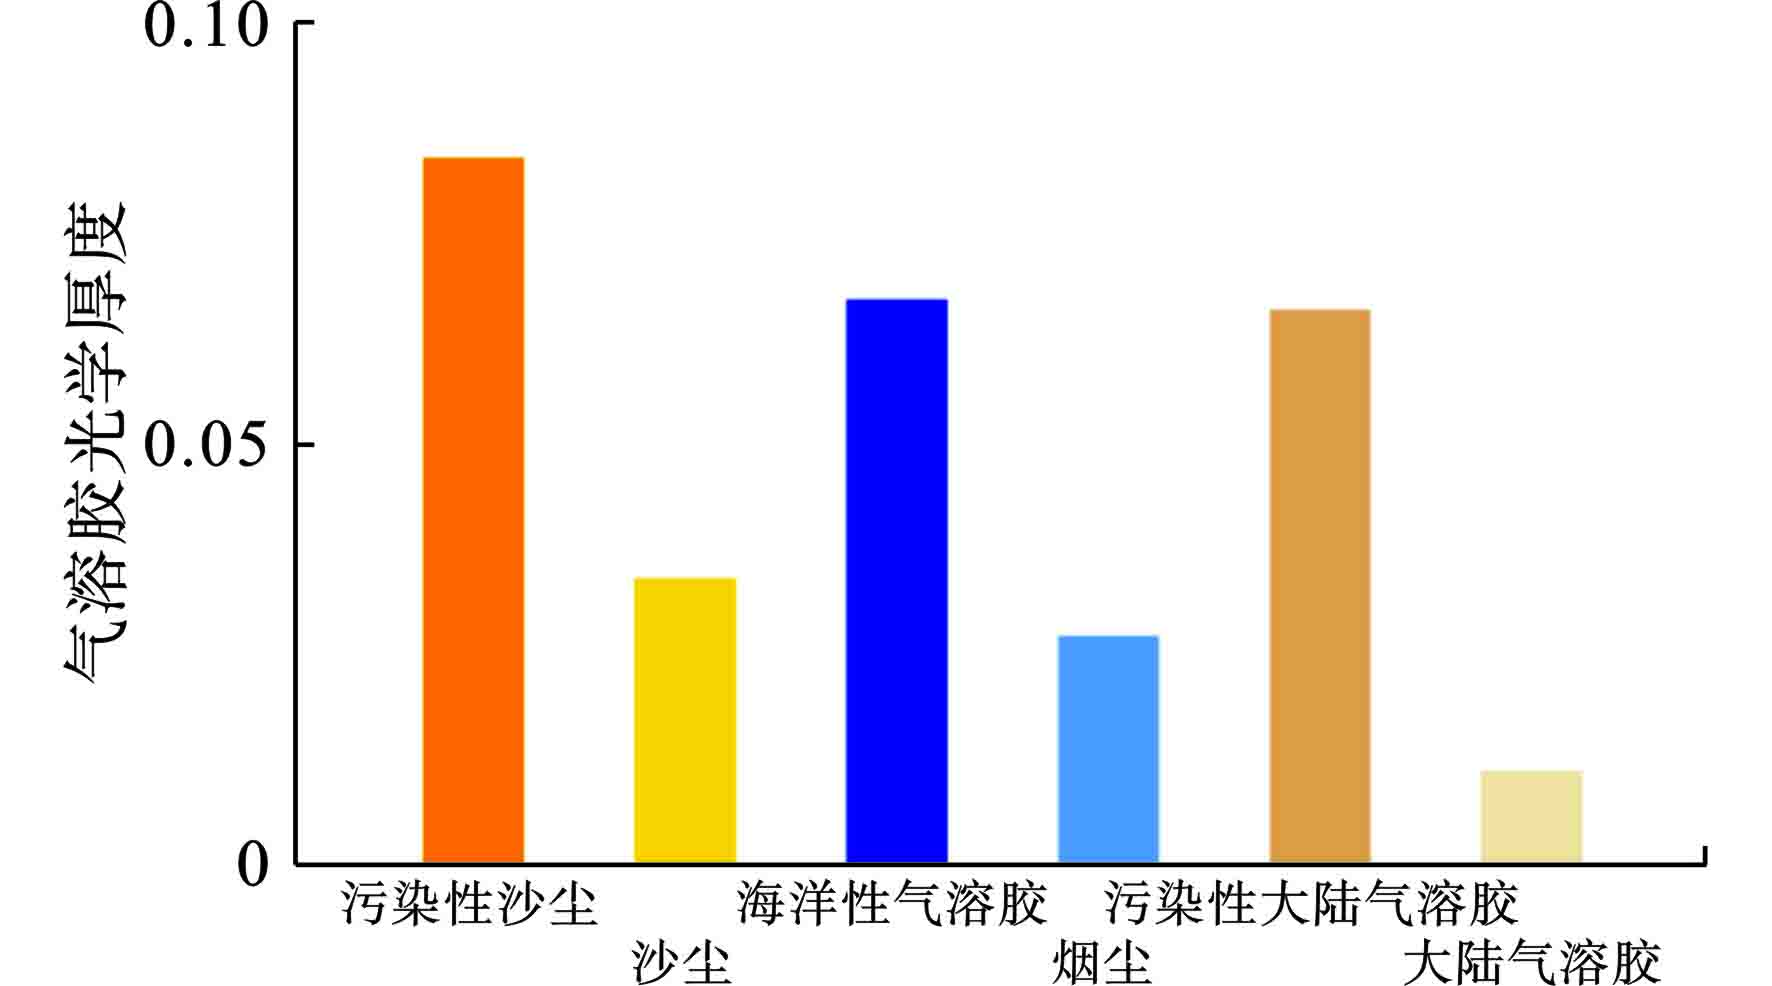
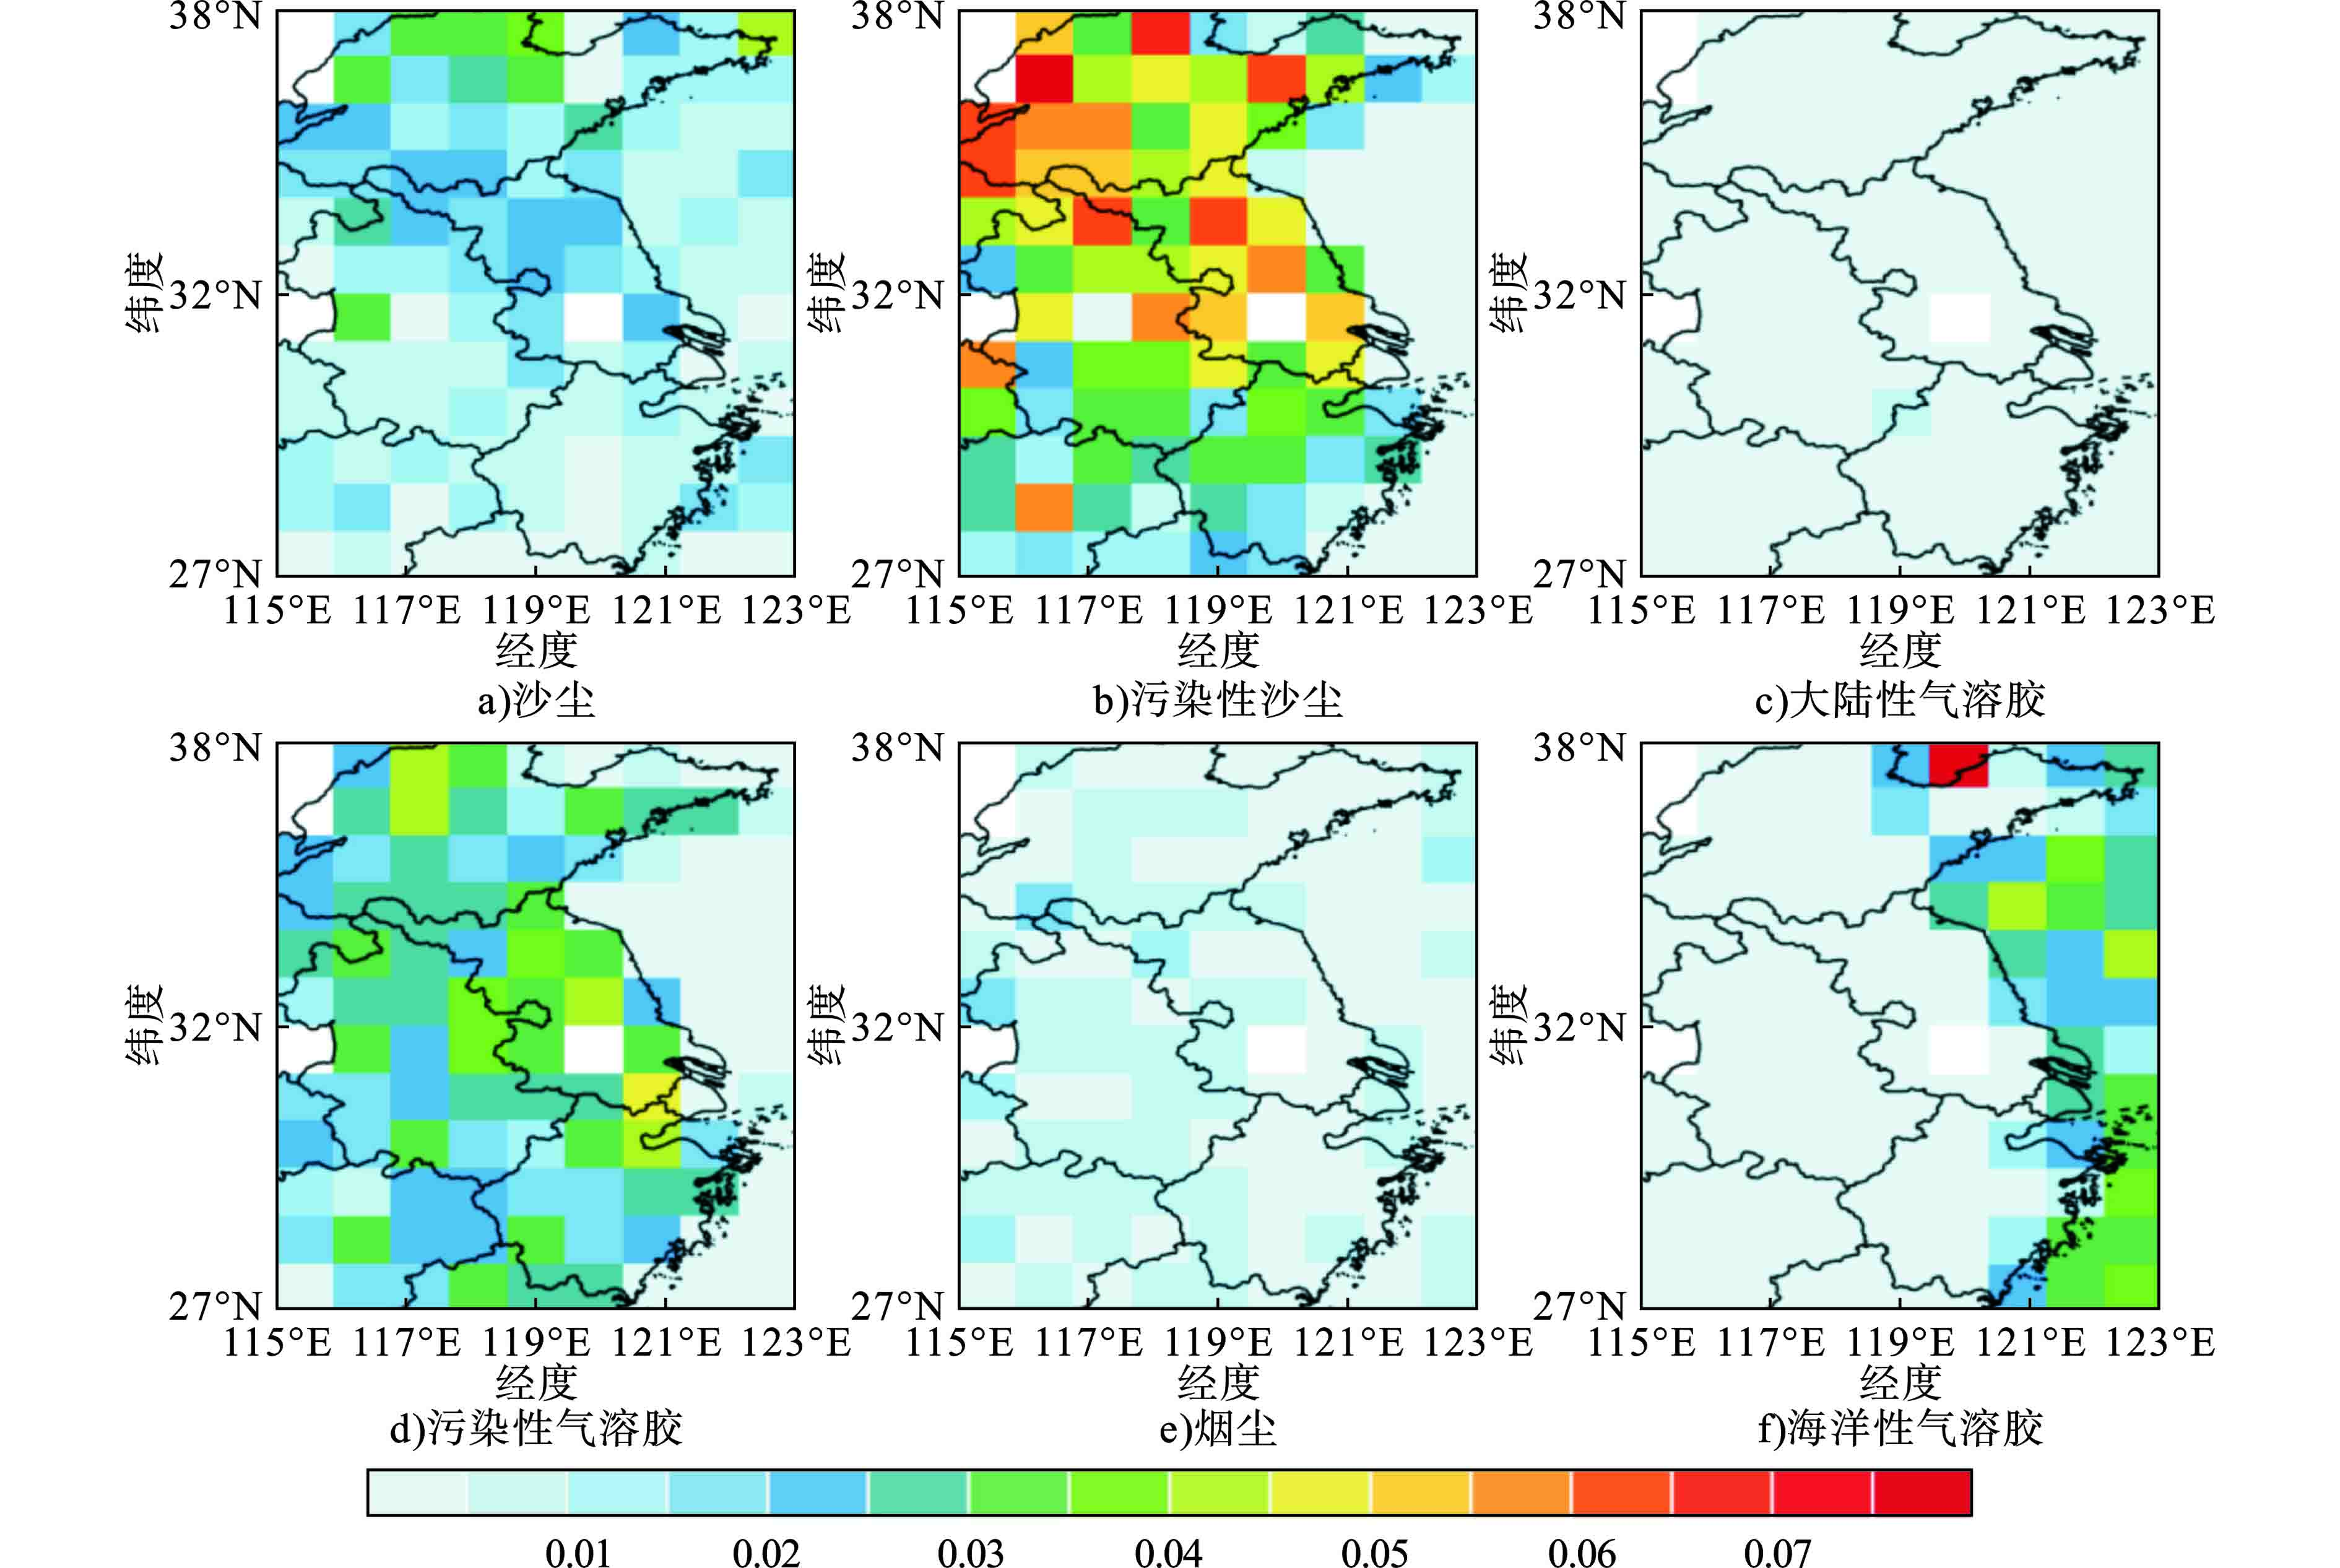
华东地区各种类型气溶胶光学厚度的水平分布和平均值,为了使用统一颜色棒,大陆气溶胶AOD扩大了10倍,见图2~3。
图2~3可知,华东地区气溶胶种类较为复杂,大气中的污染性沙尘、污染性大陆气溶胶和海洋性气溶胶都不容小视(AOD>0.06),其次为沙尘和烟尘(AOD约为0.04),洁净的大陆气溶胶含量较低几乎可以忽略。其中污染性沙尘和沙尘气溶胶呈现北高南低的分布特征,主要分布在山东省境内以及安徽省和江苏省的北部,这是因为该地区处于西风带下游,中国西北地区排放的沙尘气溶胶由西风输送而来,在输送过程中沙尘气溶胶和人为气溶胶混合而变性[42]。山东省境内的污染性沙尘气溶胶光学厚度甚至达到了0.18。污染性大陆气溶胶和烟尘气溶胶分布较为均匀。海洋性气溶胶主要分布在沿海地区,且呈现北高南低的分布特征。
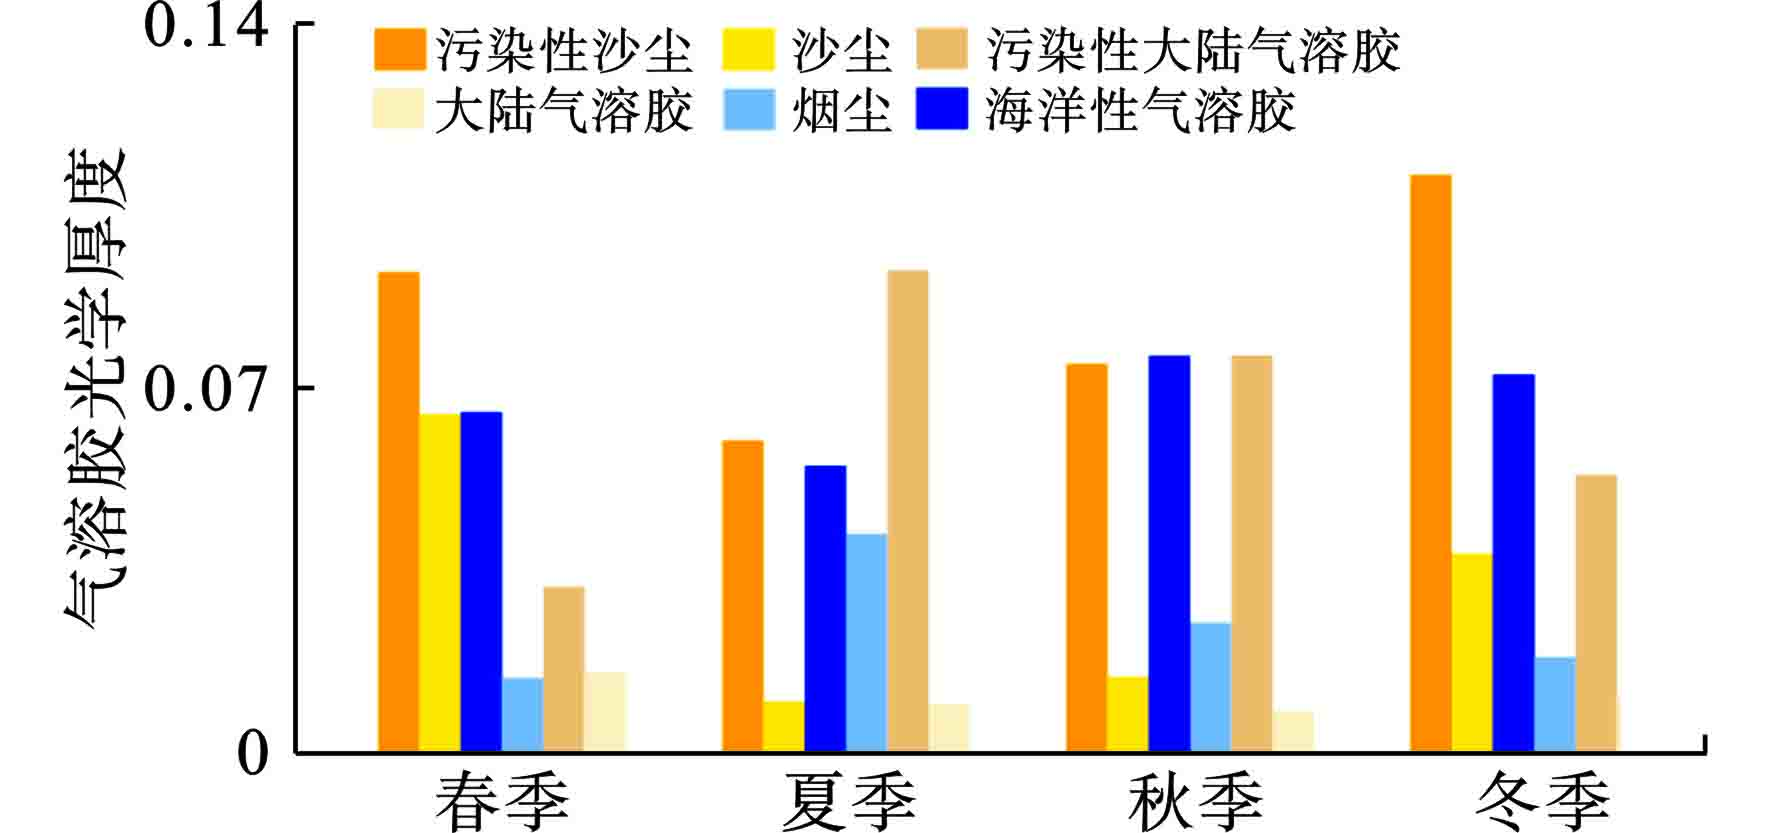
华东地区春、夏、秋、冬4季主要类型的气溶胶光学厚度,见图4。
图4可知,华东地区气溶胶有明显的季节变化,尤其是污染性沙尘、沙尘和污染性大陆气溶胶,海洋性气溶胶的季节变化相对较小。其中,污染性沙尘和沙尘气溶胶冬春季节大于夏秋季节,且沙尘气溶胶的比例也在冬春季节较高,这是因为夏秋季节中国西北地区沙尘排放少且夏季风盛行西北风较弱[42],沙尘气溶胶的东向输送较弱,输送过程中更容易和人为气溶胶混合而变性为污染性沙尘气溶胶。污染性大陆气溶胶和烟尘气溶胶则夏秋季节高于冬春季节。
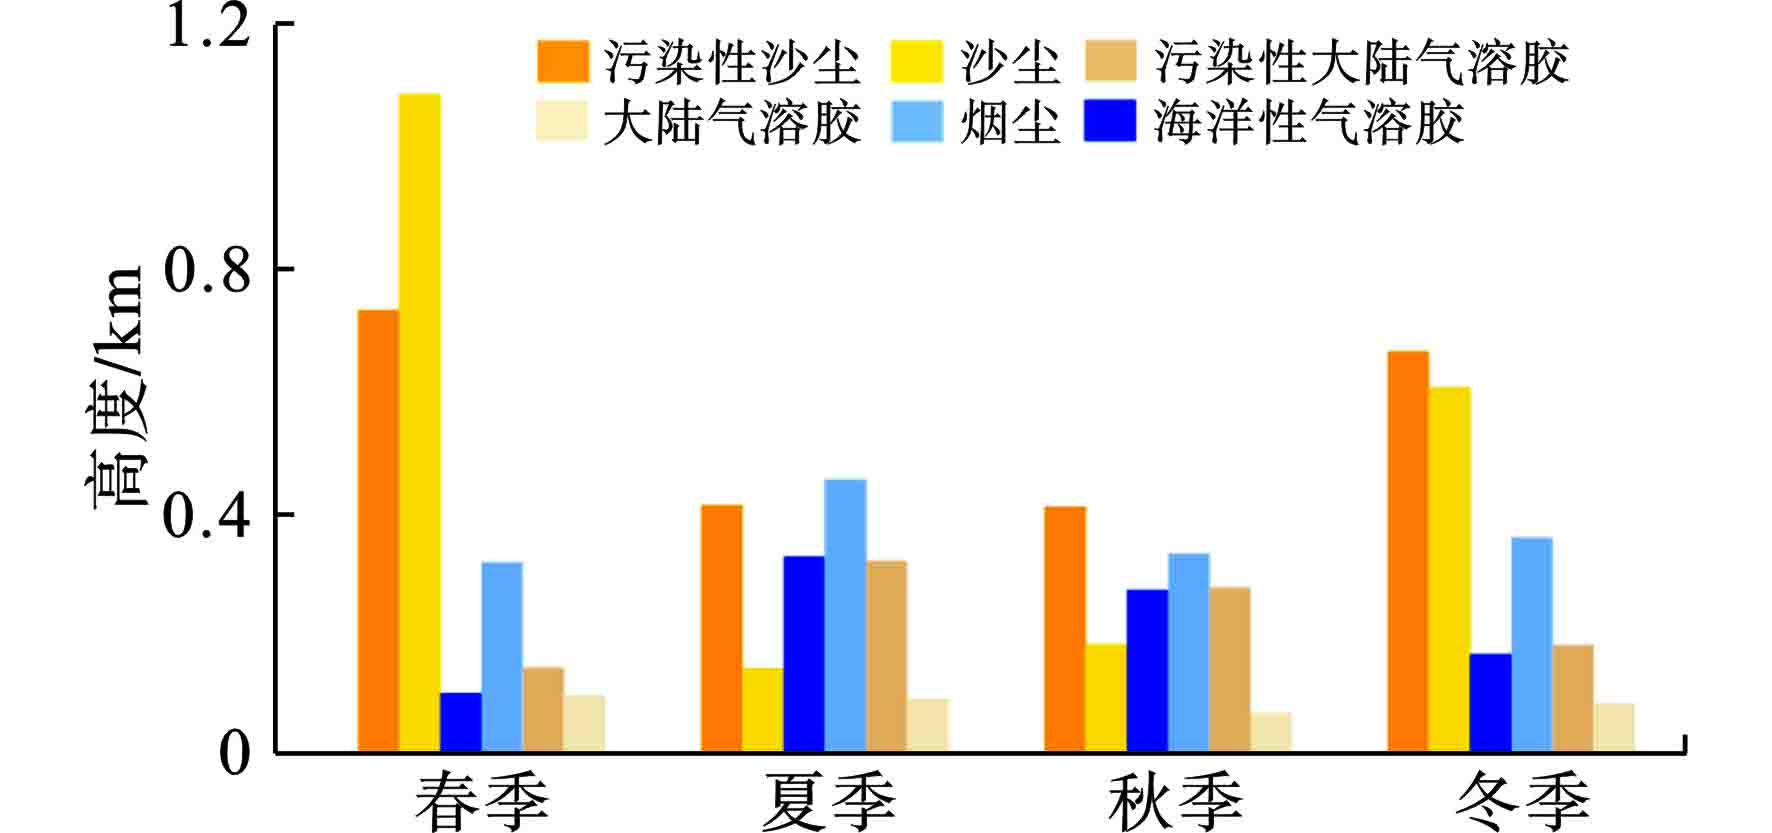
为了详细研究气溶胶的垂直分布,本文研究了华东地区春、夏、秋、冬4季主要类型气溶胶的消光系数加权平均高度(
$ {\mathrm{H}\mathrm{e}\mathrm{i}\mathrm{g}\mathrm{h}\mathrm{t}}_{\mathrm{T}\mathrm{Y}\mathrm{P}\mathrm{E}}=\int {\mathrm{E}\mathrm{X}\mathrm{T}}_{\mathrm{T}\mathrm{Y}\mathrm{P}\mathrm{E}}\mathrm{d}z/ $ $ \int {\mathrm{E}\mathrm{X}\mathrm{T}}_{\mathrm{T}\mathrm{Y}\mathrm{P}\mathrm{E}} $ ),见图5。图5可知,冬春季节,远距离输送而来的污染性沙尘和沙尘气溶胶的垂直分布明显高于其他类型气溶胶,尤其是春季沙尘气溶胶的垂直分布(甚至超过了1 km)。这是因为,污染性沙尘和沙尘气溶胶由中国西北地区在强西北风的作用下持续地、快速地往下游输送,远距离输送而来的气溶胶多为细粒子,在快速的输送过程中不易沉降,因此垂直分布较高。尤其是春季,中国西北地区沙尘排放最强、沙尘气溶胶水平质量通量也达到了最大[42],大量的沙尘气溶胶输送到下游地区并在输送过程中和其他气溶胶混合变为污染性沙尘,因此华东地区沙尘和污染性沙尘含量最多(AOD最大,见图4)。由于其他类型气溶胶垂直分布较低,在快速的输送过程中,这种混合一般发生在低层,因此春季污染性沙尘气溶胶含量高(AOD大)、垂直分布较低,对人类生活的影响更大。而夏秋季节夏季风盛行,沙尘气溶胶的输送较弱,在冬季风盛行时由于沙尘气溶胶排放较少其东向输送也相对较弱[42],在输送过程中沙尘气溶胶与其他类型气溶胶的混合较为充分。除此之外,以局地排放为主的海洋性气溶胶、烟尘气溶胶以及污染性大陆气溶胶的垂直分布都是夏秋季节高于冬春季节。这是因为夏秋季节温度较高、边界层高度高,大气垂直运动较强,气溶胶分布较高。
类似于文献[41]沙尘云的定义,本文讨论了华东地区各种类型气溶胶和云的混合情况,见图6。
由于在大气中含量较多(图3和图4)、垂直分布较高(图5),华东地区的气溶胶和云混合发生频率最高的是污染性沙尘,主要发生在山东省和江苏省境内,发生频率甚至达到了8%~10%。和云混合出现频率其次是污染性大陆气溶胶,分布较为均匀。由于海洋上云量较多且云底高度低[43],海洋性气溶胶和云的混合出现频率也较高(4%左右),主要出现在沿海地区。沙尘云与污染性沙尘和云混合分布类似,只是出现频率较低(2%左右)。由于在大气中含量低、垂直分布低,洁净的大陆气溶胶、烟尘气溶胶和云混合的出现频率较低。
-
华东地区由于经济发展快、人类活动频繁,大气中气溶胶含量较高且气溶胶种类较为复杂,呈现西北高东南低的分布特征。在人类活动频繁的大城市附近,气溶胶消光系数较强(约为0.26 km−1)且分布较高(4 km),其他地区气溶胶消光系数相对较小且垂直分布较低。大气中的污染性沙尘、污染性大陆气溶胶和海洋性气溶胶都不容小视,其次为沙尘和烟尘气溶胶,洁净的大陆气溶胶含量较低几乎可以忽略。
污染性沙尘和沙尘气溶胶呈现北高南低的分布特征,主要分布在山东省以及安徽省和江苏省的北部,冬春季节大于夏秋季节,其垂直分布也是冬春季节高于夏秋季节且明显高于其他类型气溶胶。污染性大陆气溶胶和烟尘气溶胶分布较为均匀,夏秋季节大于冬春季节,其垂直分布也是夏秋季节高于冬春季节。海洋性气溶胶主要分布在沿海地区,且呈现北高南低的分布特征,季节变化较小。
华东地区气溶胶和云混合的发生频率与其水平分布大体一致,和云混合发生频率最高的气溶胶是污染性沙尘,主要发生在山东省和江苏省境内,发生频率甚至达到了8%~10%。其次是污染性大陆气溶胶和海洋性气溶胶,污染性大陆气溶胶和云混合分布较为均匀,海洋性气溶胶和云混合主要出现在沿海地区。洁净的大陆气溶胶和烟尘气溶胶与云混合的出现频率较低。
华东地区气溶胶的三维分布特征研究
Research on three-dimensional distribution of aerosols over East China
-
摘要: 文章利用卫星遥感资料和再分析数据,分析华东地区气溶胶的三维分布,并基于此探讨气溶胶与云的混合情况。华东地区气溶胶含量较高,呈西北高东南低分布,大城市附近气溶胶消光系数较大(约为0.26 km−1)、垂直分布较高(约4 km)。华东地区气溶胶种类复杂,气溶胶光学厚度污染性沙尘>海洋性气溶胶>污染性大陆气溶胶>沙尘>烟尘,大陆性气溶胶含量最低。污染性沙尘和沙尘主要分布在山东省、安徽省和江苏省的北部,冬春>夏秋;污染性大陆气溶胶和烟尘均匀分布,夏秋>冬春;海洋性气溶胶主要分布在沿海地区,季节变化较小。气溶胶和云混合的发生频率与其水平分布大体一致,发生频率最高的是污染性沙尘(甚至达到了8%~10%),其次是污染性大陆气溶胶和海洋性气溶胶。Abstract: Using satellite remote sensing and reanalysis data, the three-dimensional distribution of aerosols over East China and their mixing situation with clouds are analyzed. The overall concentration of aerosols over East China is relatively high with a higher distribution in the northwest and a lower distribution in the southeast. The aerosol extinction coefficients near large cities are relatively larger (about 0.26 km-1) and higher in vertical distribution (about 4 km) than those over other areas. The types of aerosols over East China are complex, with AOD (aerosol optical depth) of polluted dust > marine aerosol > polluted continental aerosol > dust > smoke. The concentration of continental aerosol is the lowest. Polluted dust and dust are mainly distributed in Shandong, the northern part of Anhui and Jiangsu, with AODs in winter and spring > those in summer and autumn. While polluted continental and smoke aerosols are distributed uniformly, with AODs in summer and autumn > those in winter and spring. Marine aerosol is mainly distributed over the coastal areas featuring small seasonal changes. The frequencies of aerosols mixed with clouds are roughly the same as their horizontal distribution, with the highest frequency of the polluted continental aerosol (even up to 8%~10%), followed by polluted continental and marine aerosols.
-
Key words:
- East China /
- aerosol classification /
- three-dimensional distribution /
- cloud
-

-
[1] DING A J, FU C B, YANG X Q, et al. Intense atmospheric pollution modifies weather: A case of mixed biomass burning with fossil fuel combustion pollution in eastern China[J]. Atmospheric Chemistry and Physics, 2013, 13(20): 10545 − 10554. doi: 10.5194/acp-13-10545-2013 [2] HUANG J, FU Q, SU J, et al. Taklimakan dust aerosol radiative heating derived from CALIPSO observations using the Fu-Liou radiation model with CERES constraints[J]. Atmospheric Chemistry and Physics, 2009, 9(12): 4011 − 4021. doi: 10.5194/acp-9-4011-2009 [3] LIU Y, JIA R, DAI T, et al. A review of aerosol optical properties and radiativeeffects[J]. Journal of Meteorological Research, 2014, 28(6): 1003 − 1028. doi: 10.1007/s13351-014-4045-z [4] CHEN Q, YIN Y, JIN L, et al. The effect of aerosol layers on convective cloud microphysics and precipitation[J]. Atmospheric Research, 2011, 101(1-2): 327 − 340. doi: 10.1016/j.atmosres.2011.03.007 [5] HUANG J, MINNIS P, YAN H, et al. Dust aerosol effect on semi-arid climate over Northwest China detected from A-Train satellite measurements[J]. Atmospheric Chemistry and Physics, 2010, 10(14): 6863 − 6872. doi: 10.5194/acp-10-6863-2010 [6] HUANG J, WANG T, WANG W, et al. Climate effects of dust aerosols over East Asian arid and semiarid regions[J]. Journal of Geophysical Research Atmospheres, 2014, 119(19): 11398 − 11416. [7] LI Z, NIU F, FAN J, et al. Long-term impacts of aerosols on the vertical development of clouds and precipitation[J]. Nature Geoscience, 2011, 4(12): 888 − 894. doi: 10.1038/ngeo1313 [8] CHOI I J, IGUCHI T, KIM S W, et al. The effect of aerosol representation on cloud microphysical properties in Northeast Asia[J]. Meteorology and Atmospheric Physics, 2014, 123(3-4): 181 − 194. doi: 10.1007/s00703-013-0288-y [9] ROSENFELD D, SHERWOOD S, WOOD R, et al. Climate effects of aerosol-cloud interactions[J]. Science, 2014, 343(6169): 379 − 380. doi: 10.1126/science.1247490 [10] ZHAO C, HU Z, QIAN Y, et al. Simulating black carbon and dust and their radiative forcing in seasonal snow: A case study over North China with field campaign measurements[J]. Atmospheric Chemistry and Physics, 2014, 14(20): 11475 − 11491. doi: 10.5194/acp-14-11475-2014 [11] RAMANATHAN V, CARMICHAEL G R. Global and regional climate changes due to black carbon[J]. Nature Geoscience, 2008, 1(4): 221 − 227. doi: 10.1038/ngeo156 [12] HUANG K, ZHUANG G, LI J, et al. Mixing of Asian dust with pollution aerosol and the transformation of aerosol components during the dust storm over China in spring 2007[J]. Journal of Geophysical Research, 2010, 115: D00K13. [13] DENG J, XU H. Nonlinear effect on the East Asian summer monsoon due to two coexisting anthropogenic forcing factors in eastern China: an AGCM study[J]. Climate Dynamics, 2015, 7(46): 3767 − 3784. [14] LIU Y, HUANG J, SHI G, et al. Aerosol optical properties and radiative effect determined from sky-radiometer over Loess Plateau of Northwest China[J]. Atmospheric Chemistry and Physics, 2011, 11: 11455 − 11463. doi: 10.5194/acp-11-11455-2011 [15] DICKERSON R R, LI C, LI Z, et al. Aircraft observations of dust and pollutants over ne china: insight into the meteorological mechanisms of long-range transport[J]. Journal of Geophysical Research Atmospheres, 2007, 112(D24): 177 − 180. [16] JIA R, LIU Y, CHEN B, et al. Source and transportation of summer dust over the Tibetan Plateau[J]. Atmospheric Environment, 2015, 123: 210 − 219. doi: 10.1016/j.atmosenv.2015.10.038 [17] JIA R, LIU Y Z, HUA S, et al. Estimation of the aerosol radiative effect over the Tibetan Plateau based on the latest CALIPSO product[J]. Journal of Meteorological Research, 2018, 32(5): 707 − 722. doi: 10.1007/s13351-018-8060-3 [18] ZHU Q, LIU Y, JIA R, et al. A numerical simulation study on the impact of smoke aerosols from Russian forest fires on the air pollution over Asia[J]. Atmospheric Environment, 2018, 182: 263 − 274. doi: 10.1016/j.atmosenv.2018.03.052 [19] SCHULZ M, TEXTOR C, KINNE S, et al. Radiative forcing by aerosols as derived from the AeroCom present-day and pre-industrial simulations[J]. Atmospheric Chemistry and Physics, 2006, 6(12): 5225 − 5246. doi: 10.5194/acp-6-5225-2006 [20] LEE S S, TAO W K, JUNG C H. Aerosol effects on instability, circulations, clouds, and precipitation[J]. Advances in Meteorology, 2015, 2014(7): 1 − 8. [21] ZARZYCKI C M, BOND T C. How much can the vertical distribution of black carbon affect its global direct radiativeforcing[J]. Geophysical Research Letters, 2010, 37(20): 114 − 122. [22] SAMSET B H, MYHRE G, SCHULZ M, et al. Black carbon vertical profiles strongly affect its radiative forcing uncertainty[J]. Atmospheric Chemistry and Physics, 2013, 13(5): 2423 − 2434. doi: 10.5194/acp-13-2423-2013 [23] ADAMS A M, PROSPERO J M, ZHANG C. CALIPSO-derived three-dimensional structure of aerosol over the Atlantic Basin and adjacent continents[J]. Journal of Climate, 2012, 25(19): 6862 − 6879. doi: 10.1175/JCLI-D-11-00672.1 [24] SAMSET B H, MYHRE G. Vertical dependence of black carbon, sulphate and biomass burning aerosol radiativeforcing[J]. Geophysical Research Letters, 2011, 38(24): L24802. [25] COSTANTINO L, BREON F M. Analysis of aerosol-cloud interaction from multi-sensor satellite observations[J]. Geophysical Research Letters, 2010, 37(11): L11801. [26] 刘海知, 郭海燕, 马振峰, 等. 2001—2017 年全国气溶胶光学厚度时空分布及变化趋势[J]. 环境科学, 2019, 40(9): 38 − 52. [27] 刘状, 孙曦亮, 刘丹, 等. 2001—2017年中国北方省份气溶胶光学厚度的时空特征[J]. 环境科学学报, 2018, 38(8): 225 − 232. [28] CHE H, XIA X, ZHU J, et al. Aerosol optical properties under the condition of heavy haze over an urban site of Beijing, China[J]. Environmental Science and Pollution Research, 2015, 22(2): 1043 − 1053. doi: 10.1007/s11356-014-3415-5 [29] JING J, WU Y, TAO J, et al. Observation and analysis of near-surface atmospheric aerosol optical properties in urban Beijing[J]. Particuology, 2015, 18: 144 − 154. doi: 10.1016/j.partic.2014.03.013 [30] TAO J, GAO J, ZHANG L, et al. Chemical and optical characteristics of atmospheric aerosols in Beijing during the Asia-Pacific Economic Cooperation China 2014[J]. Atmospheric Environment, 2016, 144: 8 − 16. doi: 10.1016/j.atmosenv.2016.08.067 [31] CHEN J, XIN J, AN J, et al. Observation of aerosol optical properties and particulate pollution at background station in the Pearl River Delta region[J]. Atmospheric Research, 2014, 143: 216 − 227. doi: 10.1016/j.atmosres.2014.02.011 [32] 范辰乾. 基于MODIS数据的气溶胶光学厚度与PM2.5浓度关系研究——以济南市为例[D]. 济南: 山东师范大学, 2014. [33] 张静珠. 济南市冬季水相二次有机气溶胶的初步研究[D]. 济南: 山东大学, 2018. [34] 陆天蔚, 张晶, 乔岩, 等. 长三角地区气溶胶对辐射和降水影响[J]. 北京师范大学学报(自然科学版), 2019, 55(1): 135 − 144. [35] KAWECKI S, HENEBRY G M, STEINER A L. Effects of urban plume aerosols on a mesoscale convective system[J]. Journal of the Atmospheric Sciences, 2016, 73(12): 4641 − 4660. doi: 10.1175/JAS-D-16-0084.1 [36] LEE S S, GUO J, LI Z. Delaying precipitation by air pollution over the Pearl River Delta. Part II: Model simulations[J]. Journal of Geophysical Research, 2016, 121(19): 11739 − 11760. [37] ZHANG B, WANG Y, HAO J. Simulating aerosol-radiation-cloud feedbacks on meteorology and air quality over eastern China under severe haze conditions in winter[J]. Atmospheric Chemistry and Physics, 2015, 15(5): 2387 − 2404. doi: 10.5194/acp-15-2387-2015 [38] MA J, GUO X, ZHAO C, et al. Recent progress in cloud physics research in China[J]. Advances in Atmospheric Sciences, 2007, 24(6): 1121 − 1137. doi: 10.1007/s00376-007-1121-7 [39] GELARO R, MCCARTY W, MAX J S, et al. The modern-era retrospective analysis for research and applications, Version 2 (MERRA-2)[J]. Journal of Climate, 2017, 30(14): 5419 − 5454. doi: 10.1175/JCLI-D-16-0758.1 [40] HENDERSON D S, L'ECUYER T, STEPHENS G L, et al. A multisensor perspective on the radiative impacts of clouds and aerosols[J]. Journal of Applied Meteorology and Climatology, 2013, 52(4): 853 − 871. doi: 10.1175/JAMC-D-12-025.1 [41] WANG W, HUANG J, MINNIS P, et al. Dusty cloud properties and radiative forcing over dust source and downwind regions derived from A-Train data during the Pacific Dust Experiment[J]. Journal of Geophysical Research Atmospheres, 2010, 115(D4): D00H35. [42] 贾瑞, 刘玉芝, 吴楚樵, 等. 2007—2017年中国沙尘气溶胶的三维分布特征及输送过程[J]. 中国沙漠, 2019, 39(6): 108 − 117. [43] 方乐锌, 李昀英, 孙国荣, 等. 基于CloudSat–CALIPSO资料的全球不同类型云的水平和垂直分布特征[J]. 气候与环境研究, 2016(5): 547 − 556. -
 点击查看大图
图( 6)
计量
- 文章访问数: 2938
- HTML全文浏览数: 2938
- PDF下载数: 24
- 施引文献: 0


