-
河口为陆地-海洋相互作用的重要界面和陆源物质进入海洋的主要过渡区,对于地球表面物质循环具有重要意义。天然和人为源的重金属从陆地到近海水域是以河口为主要运输路径。河口的复杂流体动力学在悬浮物的运输,沉积和再悬浮中起着关键作用[1-2],影响河口邻近海域的重金属的空间分布、转化和生物富集。重金属具有生物毒性、持久性、不可降解性以及广泛的来源性,是对海洋环境的最大威胁之一[3-5]。在2009年黄河口表层海水中溶解态重金属(Cu、Pb、Zn、Cd、Hg和As)的平均浓度分别为2.65、0.51、37.7、0.68、0.013、0.92 µg·L−1。溶解态重金属的含量从黄河口以及其近岸海域到远海逐渐减少说明溶解态重金属的浓度受人类活动、黄河流域污染的影响。据估计黄河能承受的重金属污染物总负荷预估为687 t至1110 t[6-7]。对比过去的研究,黄河三角洲的重金属污染有所增加[8-9]。与1980年代相对比,2001年的黄河河口及其邻近海域的重金属汞的含量高出6倍到8倍[10]。研究认为农业、工业和大气沉降可能是黄河口溶解态重金属的来源,近岸海流、沿海上升流和各理化参数可能是溶解态重金属空间和季节分布的主要影响因素[11]。
黄河是中国第二长河,是世界上悬浮泥沙含量最高的河流,每年向河口输送大量的泥沙对黄河口湿地及其附近海域环境产生影响,过去研究认为黄河口附近海域的重金属含量主要受自然过程影响[12]。近年来黄河流域生态环境逐渐改善,黄河向河口输沙量减少,同时随着黄河流域经济的快速发展,向黄河排放的污染物也在增加。但近些年对黄河口重金属的研究较少,本研究通过研究黄河口邻近海域重金属形态的变化特征,分析重金属来源的变化,弥补这方面的不足,并可为黄河流域的保护和高质量发展提供一定的科学依据。
-
随鲁昌渔60003分别对黄河口邻近海域进行布点采样。2020年8月和10月分别布设了37个和40个采样点(图1)。用有机玻璃采水器分别取表、底层水样及10%平行样质量控制样品。用混合纤维滤膜过滤收集海水中的悬浮颗粒物,置于膜盒内密封-20℃保存带回实验室,用于测定颗粒态重金属的含量;过滤后水样倒入聚四氟乙烯瓶,加硝酸酸化固定,用于测定水中金属元素。同时记录风速风向、水色、透明度和气温等参数。水温、水深、pH、溶解氧、盐度等海水参数由多参数水质仪实时测定;根据海洋监测规范(GB 17378)采集样品测定叶绿素 a、营养盐(硝酸盐、亚硝酸盐等)、COD 等。
-
颗粒态重金属,将过滤后的混合纤维滤膜置于消解罐中(海洋监测技术规程HY/T147.2—2013),加入浓硝酸微波消解,定容于50 mL的比色管中,由ICP-MS(Agilent 7900)测定Cu、Pb、Zn、Cr、Cd、Fe、Al等元素,用PCu、PPb、PZn、PCr、PCd、PFe、PAl表示。
溶解态重金属,按照海洋监测技术规程(HY/T147.1—2013),取 1 mL 过滤后的水样加9 mL1%的硝酸溶液稀释10倍,由ICP-MS(Agilent 7900)测定Cu、Pb、Zn、Cr、Cd、Fe、Al等元素。用DCu、DPb、DZn、DCr、DCd、DFe、DAl表示。Cu、Pb、Zn、Cd、Cr、As的检出限分别为0.12、0.07、0.10、0.03、0.05、0.05 µg·L−1。水中总重金属浓度为溶解态和颗粒态重金属之和。玻璃和塑料器皿均用3 mol·L−1硝酸浸泡 24 h。每隔10个样品设置1组平行,相对标准偏差均<5%。
叶绿素采用分光光度法测定,COD采用碱性高锰酸钾法测定,详见海洋监测规范(GB17378.4—2007);营养盐采用流动分析法测定,详见海洋监测技术规程(HY/T147.1—2013)。
-
表1列出了黄河口夏秋两个季节的理化参数值。水温在夏季明显高于秋季。秋季表层悬浮颗粒物高于夏季表层,夏秋两季表层盐度和COD相差不大。秋季pH、DO、叶绿素a均高于夏季。
-
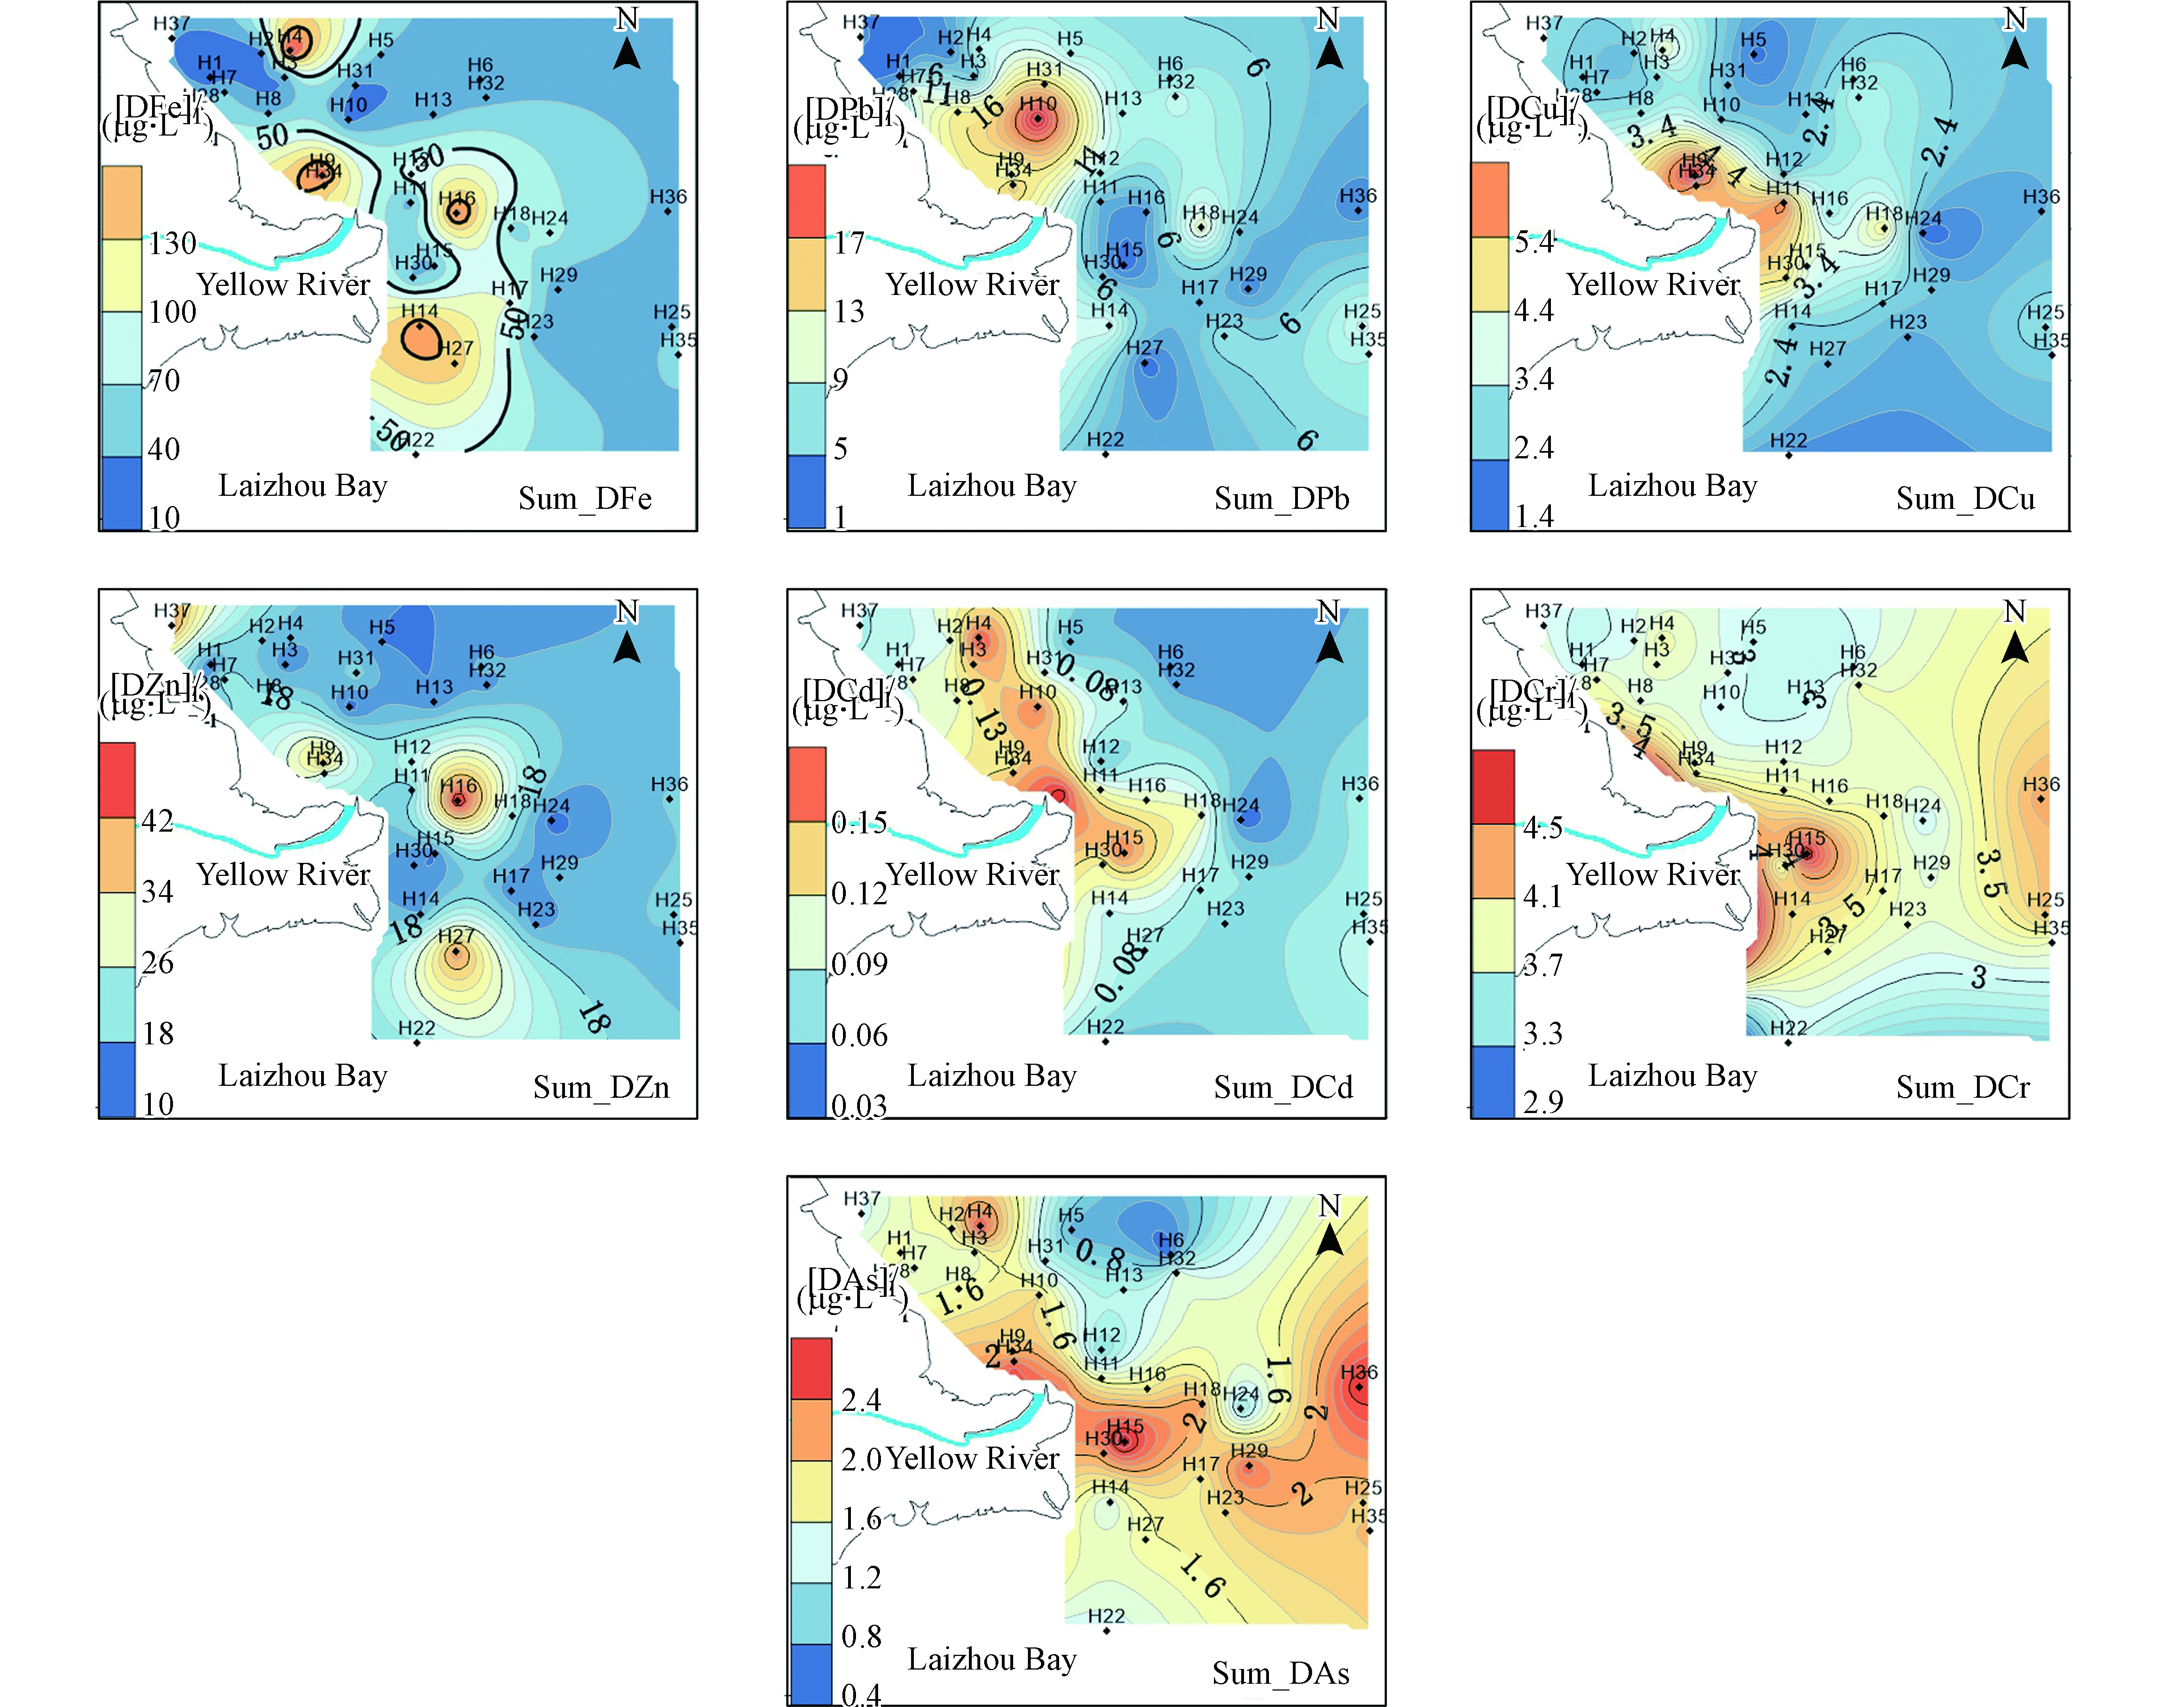
夏季DFe、DPb、DCu、DZn、DCd、DCr、DAs的浓度平均值分别为45.2、7.33、2.87、18.0、0.0979、3.24、1.65 µg·L−1,浓度变化范围分别为12.9—154、1.05—26.5、1.41—6.83、10.5—45.9、0.03—0.18、2.54—4.71、0.426—2.65 µg·L−1。溶解态重金属浓度整体呈现自河口至远海逐渐降低的分布趋势。DFe、DCd和DAs在河口西北部出现高浓度(图2),是由于站位受东营港的人为活动输入以及轮船排污等影响;DFe、DZn和DCd在河口东南部出现高浓度可能是由于旧黄河口地下径流输入影响,以及此区域水流变缓、各种离子的剧烈变化引起的水化学反应导致;DAs在黄河口东部远海内部出现高浓度可能是由于近些年近海养殖区夏季投饵造成。
夏季PFe、PPb、PCu、PZn、PCd、PCr、PAs的浓度变化范围为167—9832、0.6—21.6、0.4—10.6、4.2—29.7、0.004—0.107、0.66—17.3、0.12—6.13 µg·L−1。颗粒态重金属均呈现出在三角洲东部出现高浓度区域(图3),但PPb的含量在黄河入海口附近要大于三角洲东部区域,整体上向东部和北部海域逐渐递减。这种分布特点主要是由于黄河携带大量的悬浮颗粒物注入渤海,在河口出现了高值区;同时在黄河冲淡水与沿渤海沿岸流、潮汐作用下,在三角洲东部出现颗粒态重金属的最大值,颗粒态金属的分布基本上与悬浮颗粒物的分布特点一致。
-
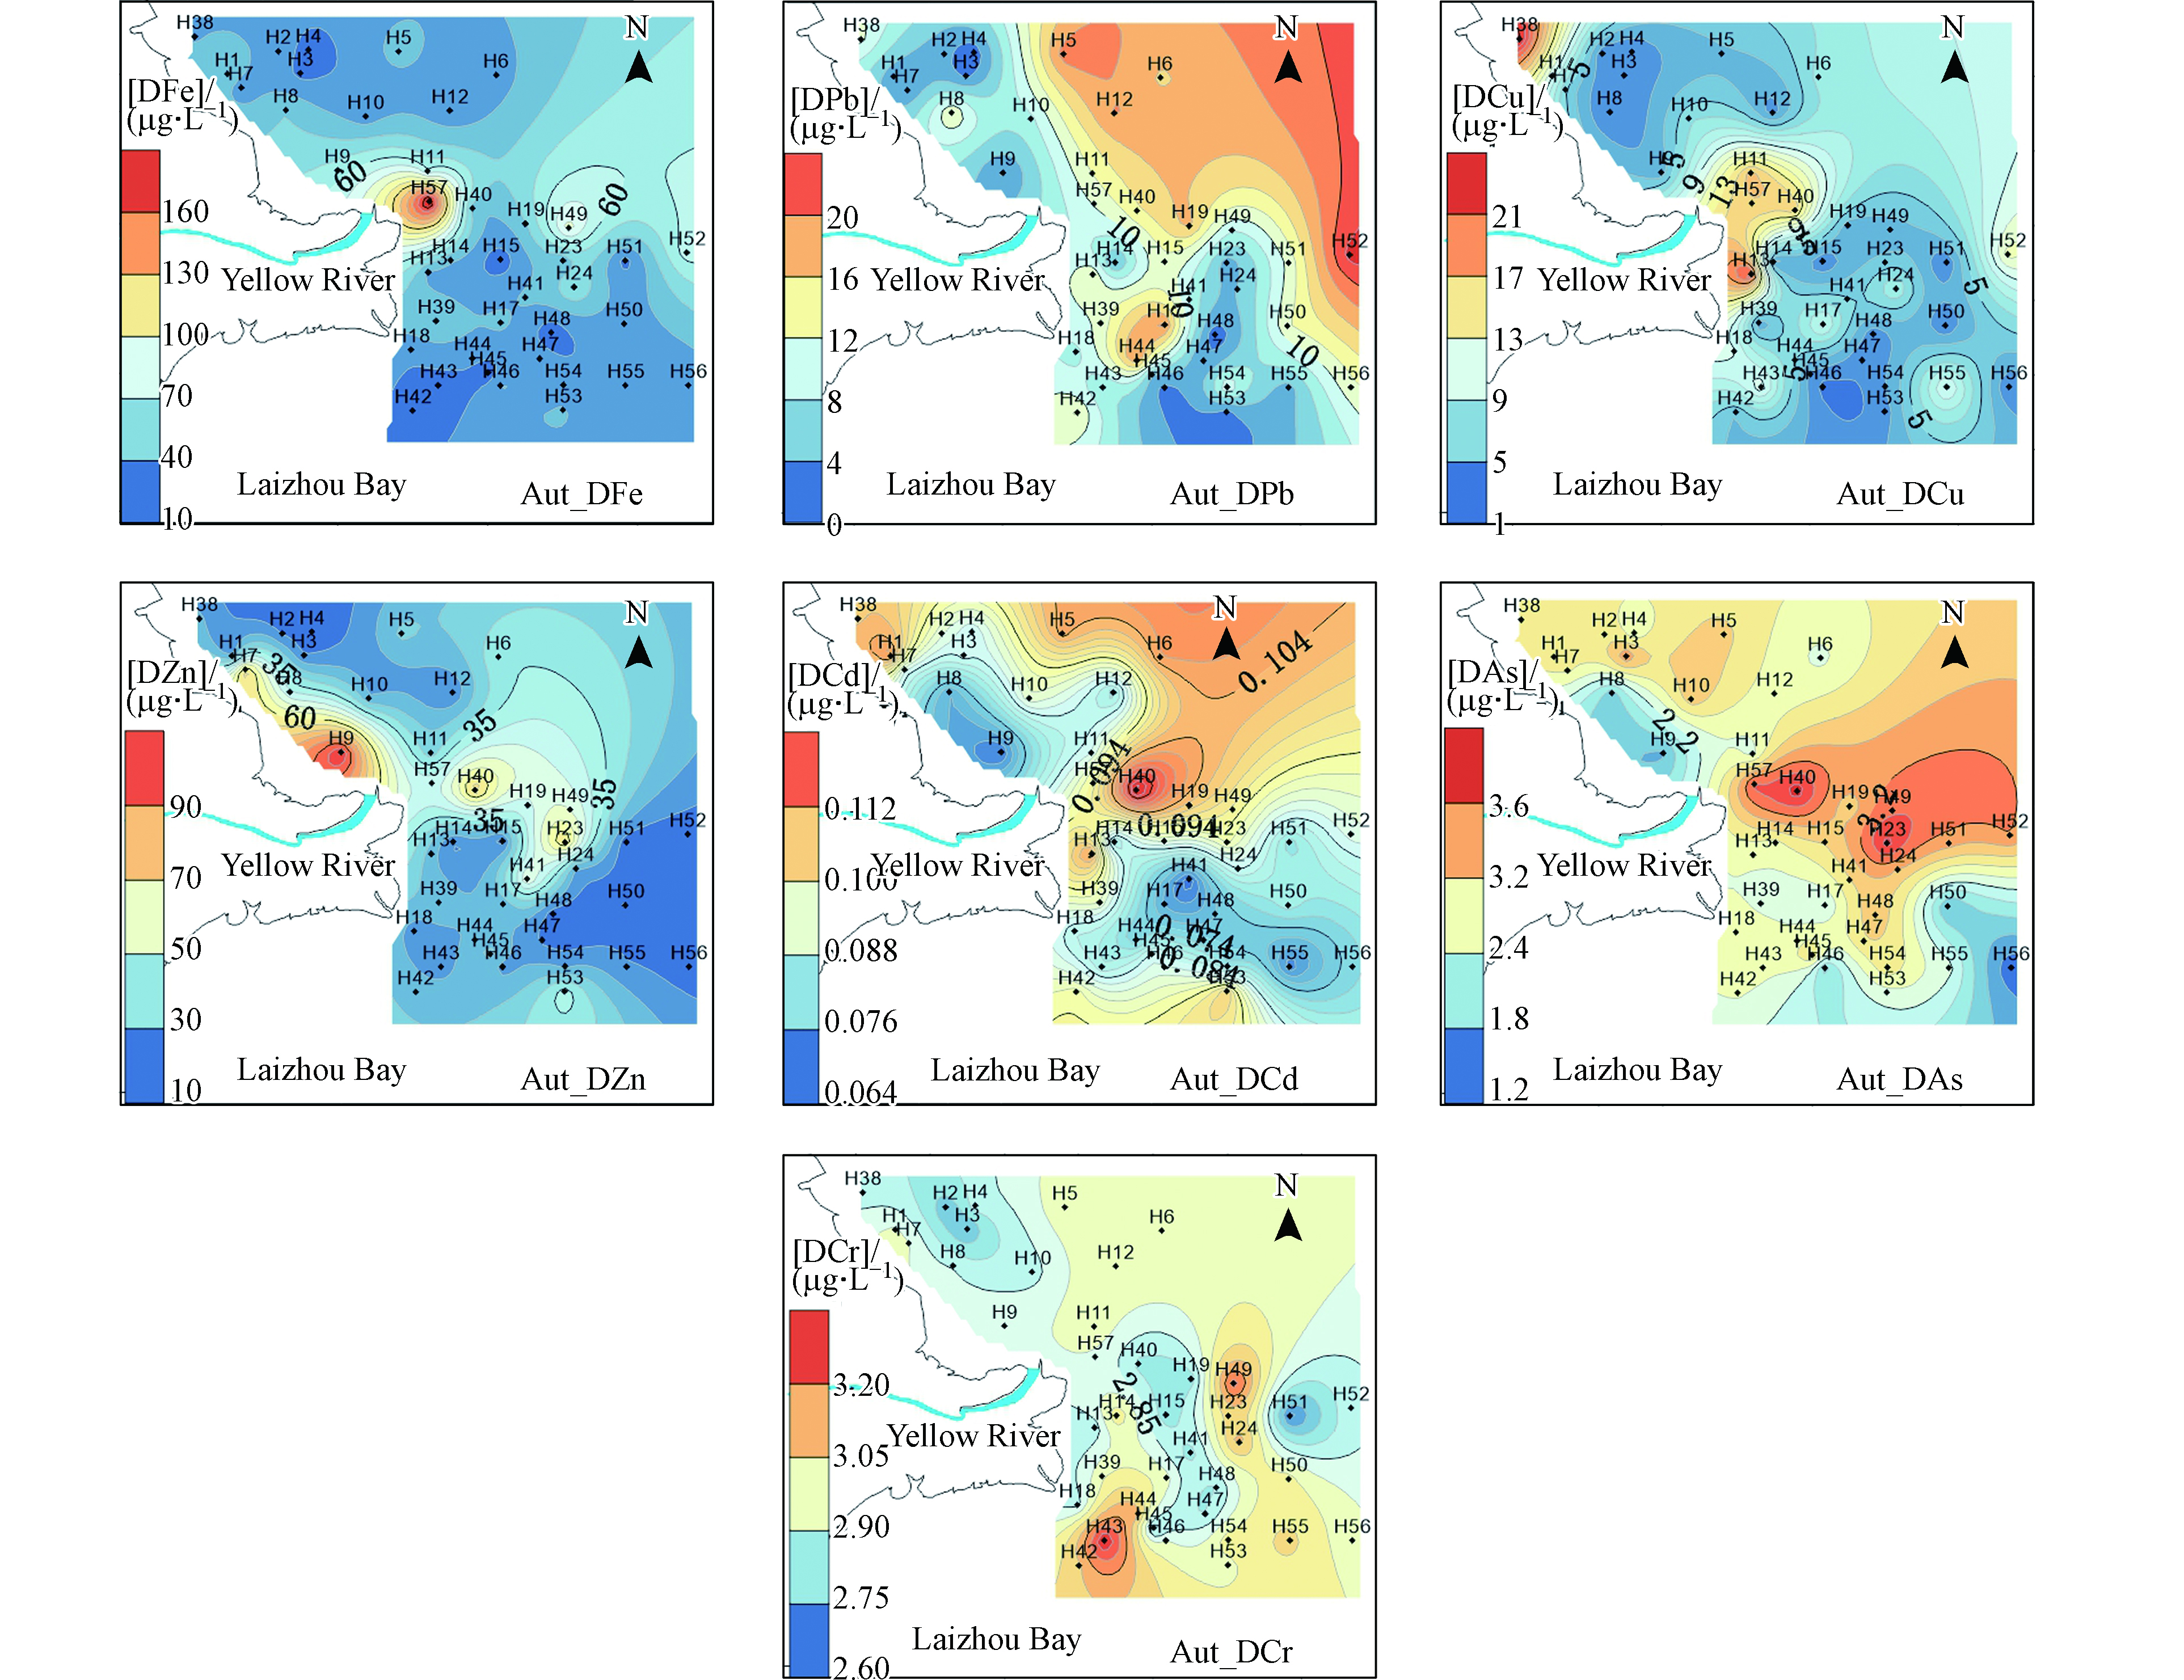
秋季DFe、DPb、DCu、DZn、DCd、DCr、DAs的浓度为12.1—178.6、0.52—22.8、1.69—50.0、10.5—96.0、0.04—0.12、2.63—3.67、1.25—3.72 µg·L−1。秋季的DFe、DCu、DZn、DCr的浓度在黄河入海口处出现高浓度但分布范围较小(图4),DPb、DCd、DAs在东部偏北的渤海海域偏高,可能由于秋季进入海洋养殖的成熟期,大量的养殖船作业以及渔船作业排污所致。
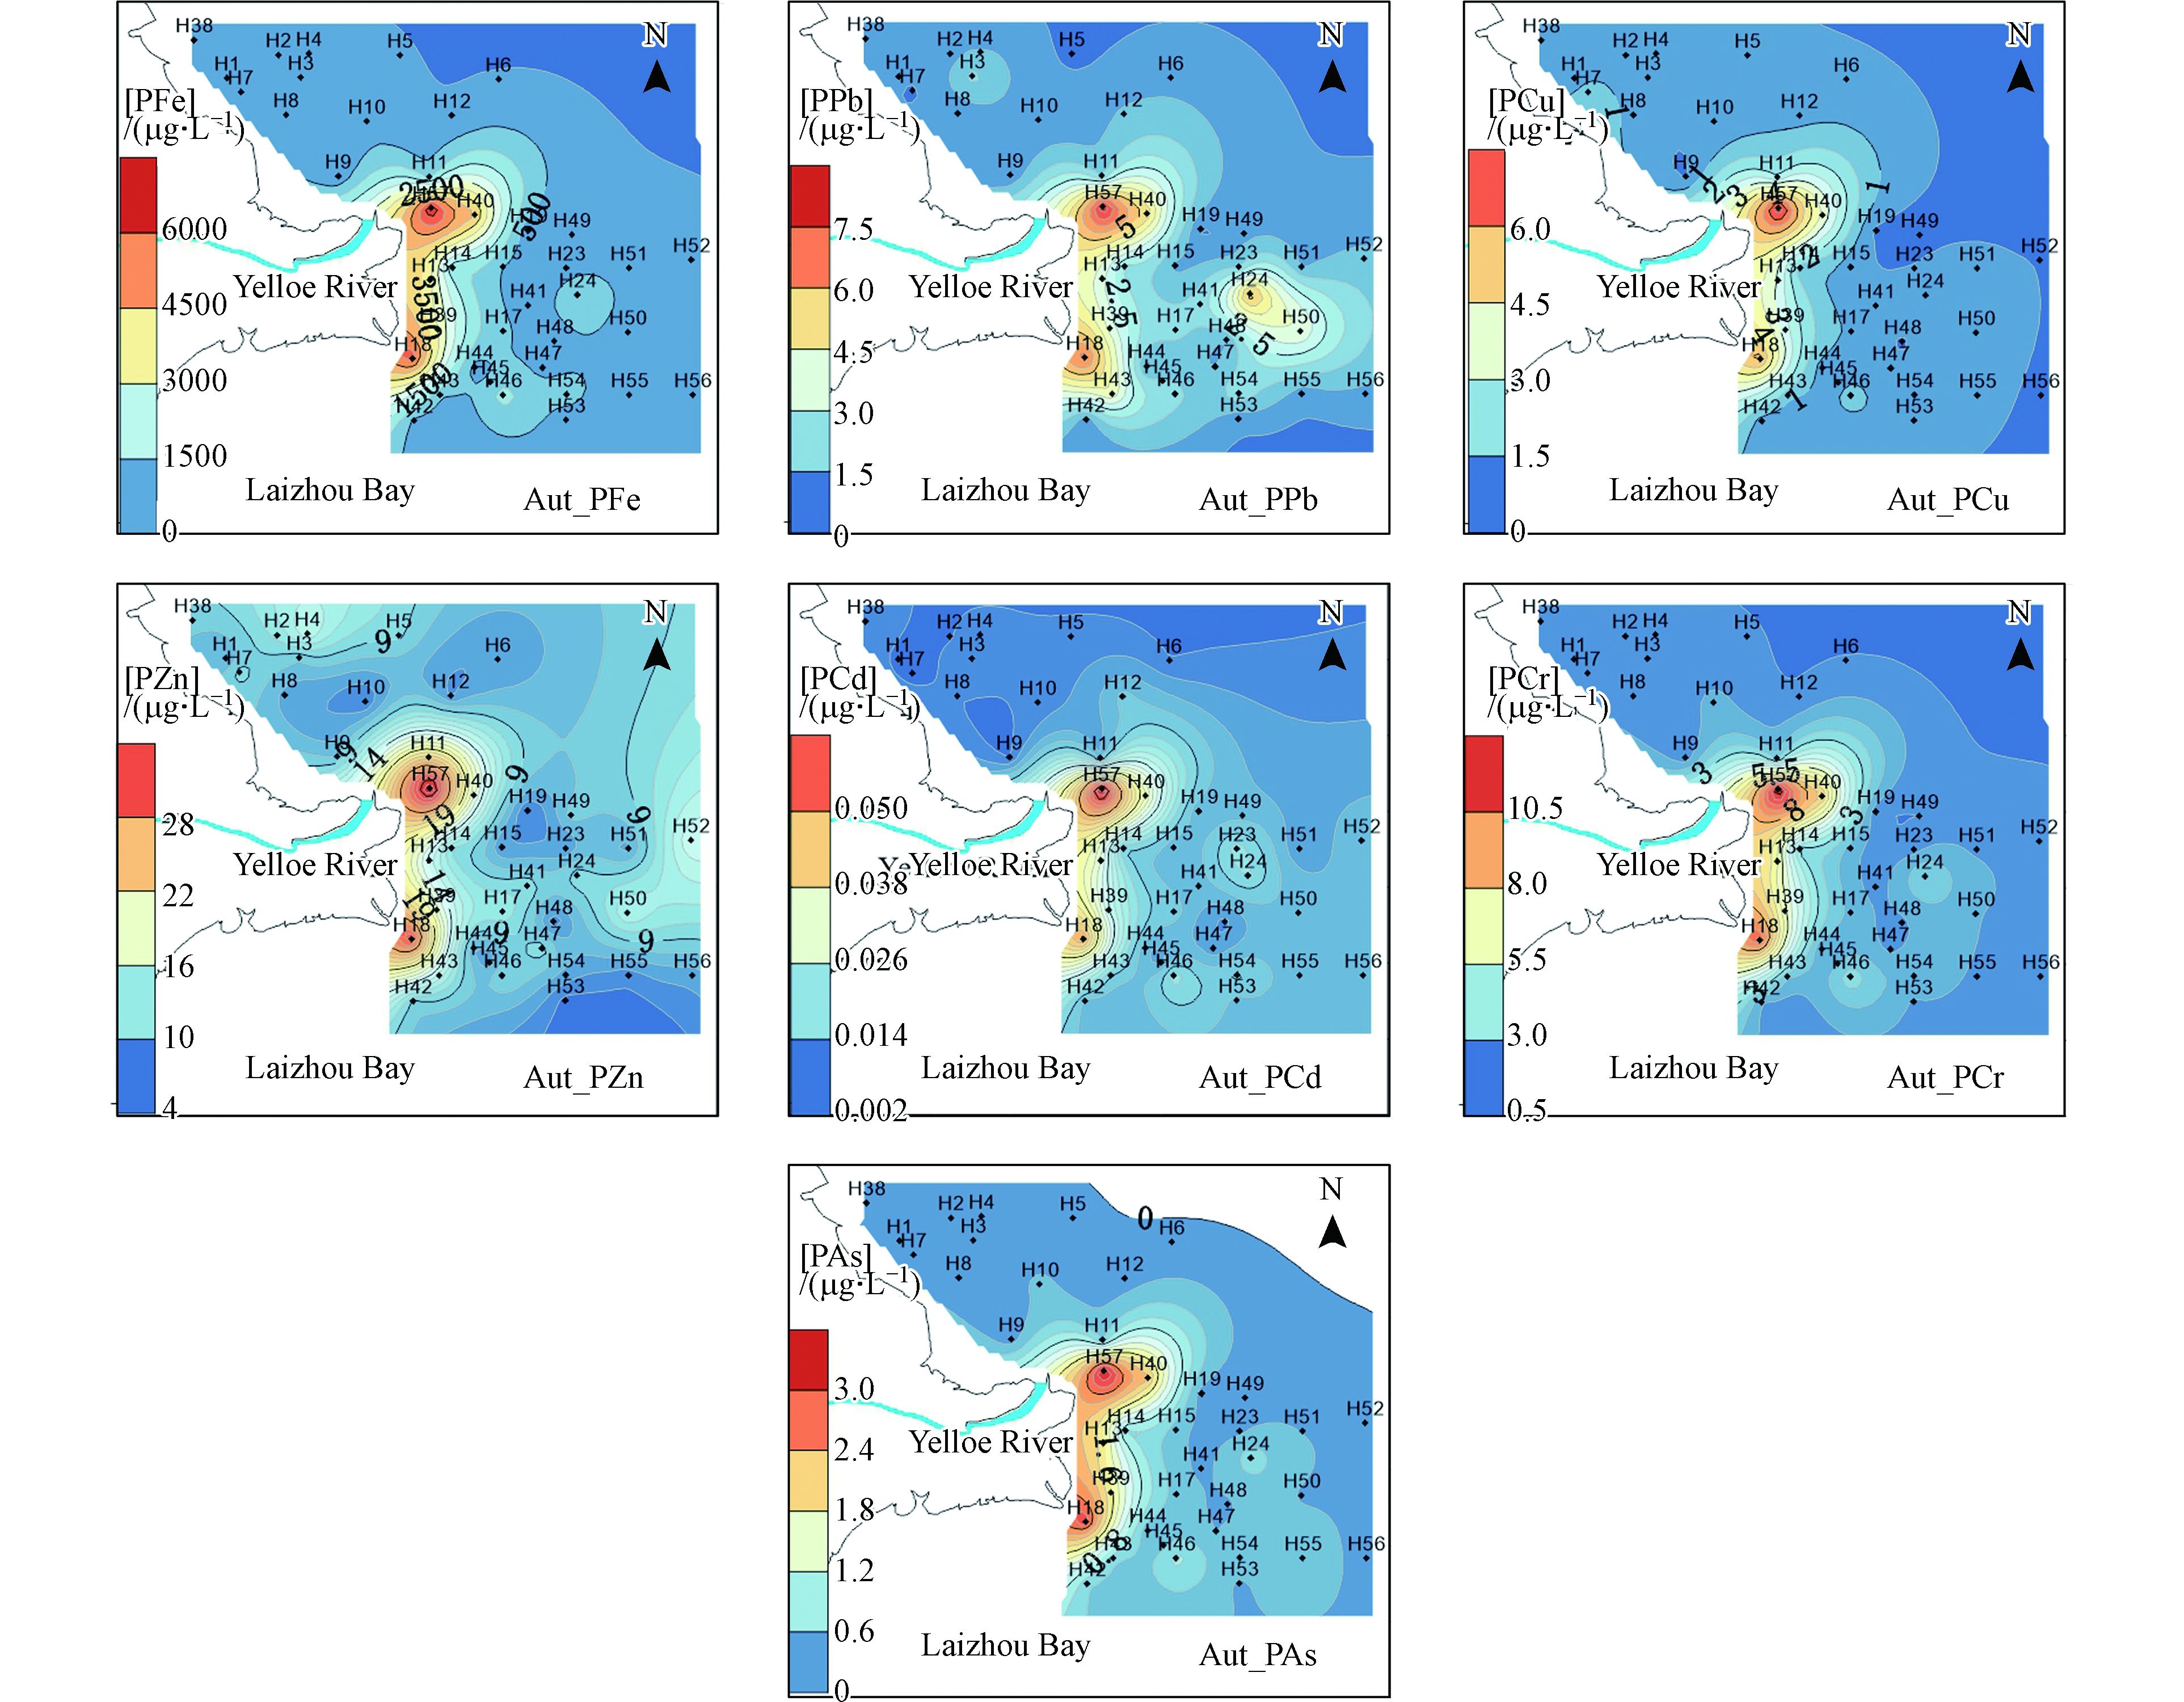
秋季PFe、PPb、PCu、PZn、PCd、PCr、PAs的浓度变化范围为47.0—5988、0.387—7.47、0.386—6.95、4.61—32.0、0.0036—0.059、1.00—11.1、0.05—3.07 µg·L−1。秋季颗粒态重金属在黄河入海口以及其南部出现高浓度,依次向周边海域递减(图5)。
-
将黄河口海域Fe、Cu、Zn、Cd、Cr、As的浓度与其它河口浓度进行比较(表2)。由于缺乏其他海域的颗粒态重金属的相关数据,本文用溶解态重金属与其他海域进行对比。黄河口邻近海域DFe的浓度低于印度东南沿海[13]。DPb、DCu和DZn的浓度高于中国其他河口。DCr的浓度略高于长江口海域[14],但低于国内的其他河口。DCd的浓度高于山东半岛的东部沿海海域[15]。DAs的浓度与之前此海域研究以及珠江口海域相当[16],但低于辽东湾北部海域[17]。
-
黄河口海域夏季表层的DFe、DPb、DCu、DZn、DCd、DCr、DAs占其总量的比例分别为8%、56%、60%、64%、86%、59%、70%,底层为7%、50%、69%、64%、86%、64%、76%;秋季表层DFe、DPb、DCu、DZn、DCd、DCr、DAs占其总量的的比例分别为12%、79%、81%、71%、90%、62%、88%。除铁外,颗粒态重金属的浓度明显低于溶解态(表3),颗粒态重金属高浓度均出现在黄河口附近,表明颗粒态重金属来自黄河的输入 [18]。高浓度颗粒态重金属出现在河口,并沿入海的方向出现由高浓度向低浓度的迅速转化。由于入海流速变缓、悬浮颗粒物的沉降以及盐度、各种离子的剧烈变化引起的水化学反应导致此现象的产生。溶解态重金属分布趋势没有颗粒态重金属明显,但高浓度主要出现在沿岸附近以及东营港附近。
夏季表层的DFe、DCd和DCr浓度高于秋季,DCu、DZn、DAs、DPb浓度秋季高于夏季。夏季溶解态重金属的高浓度主要集中在近岸、河口以及东营港口附近。秋季溶解态重金属高浓度出现在莱州湾内部,可能是由于秋季禁渔期结束以及水产养殖产品收获引起的,湾内大量的养殖船、渔船作业排污导致了高浓度溶解态重金属的出现。夏季颗粒态重金属浓度高于秋季,颗粒态高浓度点出现的位置比秋季距离黄河入海口的位置更远。秋季黄河径流量减少导致颗粒物高浓度区域相比夏季向东部海域偏移,黄河水量的大小决定了河口重金属混合区的位置和范围。秋季颗粒态重金属在东营港港口同样出现高浓度,也反映大量渔船进出东营港引起的颗粒物的再悬浮以及渔船排污的影响。
表层溶解态重金属主要出现在河口位置,高浓度DCu、DZn出现在东营港附近,与人类活动有关。DAs高浓度出现在莱州湾内部,由于铜和砷的是一些杀菌剂和藻类杀菌剂的成分[19-21],莱州湾以水产养殖为主,说明了砷主要来源为养殖业。可能受周边工业区的排放导致附近海域有较高的镉浓度。
-
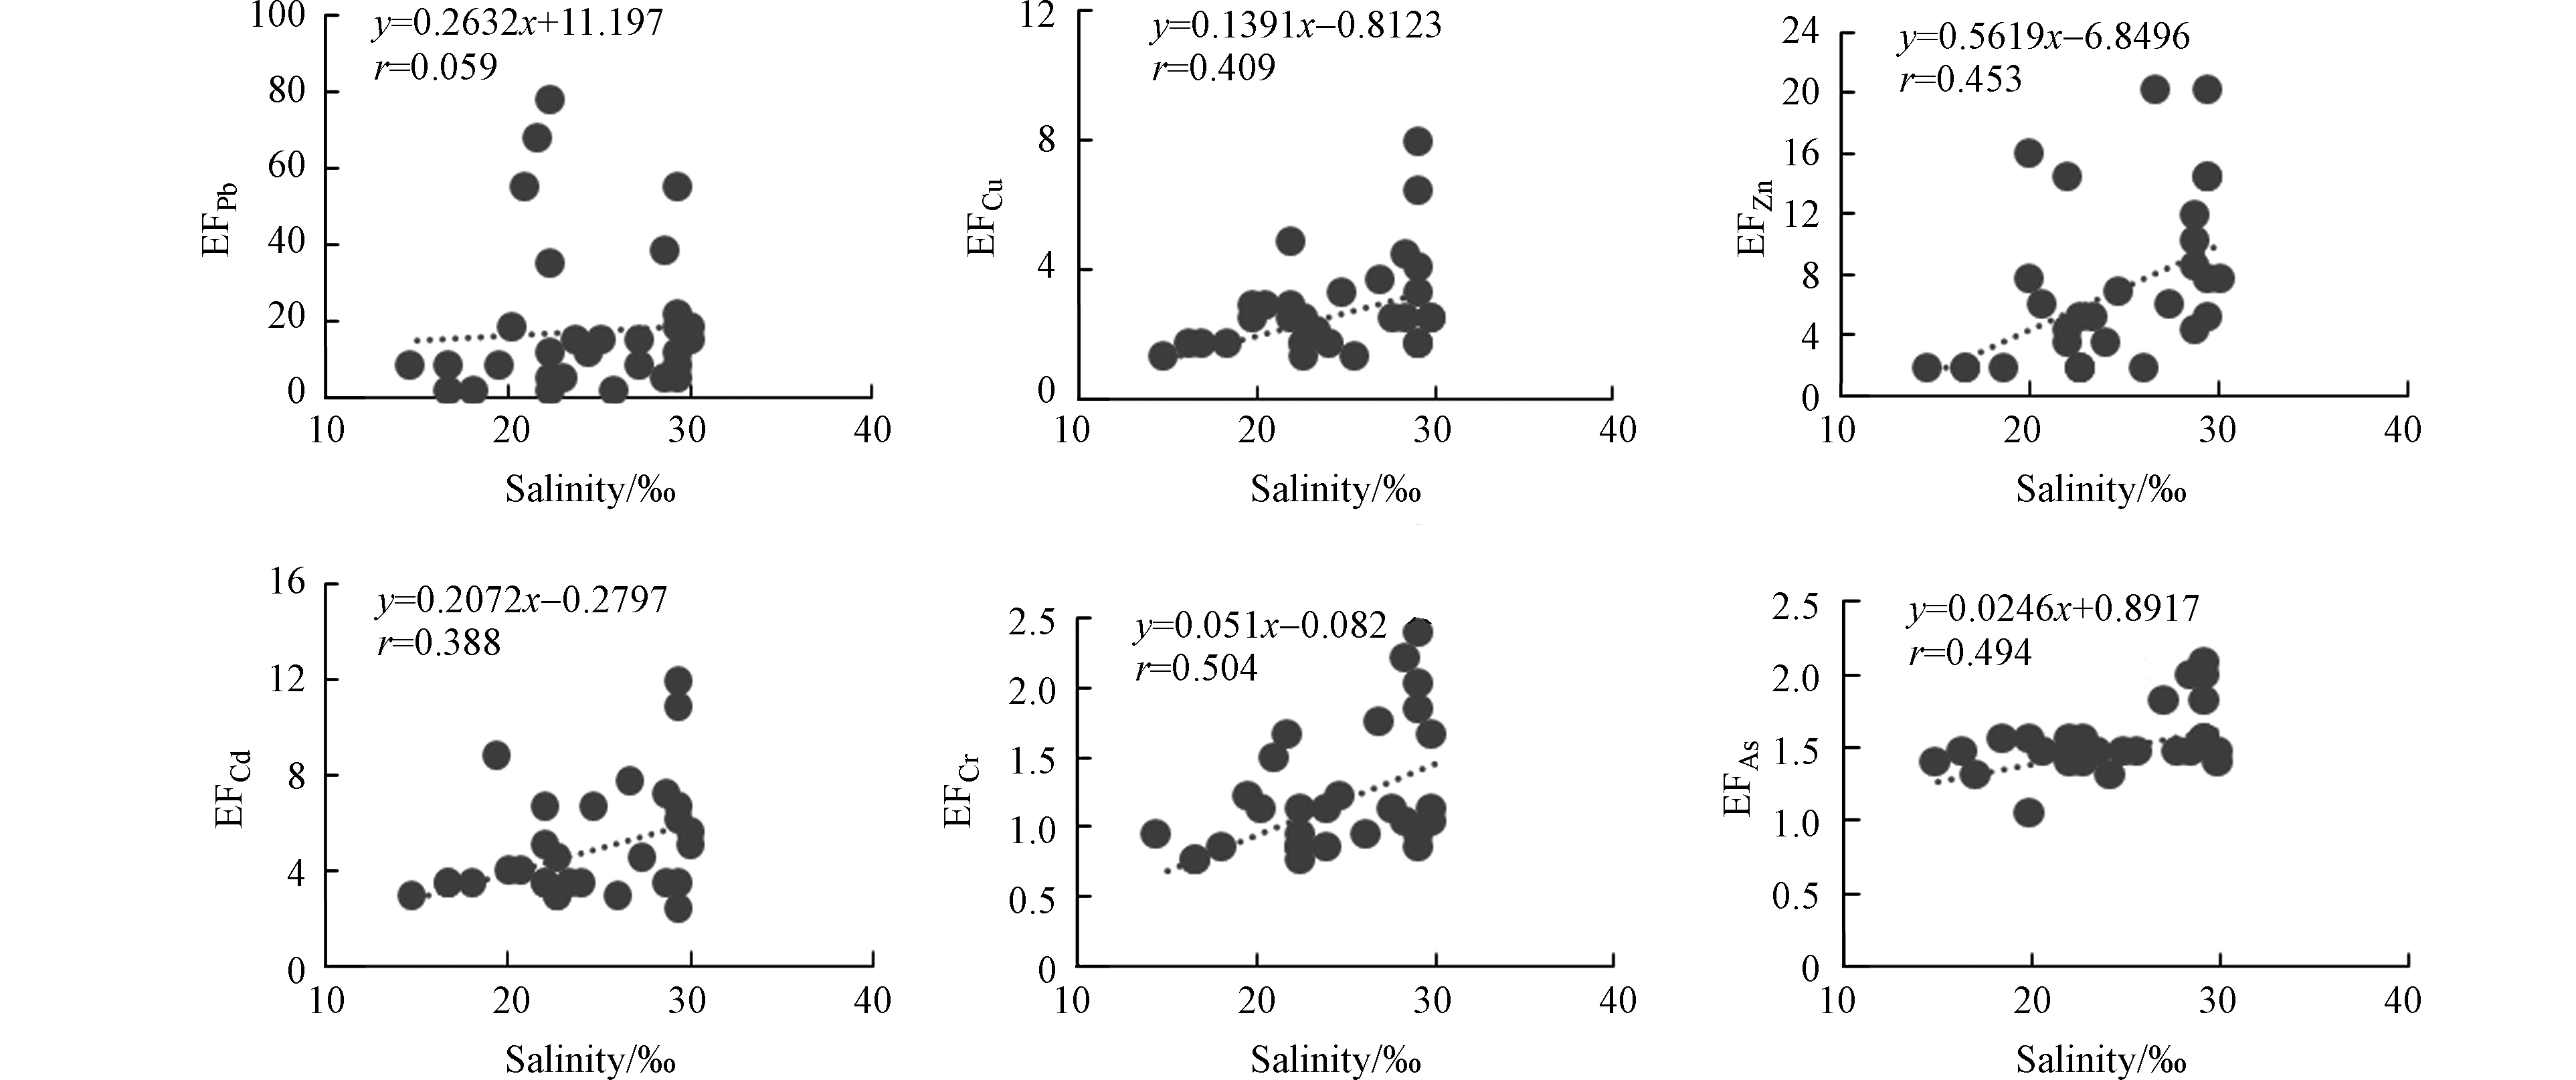
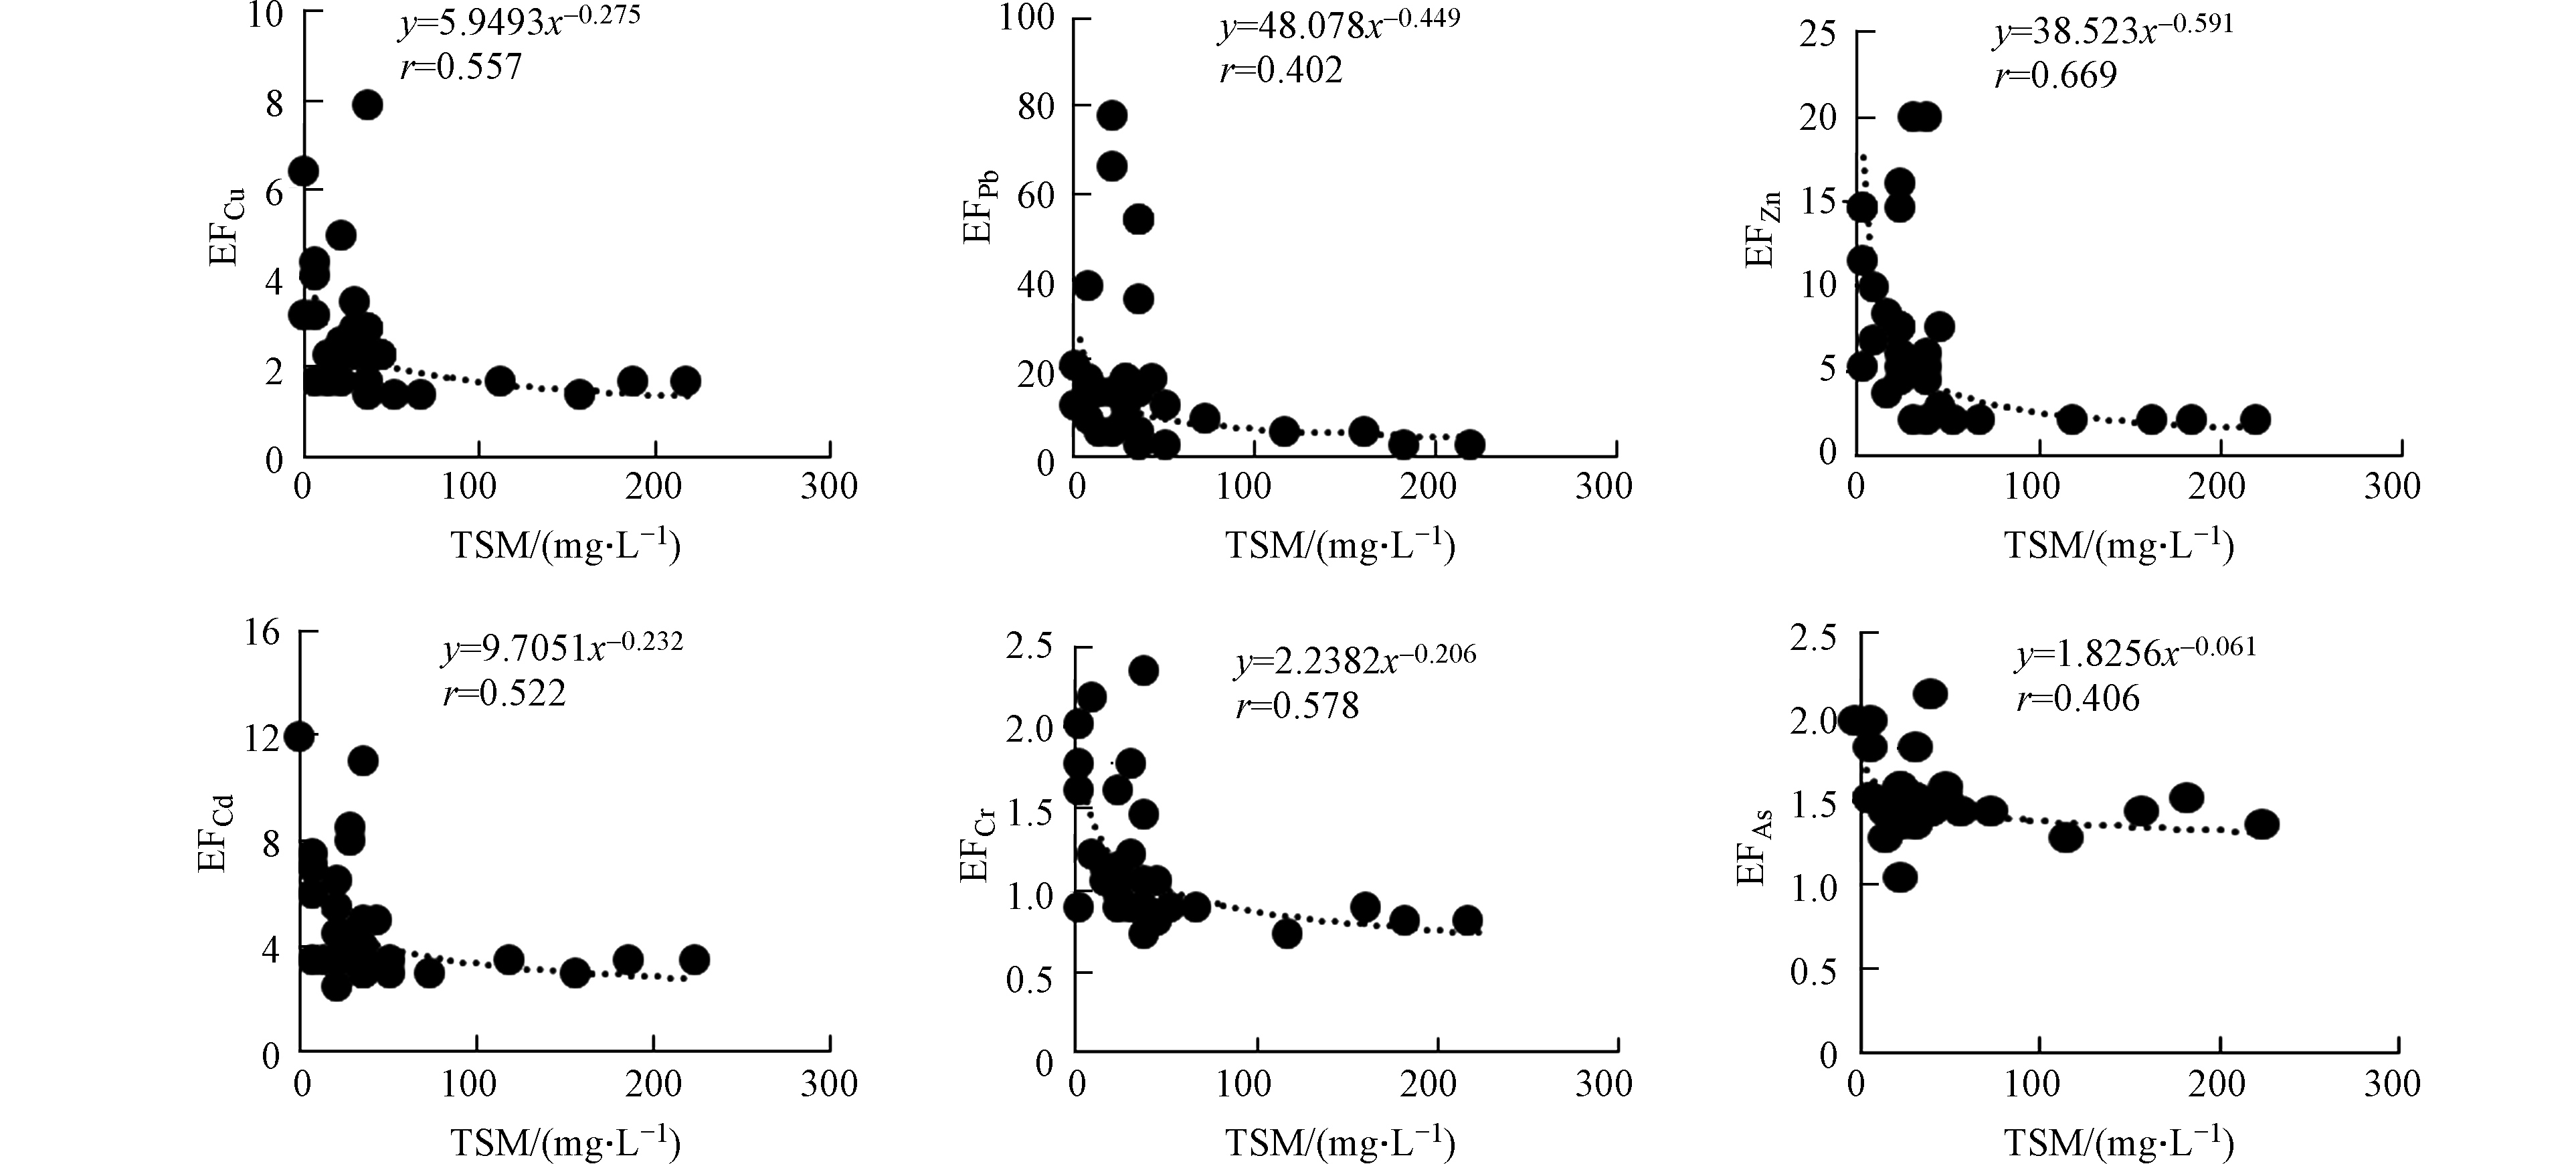
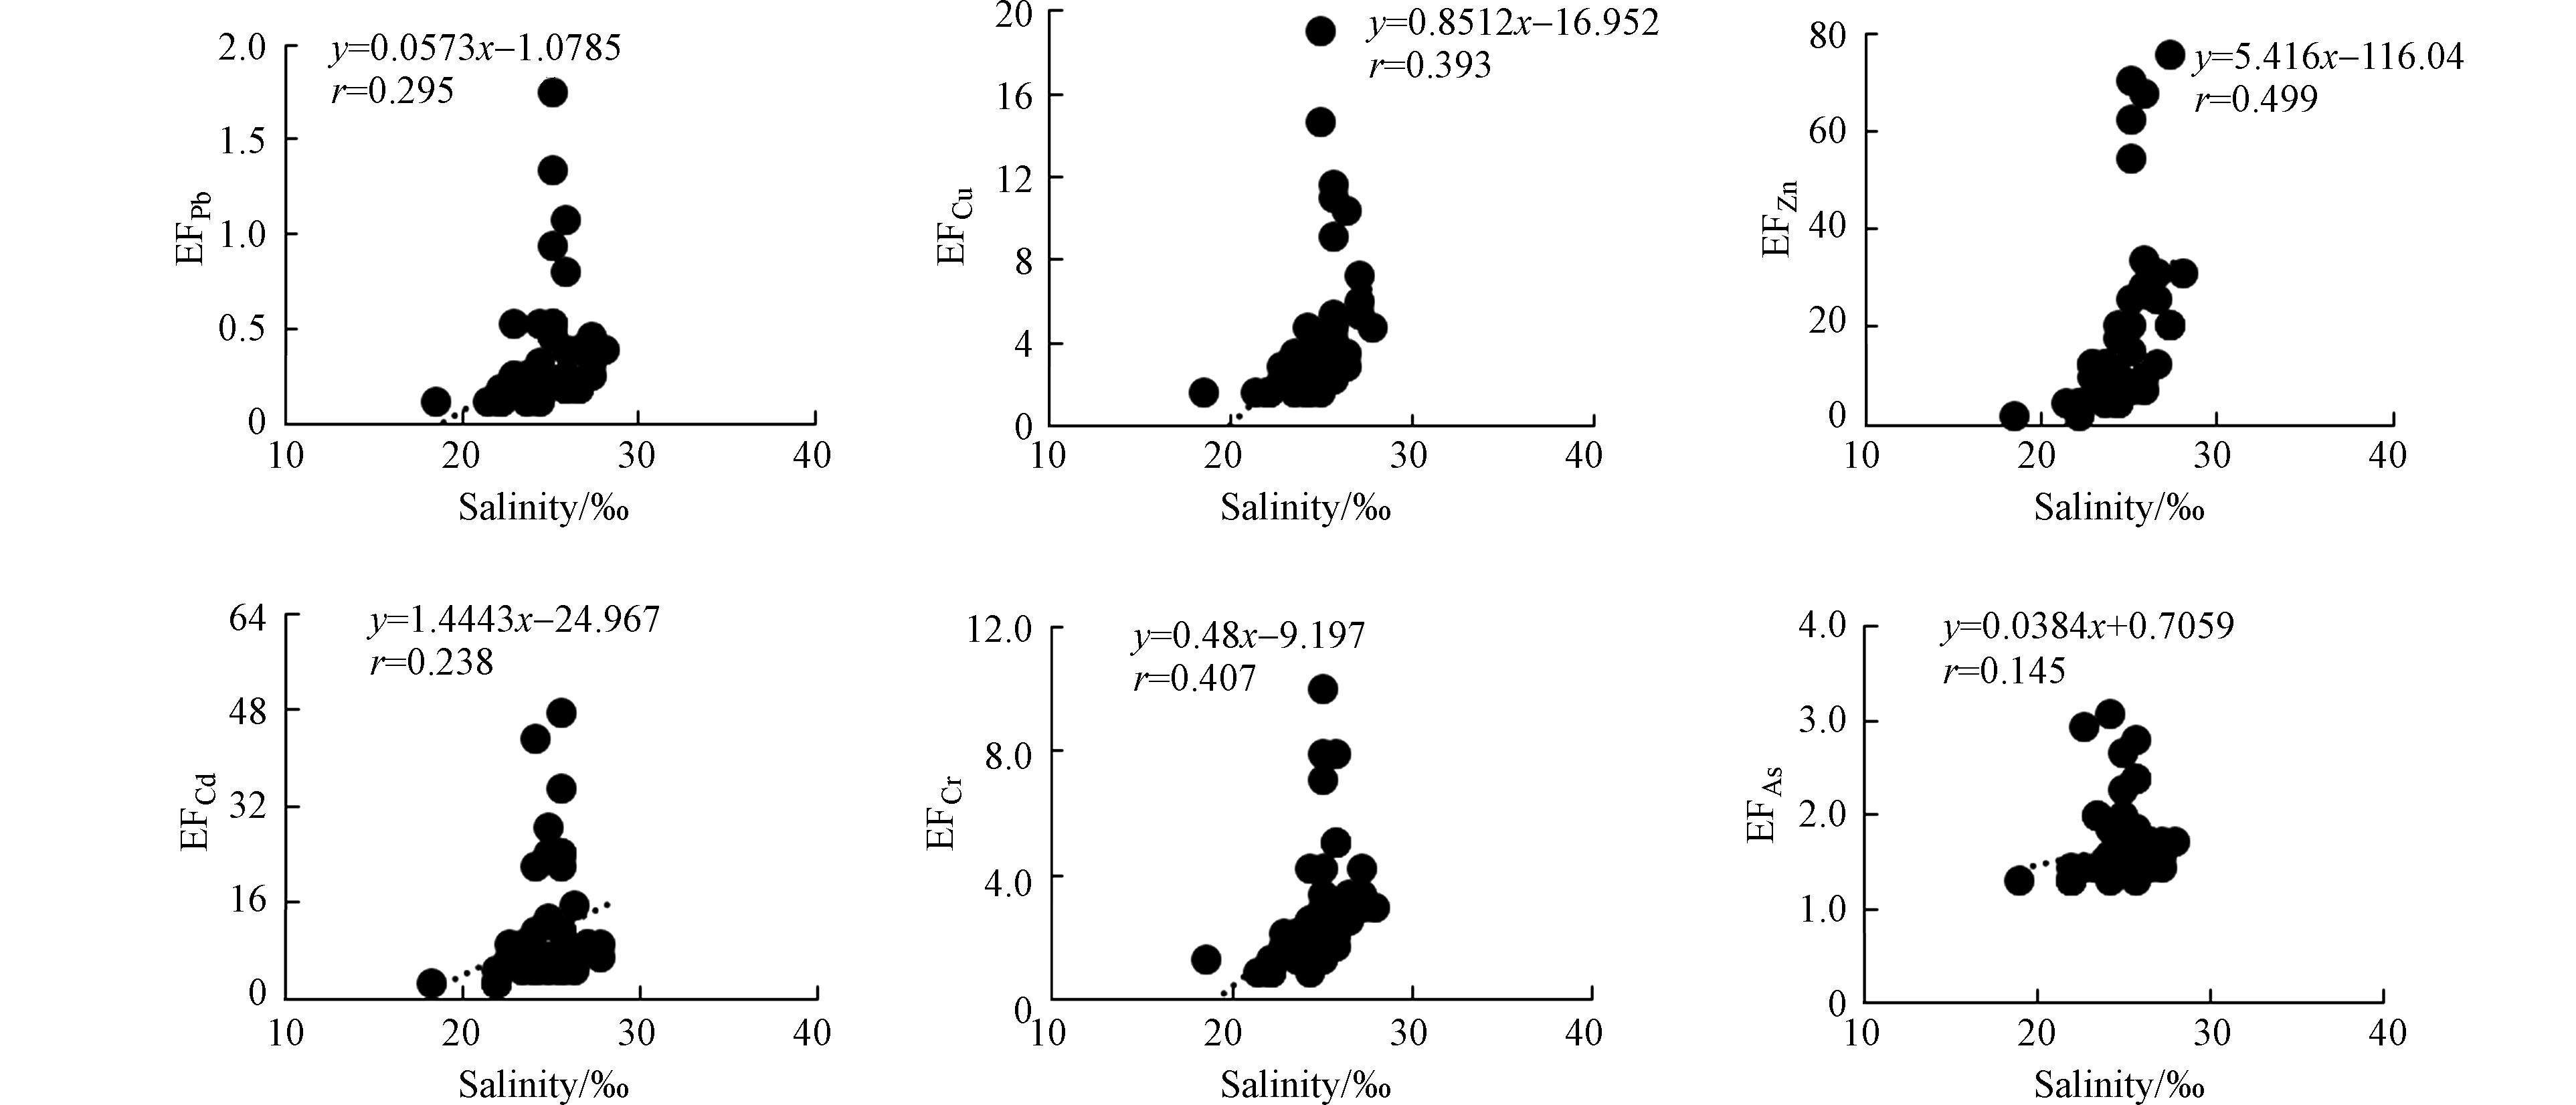
夏季黄河口邻近海域PPb、PCu、PZn、PCd、PCr、PAs的富集因子EF的平均值分别为10.4、2.88、6.21、4.42、1.13、1.49,变化范围分别为0.11—76.3、1.29—12.7、1.40—28.5、2.40—11.7、0.69—2.32、0.99—2.08。PPb、PCu、PZn、PCd污染程度为中度污染,PCr、PAs的污染程度为无污染或轻微污染。夏季PPb、PCu、PZn、PCd、PCr、PAs的富集因子EF均呈现出随TSM浓度的增大而减小、随盐度的增大而增大的趋势(图6、7)。
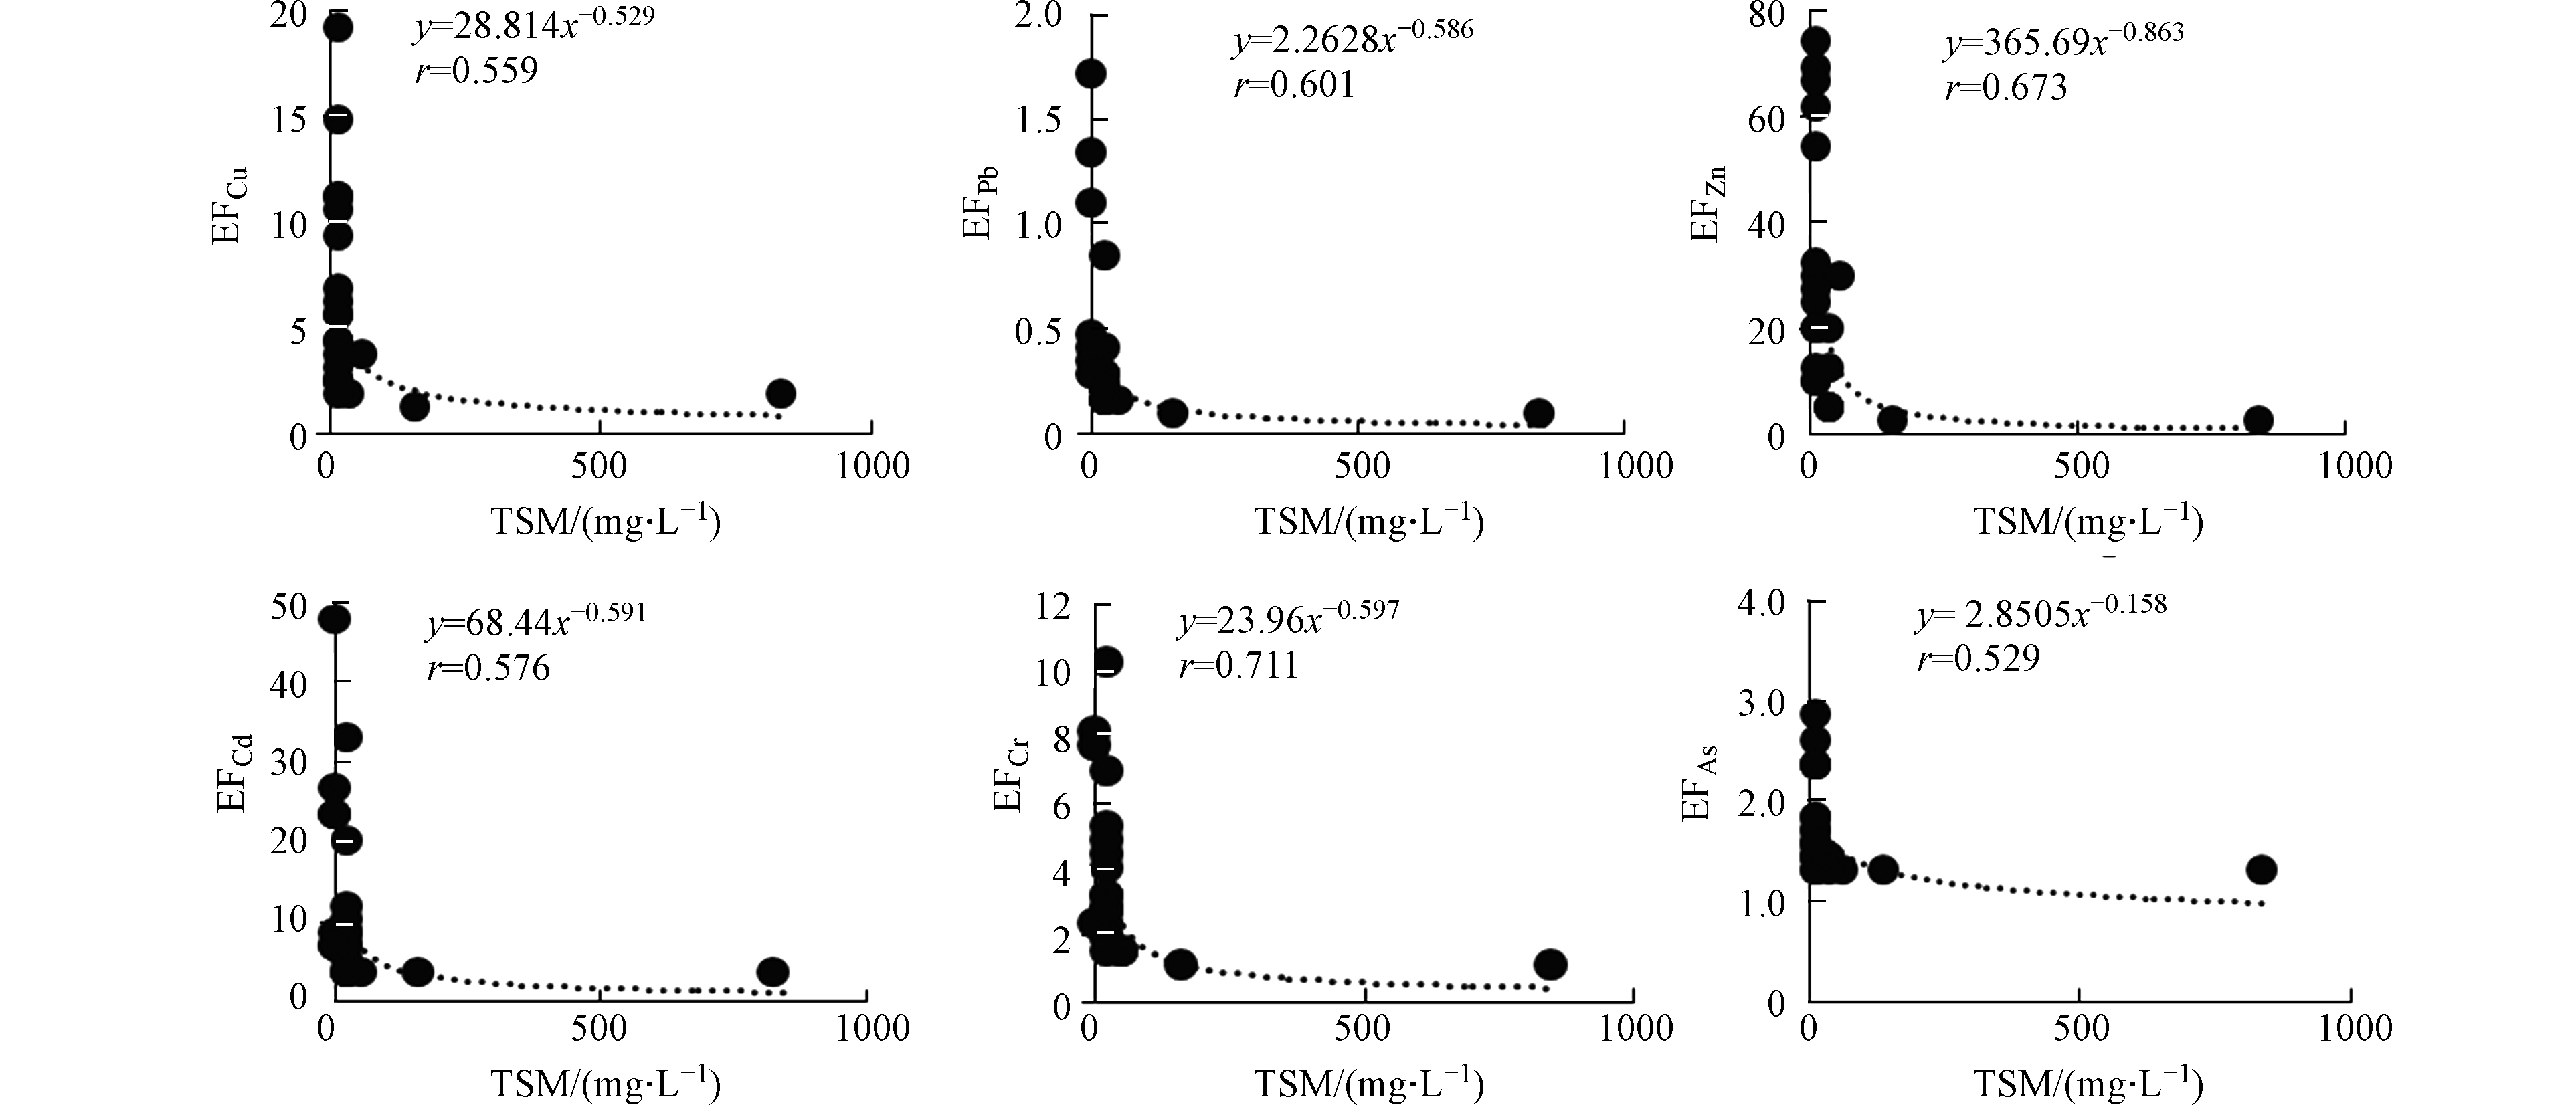
秋季黄河口邻近海域PPb、PCu、PZn、PCd、PCr、PAs的富集因子EF的平均值分别为0.35、4.28、19.5、11.1、2.78、1.66,变化范围分别为0.07—1.69、1.14—18.8、1.85—74.1、2.24—47.6、0.82—10.0、1.20—2.97。PCu、PZn、PCd、PCr污染程度为中度污染,PPb、PAs的污染程度为无污染或最小污染。夏季PPb、PCu、PZn、PCd、PCr、PAs的富集因子EF均呈现出随TSM浓度的增大而减小、随盐度的增大而增大的趋势(图8、9)。
夏秋两季海水中悬浮颗粒物的浓度在黄河入海口较高,向远海方向逐渐减少,盐度、悬浮颗粒物含量等变化较大。由表4发现颗粒态重金属与悬浮颗粒物呈显著相关性(r值均在0.6到1.0之间, P<0.01),表明颗粒态重金属的浓度受颗粒物浓度的影响明显。海水中的重金属主要赋存在悬浮颗粒物表面,并随其迁移,悬浮颗粒物的增减, 将会直接导致颗粒态重金属含量的变化。底层悬浮颗粒物的浓度受沉积物再悬浮和河流输送表层悬浮颗粒物因重力下沉的影响,导致底层悬浮颗粒物的浓度高于表层,进而使底层颗粒态重金属的浓度高于表层。夏秋两季表层海水中颗粒态重金属浓度均与盐度呈显著负相关(r值均在-0.3到-0.6之间, P<0.01),但底层海水中的颗粒态重金属以及海水中溶解态重金属浓度与盐度相关关系不显著,底层海水盐度变化较小。但以往研究表明盐度为5—20 psu时,溶解态的Fe、Cu、Ni、Pb和Mn的浓度增加[22-23]。盐度可能会影响重金属的吸附-解吸反应和海水中的离子反应, 进而影响水中重金属在溶解态与颗粒态之间的转化, 但对重金属总浓度影响不大。因而悬浮颗粒物浓度的变化是影响海水中重金属变化的主要原因。
-
秋季海水中颗粒态重金属的浓度与氨氮的呈显著正相关关系(r值范围为0.38—0.61, P<0.01)。秋季颗粒态重金属与叶绿素a也有显著的相关性(r值为0.6—0.88, P<0.01)(表4)。氨氮是藻类生长的重要营养物质,叶绿素a的浓度反映了藻类在海水中的生长情况和生物量。在入海口淡水与海水混合区域为氮盐、叶绿素a的高浓度点,大量营养物质的输入为藻类生长提供了营养物质,导致藻类生长旺盛,使颗粒态重金属浓度升高。
-
用固-液分配系数(Kd)表征海水中颗粒态重金属与溶解态重金属之间的配分关系,计算分配系数(Kd),有助于我们更好的认识重金属在海水中的迁移和转化。
式中, CP 是黄河口海域颗粒态重金属浓度(µg·L−1);CD 是黄河口海域溶解态重金属的浓度(µg·L−1);Kd是分配系数,单位是L·mg−1。
由表5发现,夏季各重金属的分配系数均高于秋季。这可能是因为夏季黄河径流量增大,并且常在此时期进行调水调沙,再加上大的径流量有利于河道淤积的泥沙输送到海洋,使河水和河口中颗粒态金属含量相对升高。而秋季径流量减少,流速下降,输沙能力下降,到达河口的颗粒物减少。
海水的悬浮颗粒物的浓度、盐度均会对金属在悬浮颗粒物上的吸附-解吸行为有重要的影响。夏季表层海水的铜、锌、铅和铬的分配系数具有显著的颗粒物浓度效应,即铜、锌、铅和铬的分配系数随着悬浮颗粒物浓度的增大而减小(图10),类似变化规律在其他河口的重金属研究中也有发现[24]。夏季表层海水铁、砷的分配系数随着盐度的增加而减小,铜、锌的分配系数随着盐度的增加而增加(图11),这种不同的变化趋势可能与不同金属的来源有关,在盐度较高的东部海域的养殖区存在铁、砷的高值区,进而影响了分配系数随盐度的变化。
-
(1) 黄河口邻近海域,DFe、DPb、DCu、DZn、DCd、DCr和DAs的浓度平均值分别为45.2、7.33、2.87、18.0、0.0979、3.24、1.65 µg·L−1,颗粒态金属PFe、PPb、PCu、PZn、PCd、PCr和PAs的浓度平均值分别为1018、6.76、2.38、10.0、0.0195、3.38、1.01 µg·L−1。夏季表底层、秋季表层各颗粒态重金属浓度变化趋势相似, 呈现出由河口高浓度向周围递减的趋势。溶解态重金属高浓度点主要出现在东营港、黄河入海口以及莱州湾内部。
(2)颗粒态重金属与悬浮颗粒物呈显著相关性(P<0.01),夏秋两季表层海水中颗粒态重金属浓度均与盐度呈显著负相关关系(r值均在-0.3到-0.6之间, P<0.01),但底层海水中的颗粒态重金属以及海水中溶解态重金属浓度与盐度相关关系较弱。说明悬浮颗粒物浓度的变化是影响海水中重金属变化的主要和重要原因,盐度、氨氮与叶绿素a的浓度也对颗粒态重金属浓度的变化起到一定的影响。
(3)溶解态重金属分布趋势没有颗粒态重金属明显,高浓度出现在河口、东营港附近以及莱州湾内部和北部,主要为人为输入,莱州湾养殖业以及拖网渔船的捕捞、排污,对重金属的输入也有一定的贡献。颗粒态重金属高浓度点出现在黄河入海口位置附近,表现为黄河输入。
(4) 各重金属的富集因子EF均呈现出随TSM浓度的增大而减小、随盐度的增大而增大的趋势,海水中PCu、PZn、PCd污染程度为中度污染。夏季分配系数均高于秋季,铜、锌、铅和铬的分配系数随着悬浮颗粒物浓度的增大而减小,铁、砷的分配系数随着盐度的增加而减小,铜、锌的分配系数随着盐度的增加而增加的趋势。这种不同的变化趋势与不同金属的来源有关,在盐度较高的东部海域的养殖区存在铁、砷的高值区,进而影响了分配系数随盐度的变化。
夏秋季黄河口邻近海域水体中重金属变化特征
Changes of heavy metals in the waters adjacent to the Yellow River estuary in summer and autumn
-
摘要: 2020年夏季和秋季观测了黄河口邻近海域海水中溶解态的重金属(DFe、DPb、DCu、DZn、DCd、DCr、DAs)和颗粒态金属(PFe、PPb、PCu、PZn、PCd、PCr和PAs),以探讨各重金属形态的空间和季节变化及其影响因素,研究重金属的分配系数及其来源差异。结果表明,黄河口邻近海域DFe、DPb、DCu、DZn、DCd、DCr和DAs的浓度平均值分别为45.2、7.33、2.87、18.0、0.0979、3.24、1.65 µg·L−1,溶解态重金属高浓度点主要出现在东营港、黄河入海口以及莱州湾内部。颗粒态金属PFe、PPb、PCu、PZn、PCd、PCr和PAs的浓度平均值分别为1018、6.76、2.38、10.0、0.0195、3.38、1.01 µg·L−1,浓度由河口附近高浓度向周围递减。颗粒态重金属与悬浮颗粒物呈显著正相关性,夏秋两季表层海水中颗粒态重金属浓度均与盐度呈负相关关系。各重金属的富集因子随悬浮颗粒物浓度的增大而减小、随盐度的增大而增大。各金属的分配系数夏季高于秋季。Cu、Zn、Pb和Cr的分配系数随着悬浮颗粒物浓度的增大而减小,Fe、As的分配系数随着盐度的增加而减小,Cu、Zn的分配系数随着盐度的增加而增加。Abstract: In summer and autumn of 2020, dissolved metals (DFe, DPb, DCu, DZn, DCd, DCr, DAs), and particulate metals (PFe, PPb, PCu, PZn, PCd, PCr, PAs) in seawater of the Yellow River estuary were determined to study the spatial and seasonal changes of heavy metals forms, and their influencing factors. The distribution coefficient and sources difference of heavy metals in two seasons were analyzed. The results showed that the average concentrations of DFe, DPb, DCu, DZn, DCd, DCr and DAs in the Yellow River estuary were 45.2, 7.33, 2.87, 18.0, 0.0979, 3.24, 1.65 µg·L−1 respectively. The high concentrations of dissolved heavy metals mainly appeared in Dongying Port, the Yellow River estuary and the interior of Laizhou Bay. The average concentrations of PFe, PPb, PCu, PZn, PCd, PCr and PAs were 018, 6.76, 2.38, 10.0, 0.0195, 3.38, 1.01 µg·L−1 respectively, and the concentration decreased from the high concentrations near the estuary to the surrounding sea areas. There was a significant positive correlation between particulate heavy metals and suspended particulate matter. The concentration of particulate heavy metals in surface seawater in summer and autumn had a significant negative correlation with salinity. The distribution coefficient (Kd) of each heavy metal in summer was higher than that in autumn. Kd of copper, zinc, lead, and chromium decreased with the increase of the concentration of suspended particulate matter. Kd of iron and arsenic decreased with the increase of salinity, and Kd of copper and zinc increased with the increase of salinity.
-

-
表 1 黄河口海水中各理化参数汇总
Table 1. Spatial variations of physicochemical parameters in the seawater of the Yellow River Estuary.
T/℃ pH 盐度/‰
SalinityTSM/(mg·L−1) COD/(mg·L−1) DO/(mg·L−1) chl a/(µg·L−1) 夏季 表层 范围 23.9—29.6 7.82—8.07 15.0—30.2 6.5—1868 0.90—2.61 4.60—7.96 0.55—5.39 平均值±标准差 26.7 ±1.4 8±0.12 25.1±4.2 93.3±306.8 1.79±0.34 5.99±0.786 2.57±1.21 底层 范围 22.7—29.1 7.80—8.29 19.0—31.9 14.8—1868 1.14—2.61 3.02—7.96 0.51—5.39 平均值±标准差 25.7±1.8 8.00±0.14 27.8±3.4 118±343 1.70±0.35 4.95±1.38 2.74±1.32 秋季 表层 范围 17.4—19.9 8.03—8.38 18.9—28.1 17.7—850 0.67—3.36 5.04—9.52 1.76—8.16 平均值±标准差 18.9±0.62 8.17±0.07 24.9±1. 8 73.8±171.8 1.68±0.61 7.54±0.805 3.88±1.45 表 2 黄河口及世界其它海域Fe、Cu、Zn、Cd、Cr、As的含量
Table 2. The concentrations of Fe、Cu、Zn、Cd、Cr、As in waters from Yellow River Estuary and various world regions
海区
RegionFe/(µg·L−1) Pb/(µg·L−1) Cu /(µg·L−1) Zn/(µg·L−1) Cd/(µg·L−1) Cr/(µg·L−1) As/(µg·L−1) 黄河口溶解态 12.1—188
(42.4)1.05—21.6
(7.29)1.41—21.6
(4.40)10.5—96.0
(21.8)0.0333—0.177
(0.0907)2.54—6.71
(3.27)0.426—3.72
(2.03)黄河口 — 0.42—13.3
(5.61)0.04—31.0
(11.6)1.97—42.2
(14.9)0.10—1.90
(0.66)— 0.16—5.89
(2.59)长江口 — 2.28—2.43
(2.36)2.89—3.66
(3.30)— 0.08—0.09
(0.08)— — 珠江口 — 0.19—4.58
(1.61)0.34—3.26
(1.64)13.54 0.0015—0.30
(0.12)— 0.16—8.18
(2.55)山东半岛
东部海域— 0.52—3.60
(1.51)0.83—5.38
(2.46)2.22—40.7
(17.20)0.08—0.73
(0.17)0.84—3.56
(2.01)ND—1.86
(0.98)辽东湾北部 — 0.60—17.20
(3.98)0.70—6.20
(2.86)1.20—82.80
(17.76)0.10—1.40
(0.66)— 1.92—10.10
(5.46)印度东南沿海 79.60±21.57 0.36±0.06 5.19±2.00 9.31±1.33 0.11±0.05 0.31±0.57 — 表 3 黄河口海水中各重金属浓度汇总
Table 3. Statistics of heavy metals concentrate in the seawater of the Yellow River Estuary.
Fe/(µg·L−1) Pb/(µg·L−1) Cu/(µg·L−1) Zn/(µg·L−1) Cd/(µg·L−1) Cr/(µg·L−1) As/(µg·L−1) 夏季 表层 溶解态 范围 12.9—154 1.05—26.5 1.41—6.83 10.5—45.9 0.03—0.18 2.54—4.71 0.43—2.65 平均值+标准差 45.2±35.0 7.33±5.33 2.87±1.23 18.0±8.37 0.10±0.04 3.24±0.35 1.65±0.54 颗粒态 范围 167—9832 0.58—21.6 0.43—10.6 4.2—29.7 0.004—0.107 0.66—17.3 0.12—6.13 平均值+标准差 1018±1781 6.76±6.15 2.38±2.49 10.0±6.38 0.020±0.025 3.38±4.30 1.01±1.48 底层 溶解态 范围 15.0—188 0.88—19.2 1.68—20.2 11.0—78.1 0.06—0.14 2.91—6.71 1.20—2.46 平均值+标准差 50.8±44.8 5.77±4.38 4.52±4.49 19.9±15.7 0.09±0.03 3.67±0.85 1.87±0.345 颗粒态 范围 129—11323 0.58—17.9 0.57—11.4 5.321—40.1 0.004—0.120 0.61—17.3 0.11—6.68 平均值+标准差 2071±3136 6.13±4.61 2.20±2.99 11.0±9.3 0.02±0.031 3.38±4.73 1.15±1.77 秋季 表层 溶解态 范围 12.1—178.6 0.52—22.8 1.69—50.0 10.5—96.0 0.04—0.12 2.63—3.67 1.25—3.72 平均值+标准差 34.7±27.4 8.85±6.25 8.28±9.52 27.4±19.0 0.08±0.02 2.91±0.18 2.59±0.53 颗粒态 范围 47.0—5988 0.39—7.47 0.39—6.95 4.6—32.0 0.004—0.06 1.00—11.1 0.05—3.07 平均值+标准差 853±1148 1.76±1.43 1.19±0.96 9.8±4.4 0.0117±0.008 2.34±1.85 0.48±0.59 表 4 夏、秋季黄河口邻近海域PFe、PPb、PCu、PZn、PCd、PCr、PAs与环境因子的相关性分析
Table 4. The correlations between PFe, PPb, PCu, PZn, PCd, PCr, PAs and environmental factors of the Yellow River Estuary in summer and autumn
PFe PPb PCu PZn PCd PCr PAs 夏季 TSM 0.64 0.66 0.67 0.63 0.68 0.65 0.68 盐度 −0.54 −0.57 −0.55 −0.60 −0.54 −0.53 −0.53 秋季 TSM 1.00 0.98 0.98 0.62 0.99 1.00 1.00 盐度 −0.55 −0.45 −0.44 −0.31 −0.48 −0.54 −0.58 氨氮 0.50 0.38 0.61 0.41 0.45 0.51 0.48 叶绿素 0.87 0.83 0.88 0.60 0.86 0.86 0.87 表 5 黄河口海水中各重金属平均分配系数
Table 5. Coefficient of average distribution of heavy metals in the seawater of the Yellow River Estuary
Fe Pb Cu Zn Cd Cr As 夏季表层 0.882 0.047 0.027 0.025 0.006 0.024 0.015 夏季底层 1.472 0.039 0.020 0.022 0.005 0.025 0.012 秋季表层 0.403 0.015 0.007 0.013 0.002 0.017 0.002 -
[1] POURABADEHEI M, MULLIGAN C N. Effect of the resuspension technique on distribution of the heavy metals in sediment and suspended particulate matter [J]. Chemosphere, 2016, 153: 58-67. [2] WANG L, LONG X X, CHONG Y X, et al. Potential risk assessment of heavy metals in sediments during the denitrification process enhanced by calcium nitrate addition: Effect of AVS residual [J]. Ecological Engineering, 2016, 87: 333-339. [3] KIM J J, KIM Y S, KUMAR V. Heavy metal toxicity: An update of chelating therapeutic strategies [J]. Journal of Trace Elements in Medicine and Biology, 2019, 54: 226-231. [4] LAO Q B, SU Q Z, LIU G Q, et al. Spatial distribution of and historical changes in heavy metals in the surface seawater and sediments of the Beibu Gulf, China [J]. Marine Pollution Bulletin, 2019, 146: 427-434. [5] VARDHAN K H, KUMAR P S, PANDA R C. A review on heavy metal pollution, toxicity and remedial measures: Current trends and future perspectives [J]. Journal of Molecular Liquids, 2019, 290: 111197. [6] State Oceanic Administration of China. China Marine Environment Quality Bulletin [R]. 2011. [7] State Oceanic Administration of China. China Marine Environment Quality Bulletin [R]. 2013. [8] YU L S. The Huanghe (Yellow) River: A review of its development, characteristics, and future management issues [J]. Continental Shelf Research, 2002, 22(3): 389-403. [9] NIE M, XIAN N X, FU X H, et al. The interactive effects of petroleum-hydrocarbon spillage and plant rhizosphere on concentrations and distribution of heavy metals in sediments in the Yellow River Delta, China [J]. Journal of Hazardous Materials, 2010, 174(1/2/3): 156-161. [10] LIU C, et al. All around the Bohai Gulf Estuary potential ecological risk assessment [J]. Environ Sci Res, 2002, 121: 33-37. [11] WANG X Y, ZHAO L L, XU H Z, et al. Spatial and seasonal characteristics of dissolved heavy metals in the surface seawater of the Yellow River Estuary, China [J]. Marine Pollution Bulletin, 2018, 137: 465-473. [12] WANG Y, LING M, LIU R, et al. Distribution and source identification of trace metals in the sediment of Yellow River Estuary and the adjacent Laizhou Bay [J]. Physics and Chemistry of the Earth, 2017, 97: 62-70. [13] KUMAR S B, PADHI R K, MOHANTY A K, et al. Distribution and ecological- and health-risk assessment of heavy metals in the seawater of the southeast coast of India [J]. Marine Pollution Bulletin, 2020, 161: 111712. [14] AN Q, WU Y Q, WANG J H, et al. Assessment of dissolved heavy metal in the Yangtze River Estuary and its adjacent sea, China [J]. Environmental Monitoring and Assessment, 2010, 164(1/2/3/4): 173-187. [15] LIU R, JIANG W W, LI F J, et al. Occurrence, partition, and risk of seven heavy metals in sediments, seawater, and organisms from the eastern sea area of Shandong Peninsula, Yellow Sea, China [J]. Journal of Environmental Management, 2021, 279: 111771. [16] ZHANG D W, ZHANG X, TIAN L, et al. Seasonal and spatial dynamics of trace elements in water and sediment from Pearl River Estuary, South China [J]. Environmental Earth Sciences, 2013, 68(4): 1053-1063. [17] ZHANG A G, WANG L L, ZHAO S L, et al. Heavy metals in seawater and sediments from the northern Liaodong Bay of China: Levels, distribution and potential risks [J]. Regional Studies in Marine Science, 2017, 11: 32-42. [18] 刘汝海, 吴晓燕, 秦洁, 等. 黄河口河海混合过程水中重金属的变化特征 [J]. 中国海洋大学学报(自然科学版), 2008, 38(1): 157-162. doi: 10.16441/j.cnki.hdxb.2008.01.028 LIU R H, WU X Y, QIN J, et al. The variation characters of heavy metal content in Huanghe Estuary water [J]. Periodical of Ocean University of China, 2008, 38(1): 157-162(in Chinese). doi: 10.16441/j.cnki.hdxb.2008.01.028
[19] BURGOS-NÚÑEZ S, NAVARRO-FRÓMETA A, MARRUGO-NEGRETE J, et al. Polycyclic aromatic hydrocarbons and heavy metals in the Cispata Bay, Colombia: A marine tropical ecosystem [J]. Marine Pollution Bulletin, 2017, 120(1/2): 379-386. [20] HAYNES D, JOHNSON J E. Organochlorine, heavy metal and polyaromatic hydrocarbon pollutant concentrations in the great barrier reef (Australia) environment: A review [J]. Marine Pollution Bulletin, 2000, 41(7/8/9/10/11/12): 267-278. [21] NACKE H, GONÇALVES A C Jr, SCHWANTES D, et al. Availability of heavy metals (Cd, Pb, And Cr) in agriculture from commercial fertilizers [J]. Archives of Environmental Contamination and Toxicology, 2013, 64(4): 537-544. [22] WANG Z L, LIU C Q. Distribution and partition behavior of heavy metals between dissolved and acid-soluble fractions along a salinity gradient in the Changjiang Estuary, Eastern China [J]. Chemical Geology, 2003, 202(3/4): 383-396. [23] KOSHIKAWA M K, TAKAMATSU T, TAKADA J, et al. Distributions of dissolved and particulate elements in the Yangtze Estuary in 1997-2002: Background data before the closure of the Three Gorges Dam [J]. Estuarine, Coastal and Shelf Science, 2007, 71(1/2): 26-36. [24] BENOIT G, OKTAY-MARSHALL S D, CANTU A II, et al. Partitioning of Cu, Pb, Ag, Zn, Fe, Al, and Mn between filter-retained particles, colloids, and solution in six Texas estuaries [J]. Marine Chemistry, 1994, 45(4): 307-336. -


 下载:
下载:
