-
乌昌石都市圈是国家规划的19个重要城市群之一,亦为天山北坡经济带的重要组成部分[1]。《自治区新型工业化“十三五”发展规划》[2]提出,新疆将重点打造天山北坡、天山南麓、北疆沿边产业带,以推动天山北坡经济带率先发展,从而带动天山南麓产业带、北疆沿边产业带协同发展。天山南北的绿洲城市为人口集聚地区,亦为大气环境污染最敏感区域[3]。在绿洲城市经济快速发展的同时,NO2污染日益严重。在“十三五”期间,全区14个城市仅4个城市环境空气质量达到国家二级标准。天山北坡经济带的乌鲁木齐市 (米东区、新市区、头屯河区) 、昌吉州 (昌吉市、阜康市) 、石河子市,以及天山南麓绿洲城市和田市、阿克苏市、库尔勒市的环境空气质量始终排名靠后,且NO2年均污染都超过国家二级标准[4]。天山南北坡绿洲型城市间存在经济发展差别,从而造成了NO2污染的区域差异。我国绿洲型城市与平原型、沿海型城市的本地排放强度较大,而导致NO2浓度过高。由河流灌溉形成的新疆河谷绿洲型城市,其冬季寒冷漫长,供暖期长达半年,在天山山脉阻挡冷空气南下,形成较厚逆温层,NO2污染物极不易扩散。为减少新疆NO2排放量,需全面透彻研究NO2排放时空变化规律。
在2006—2010年,美国国家航空航天局、欧洲空间局等发射的GOME (GlobalOzone MonitoringExperiment,即全球臭氧监测仪) [5]、SCIAMACHY (即扫描成像大气吸收光谱仪) [6]、OMI (Ozone Monitoring Instrument,即臭氧监测仪) [7]等卫星遥感器返回的监测数据以其时序长、大范围和高分辨率等优势,成为NO2污染研究的重要条件。TROPOMI[8]能提供更高分辨率的信息,但目前受限于观测时长,无法进行长时序的监测。而由于新疆地区相关数据存在缺失,故基于OMI高光谱遥感技术仍是研究长时间序列NO2时空变化特征的主要手段。而在2016—2020年,聚类与潜在源贡献因子分析法 (potential source contribution function,PSCF) 逐渐被利用来识别污染物输送特征与潜在源区[9]。BELLA等[10]利用后向轨迹模型发现美国东南部等地区均对德克萨斯州污染产生影响。赵权威等[11]结合聚类、PSCF和浓度权重轨迹分析法 (concentration-weighted trajectory,CWT) 进行分析,发现阿克达拉NO2受本地源和外源输送的影响,本地污染源主要由自然源[12]与人为源[13]组成。尽管学者们对长时间序列NO2时空分布特征进行了大量研究,但利用遥感技术对新疆天山南北绿洲型城市NO2排放时空变化及差异性的研究尚不多见。
本研究以2006—2020年的NO2垂直柱浓度OMI高光谱遥感资料为基础,将输送条件和减排政策相关联,重点利用后向轨迹模型对气流季节输送条件进行分析,并采用重心轨迹模型对NO2污染重心变化进行分阶段追踪,通过PSCF计算方法来识别城市NO2潜在源贡献,再对比地面监测数据及地基监测数据,以期在分析不同类型城市污染特征,并对比3类监测方法的优劣势,以期为新疆维吾尔自治区的大气污染治理提供参考。
-
北疆的分析区域为工业园区集中的乌鲁木齐-昌吉州-石河子地区 (以下简称乌昌石地区) ,南疆则选择了经济要塞的库尔勒、塞外江南的阿克苏、玉石之乡和田市。2019年,乌鲁木齐城区人口为226.82万人,大于100万人,按国际城市人口规模标准划分为大城市;而中型城市人口为20~50万人,如石河子31.65万人、昌吉25.99万人、库尔勒39.3万人、阿克苏28.73万人;人口小于20万人为小型城市,如和田19.88万人。天山北坡气候湿润,孕育了大量森林、草原等绿洲自然景观。乌昌石地区工业最为集中,经济生产总值之和已占新疆总产值33%以上。南疆地区则气候干燥,自然景观以高原、沙漠为主,地广人稀。南疆地区工业园较少,且较分散。该地区工业园多分布在库尔勒市、阿克苏市和田地区。
-
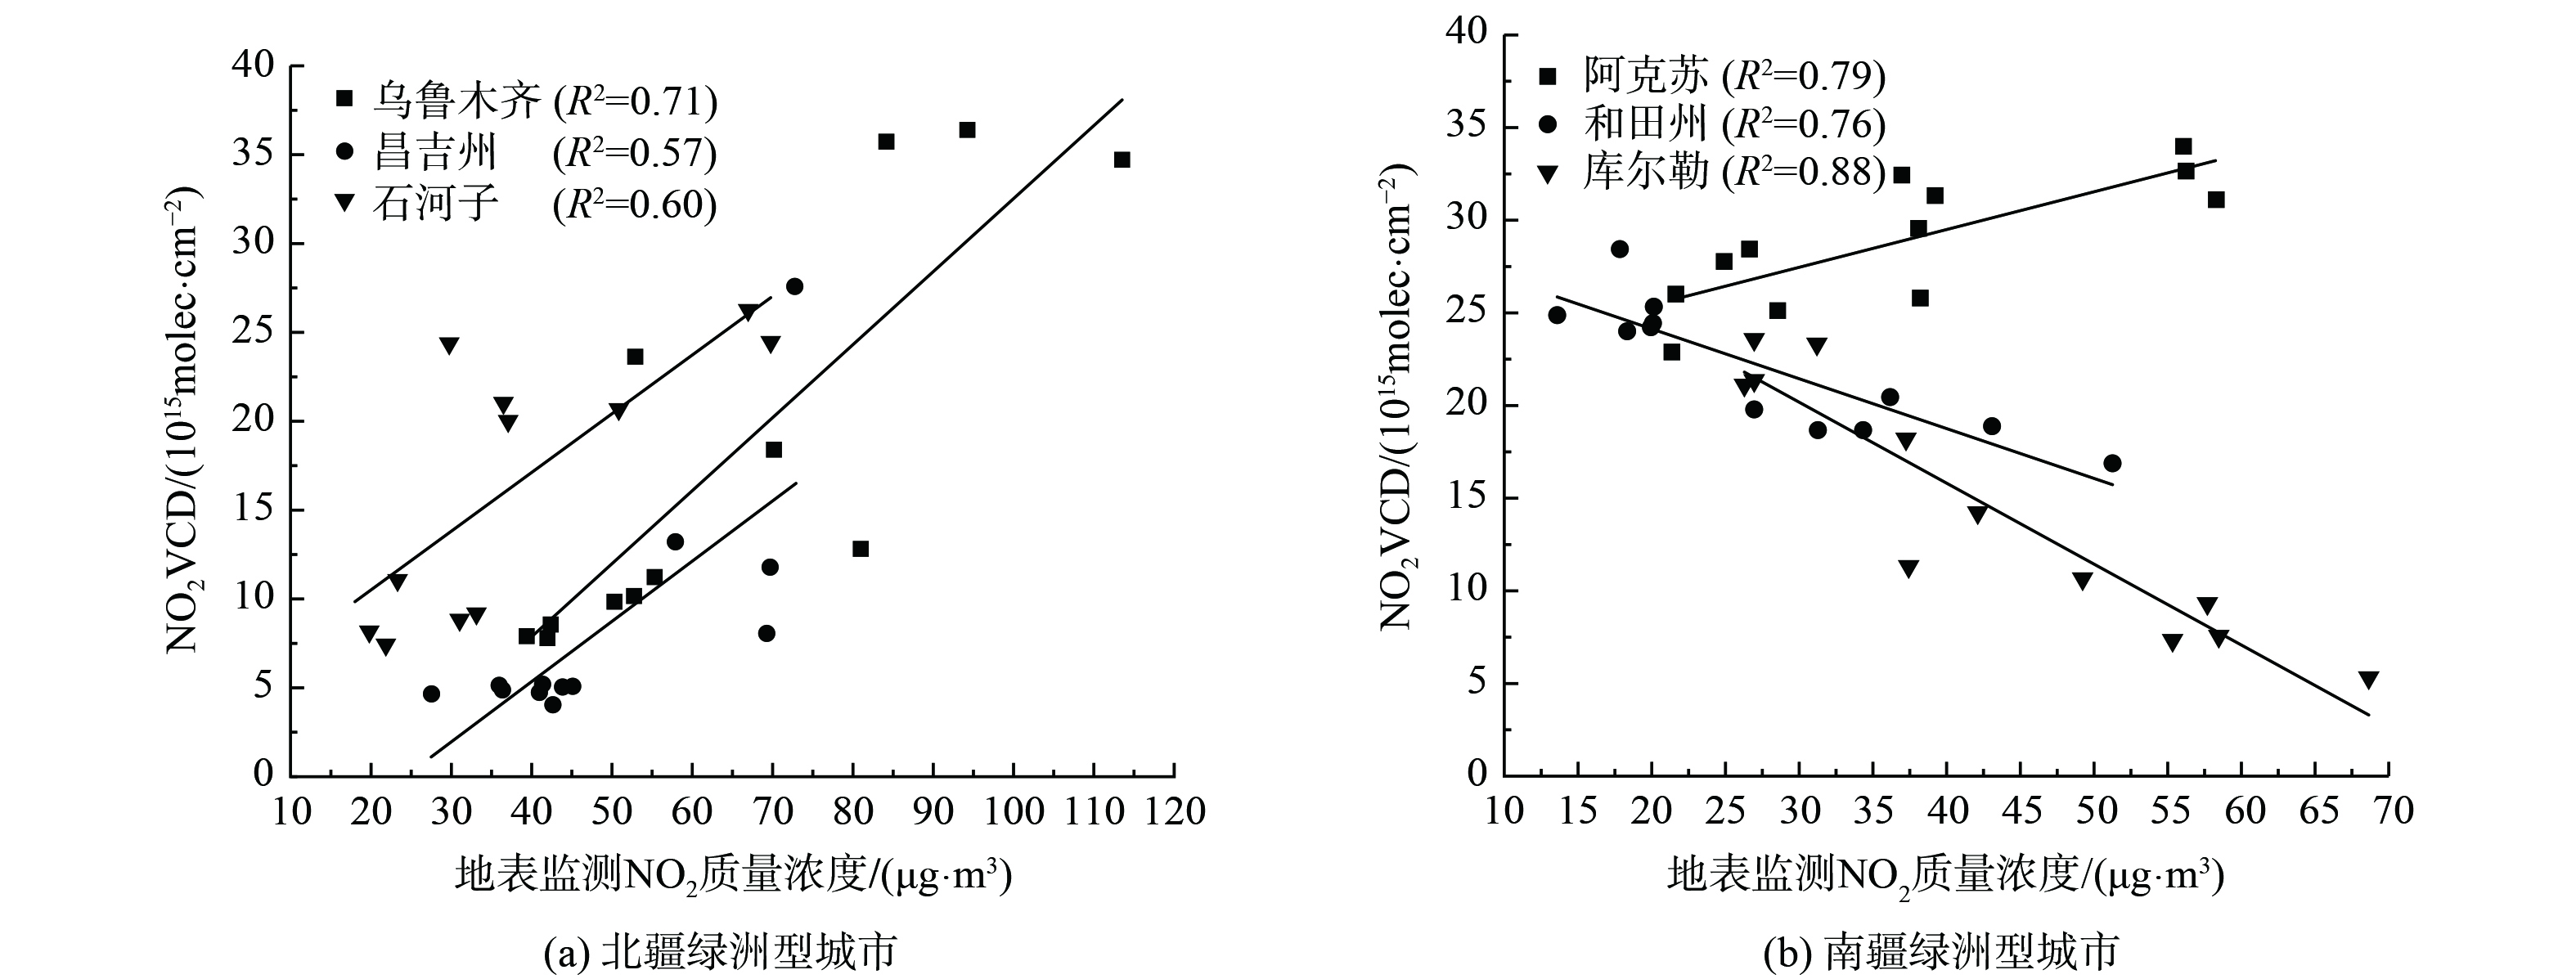
本研究采用从荷兰皇家气象研究所 (KNMI) 网站 (https://www.knmi.nl/home) 获取的OMI每天午后过境的NO2浓度数据 (逐月) 进行分析。空间分辨率为0.125°×0.125°。时间跨度为2006—2020年。地面监测资料由中国环境监测总站网站提供 (以下简称DMJC,即地面监测数据) ,单位为µg·m−3。如图1所示,2种数据具有较好的相关性、较高的一致性。2014—2017年每日9—20时,利用多轴差分吸收光谱技术 (MAX-DOAS) 在乌鲁木齐市的中泰化工楼,以及库尔勒市的巴州车管所采集地基监测数据。另外,全球同化气象数据 (Global Data Assimilation System,GDAS) 由美国国家环境预报中心 (National Centers for Environmental Prediction,NCEP) 提供,时间跨度同样为2006—2020年;经济数据来自《新疆统计年鉴》。
-
1) 高光谱遥感技术NO2反演方法。光谱覆盖波段为270~500 nm,光谱分辨率约为0.6 nm。利用非线性最小二乘拟合的方法获取NO2的斜柱浓度;使用辐射传输模式计算NO2大气质量因子,将NO2的斜柱浓度转化为垂直柱浓度。为便于分析,在时间变化中对新疆2006—2020年的数据计算年均值,同时进行季节均值计算。其中,春季为3、4、5月;夏季为6、7、8月;秋季为9、10、11月;冬季为12月及次年1、2月。
2) 地面监测方法。为验证OMI遥感数据的真实性,将其与中国气象网提供的地面监测数据与MAX-DOAS地基监测数据进行对比。地基监测数据的获取参考Lambert-Beer定律[14]。通过最小二乘算法分析3组监测数据,获得差分斜柱浓度数据[15]。根据《全国统计用区划代码与城乡划分代码公告》选取城乡监测位置。利用Win-DOAS2.1软件进行光谱处理,光谱波长400~420 nm。
3) 趋势分析。采用一元线性回归分析法进行趋势分析,可计算数据随时间变化的回归斜率[16],记为
$ {\theta }_{\mathrm{s}\mathrm{l}\mathrm{o}\mathrm{p}\mathrm{e}} $ 。式中:n为监测的年数;
$ x{}_i $ 为第i年的NO2均值。$ {\theta }_{\mathrm{s}\mathrm{l}\mathrm{o}\mathrm{p}\mathrm{e}} $ >0则表明呈现增加趋势,反之则为减少趋势。本研究将近15年为3个阶段 (“十一五”期间(2006—2010年)、“十二五”期间(2011—2015年)、“十三五”期间(2016—2020年)) 来分析NO2的排放趋势。4) 重心轨迹模型。在“重心”应用物理研究中,NO2排放强度重心反应该地区地理现象及时间变化趋势[17]。故本文的NO2排放重心变化特征能反映污染物变化程度与变化趋势。其计算公式有式(2)、(3)。
式中:
$ {z_i} $ 为第i个平面空间单元属性值;($ x{}_i $ ,$ {y_i} $ )为第i个平面空间单元坐标值;($ \overline x $ ,$ \overline y $ )为第i个平面空间单元空间均值。5) 混合单粒子拉格朗日轨迹模型。该模型由美国国家海洋和大气管理局(National Oceanic and Atmospheric Administration,NOAA)开发,为具有不同污染物排放源的综合模型[18],其分辨率为1°×1°。为更准确地分析气流输送条件,对新疆天山南北城市(2006—2020年)进行四季气团聚类分析。
6) 潜在源贡献法。PSCF将与气象信息相结合,确定污染物迁移路径和潜在源区[19]。
式中:PSCFij为某一网格ij的潜在源贡献值;mij为某一网格ij污染要素值超过阈值的污染轨迹端点数;nij为经过某一网格ij所有气流轨迹端点数。
为减少PSCF作为一种条件概率分析的不确定性,引入权重函数Wij计算加权潜在源贡献分析(WPSCF)和加权权重浓度轨迹分析(WCWT)[20]。
-
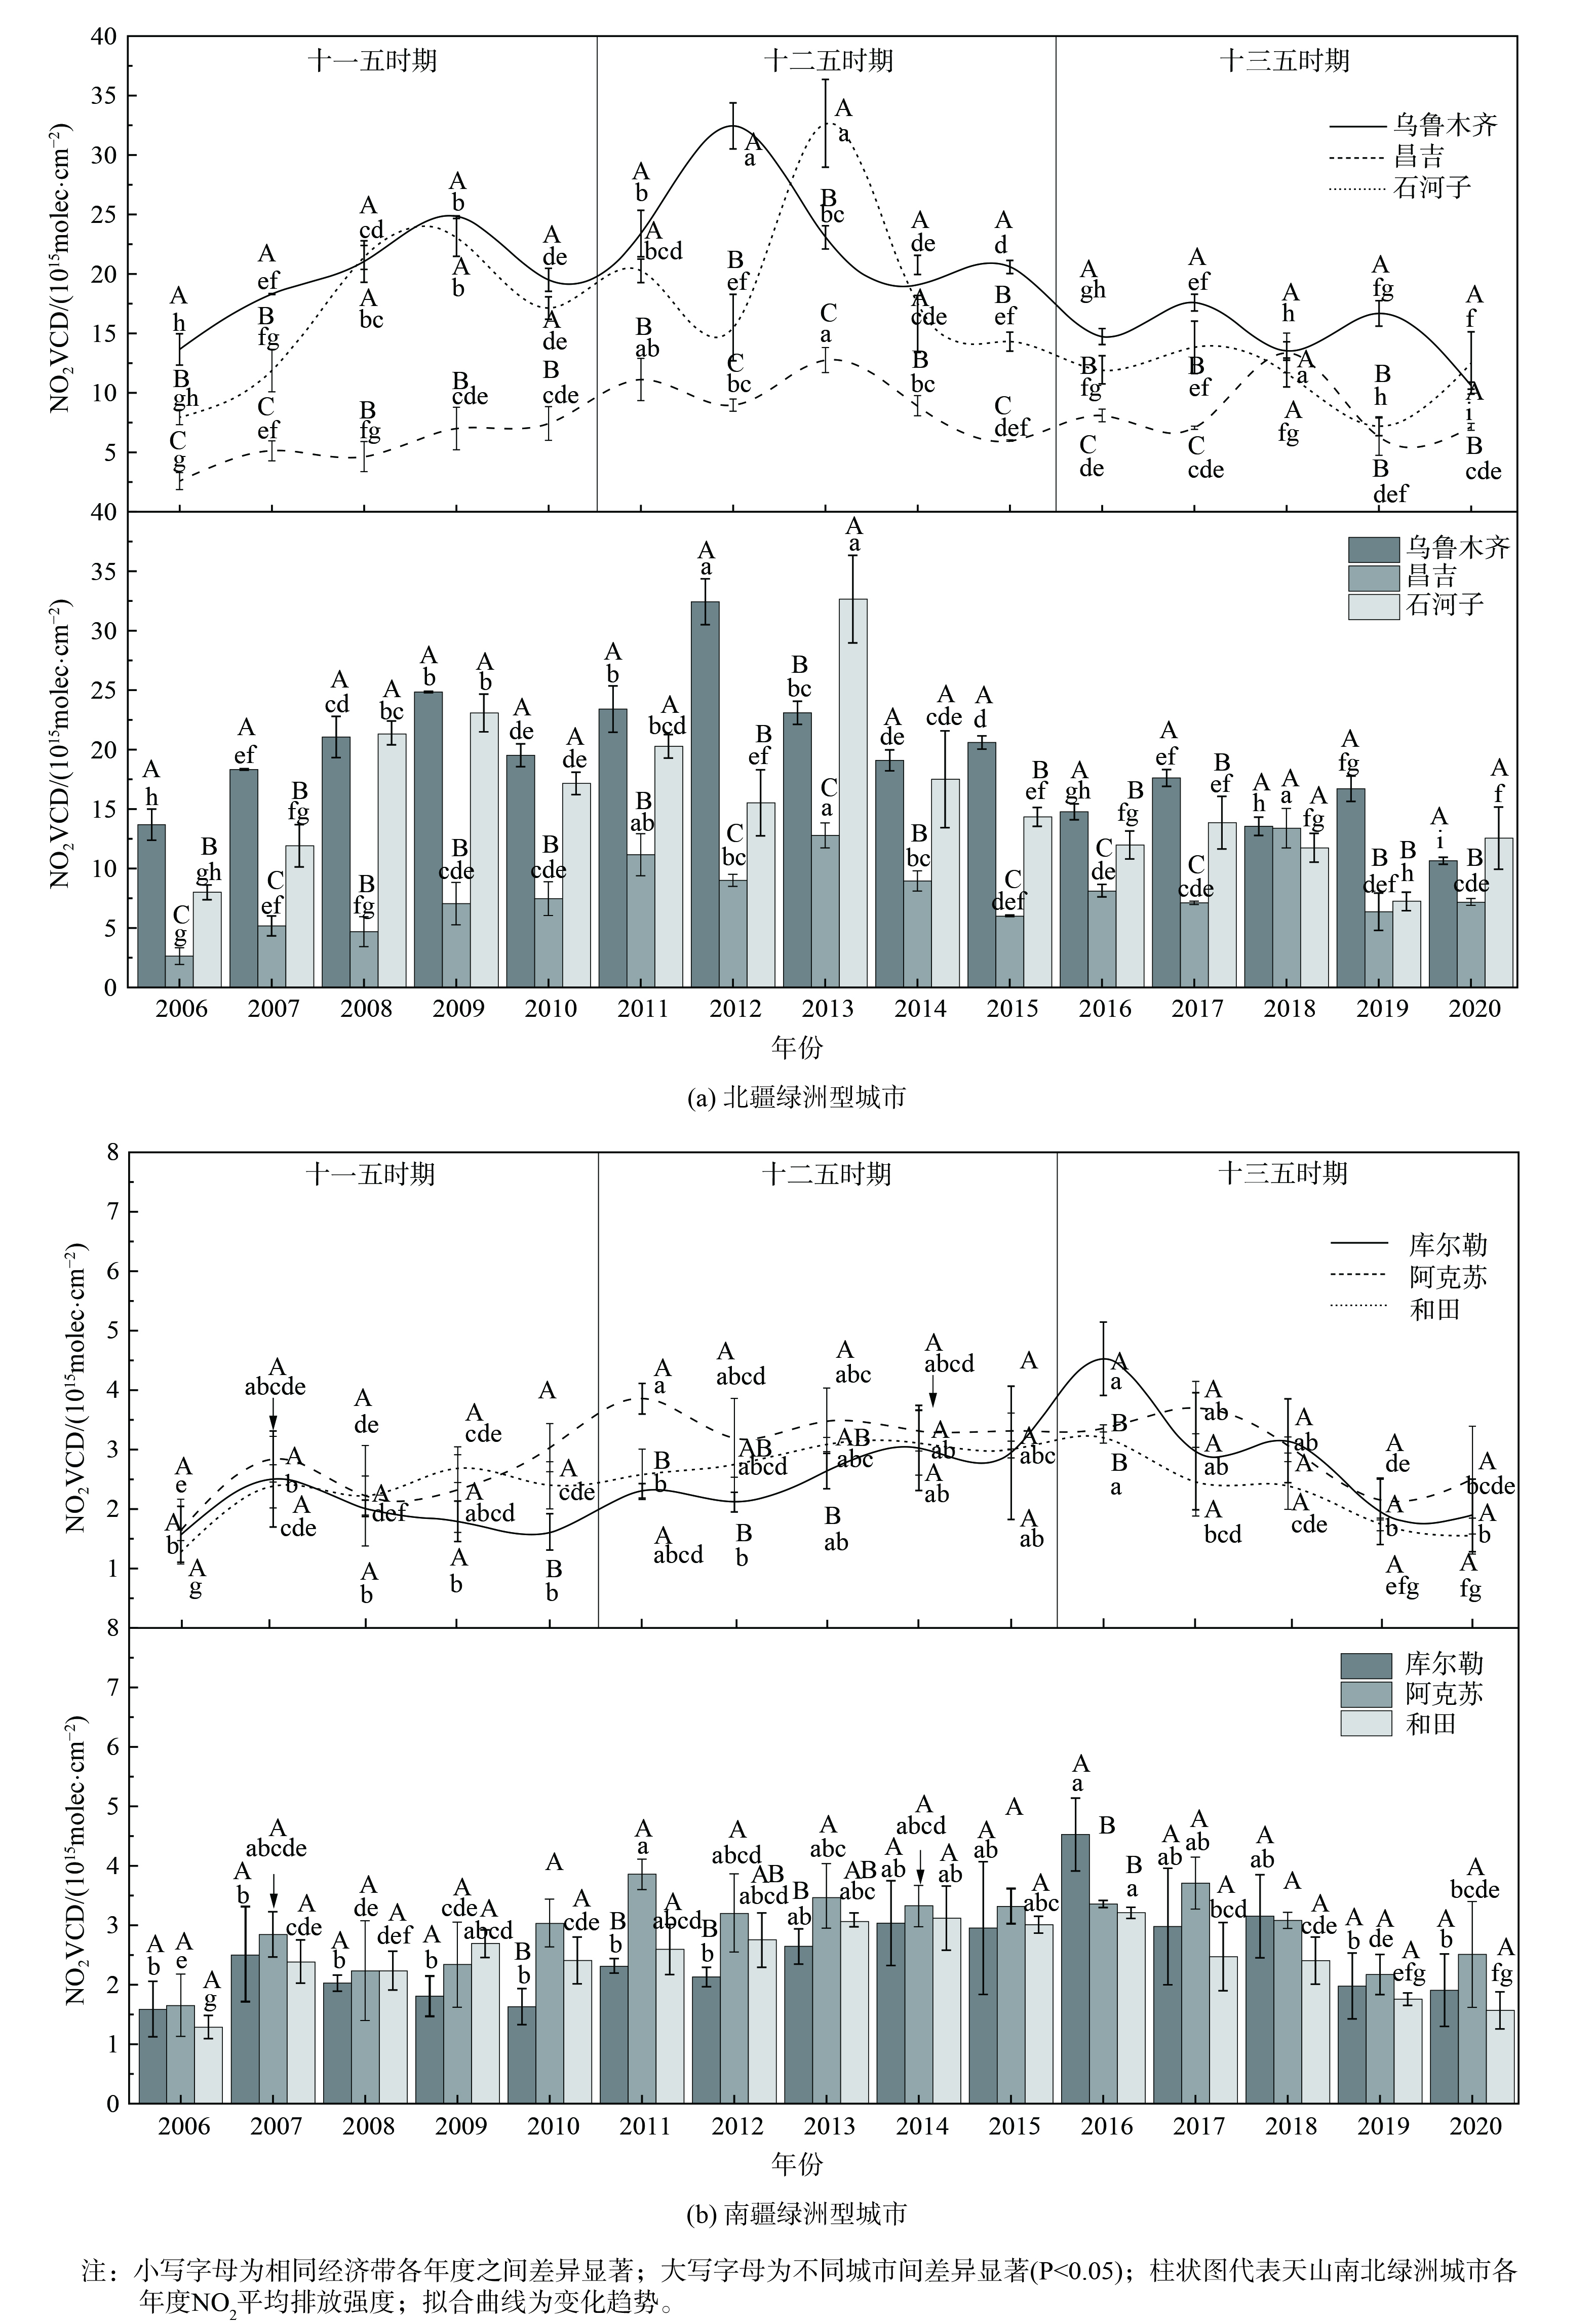
1) 年际变化。由表1可知,近15年NO2垂直柱浓度的平均值为1.58×10¹⁵~28.77×10¹⁵ molec·cm−2。根据该数值大小进行排序为:乌鲁木齐>石河子>昌吉>博乐>吐鲁番>喀什>奎屯>阿克苏>库尔勒>和田。根据年际NO2垂直柱浓度数据发现,“十二五”期间NO2垂直柱浓度最高,“十三五”期间最低。统计学分析结果表明,南疆城市的阿克苏、库尔勒、和田与北疆城市的乌昌石地区差异性最显著(p<0.05),应重点关注在不同时间尺度下这些区域的污染物输送机理差异。
“十一五”期间,新疆能源行业的工业排放有显著增长[21],NO2污染也随之增长。而在整个自治区范围内,北疆城市 (除乌鲁木齐外) 的NO2排放增长幅度高于南疆城市。其中,按增长率大小进行排序为:昌吉(38.89%)>石河子(20.68%)>阿克苏(16.86%)>和田(16.71%)>库尔勒(11.97%)>乌鲁木齐(10.94%)。“十二五”期间,整个自治区内NO2垂直柱浓度继续增长,但部分城市增长速度有所减缓,增长率排序为:昌吉(−12.31%)>石河子(−8.48%)>乌鲁木齐(−5.29%)>库尔勒(−1.51%)>阿克苏(1.05%)>和田(2.30%)。这表明北疆城市降低速度大于南疆城市,与2012年后“煤改汽”和高排放车辆报废等政策有关。基于我国能源发展的十二五规划,新疆为国家五大综合能源基地之一,2014年新疆亦成为我国第14个大型煤炭基地,因此,此阶段自治区的NO2垂直柱浓度在“十二五”期间有了一定增长,较十一五期间更高。到了“十三五”期间,南疆城市的NO2垂直柱浓度降低幅度大于北疆城市,相关城市排序为:库尔勒(−13.58%)>和田(−12.60%)阿克苏(−12.13%)>乌鲁木齐(−6.85%)>石河子(−4.15%)>昌吉(−3.99%)。如图2所示,大型城市乌鲁木齐在“十一五”、“十二五”期间整体呈明显上升趋势(p<0.05),并在2012年达到峰值(28.77×1015 molec·cm−2),又由于新冠疫情影响在2020年达到最低值(10.44×10¹⁵ molec·cm−2)。在“十一五”、“十二五”期间,中小型城市的相关数据基本持平不变或略微上升趋势,而中型城市在2013年达到峰值。仅有南疆城市库尔勒在2017年才达到峰值(2.51×10¹⁵ molec·cm−2)。小型城市和田市在2016年达到峰值(3.31×10¹⁵ molec·cm−2)。而在“十三五”期间,大中小型城市的相关数据均呈下降趋势。
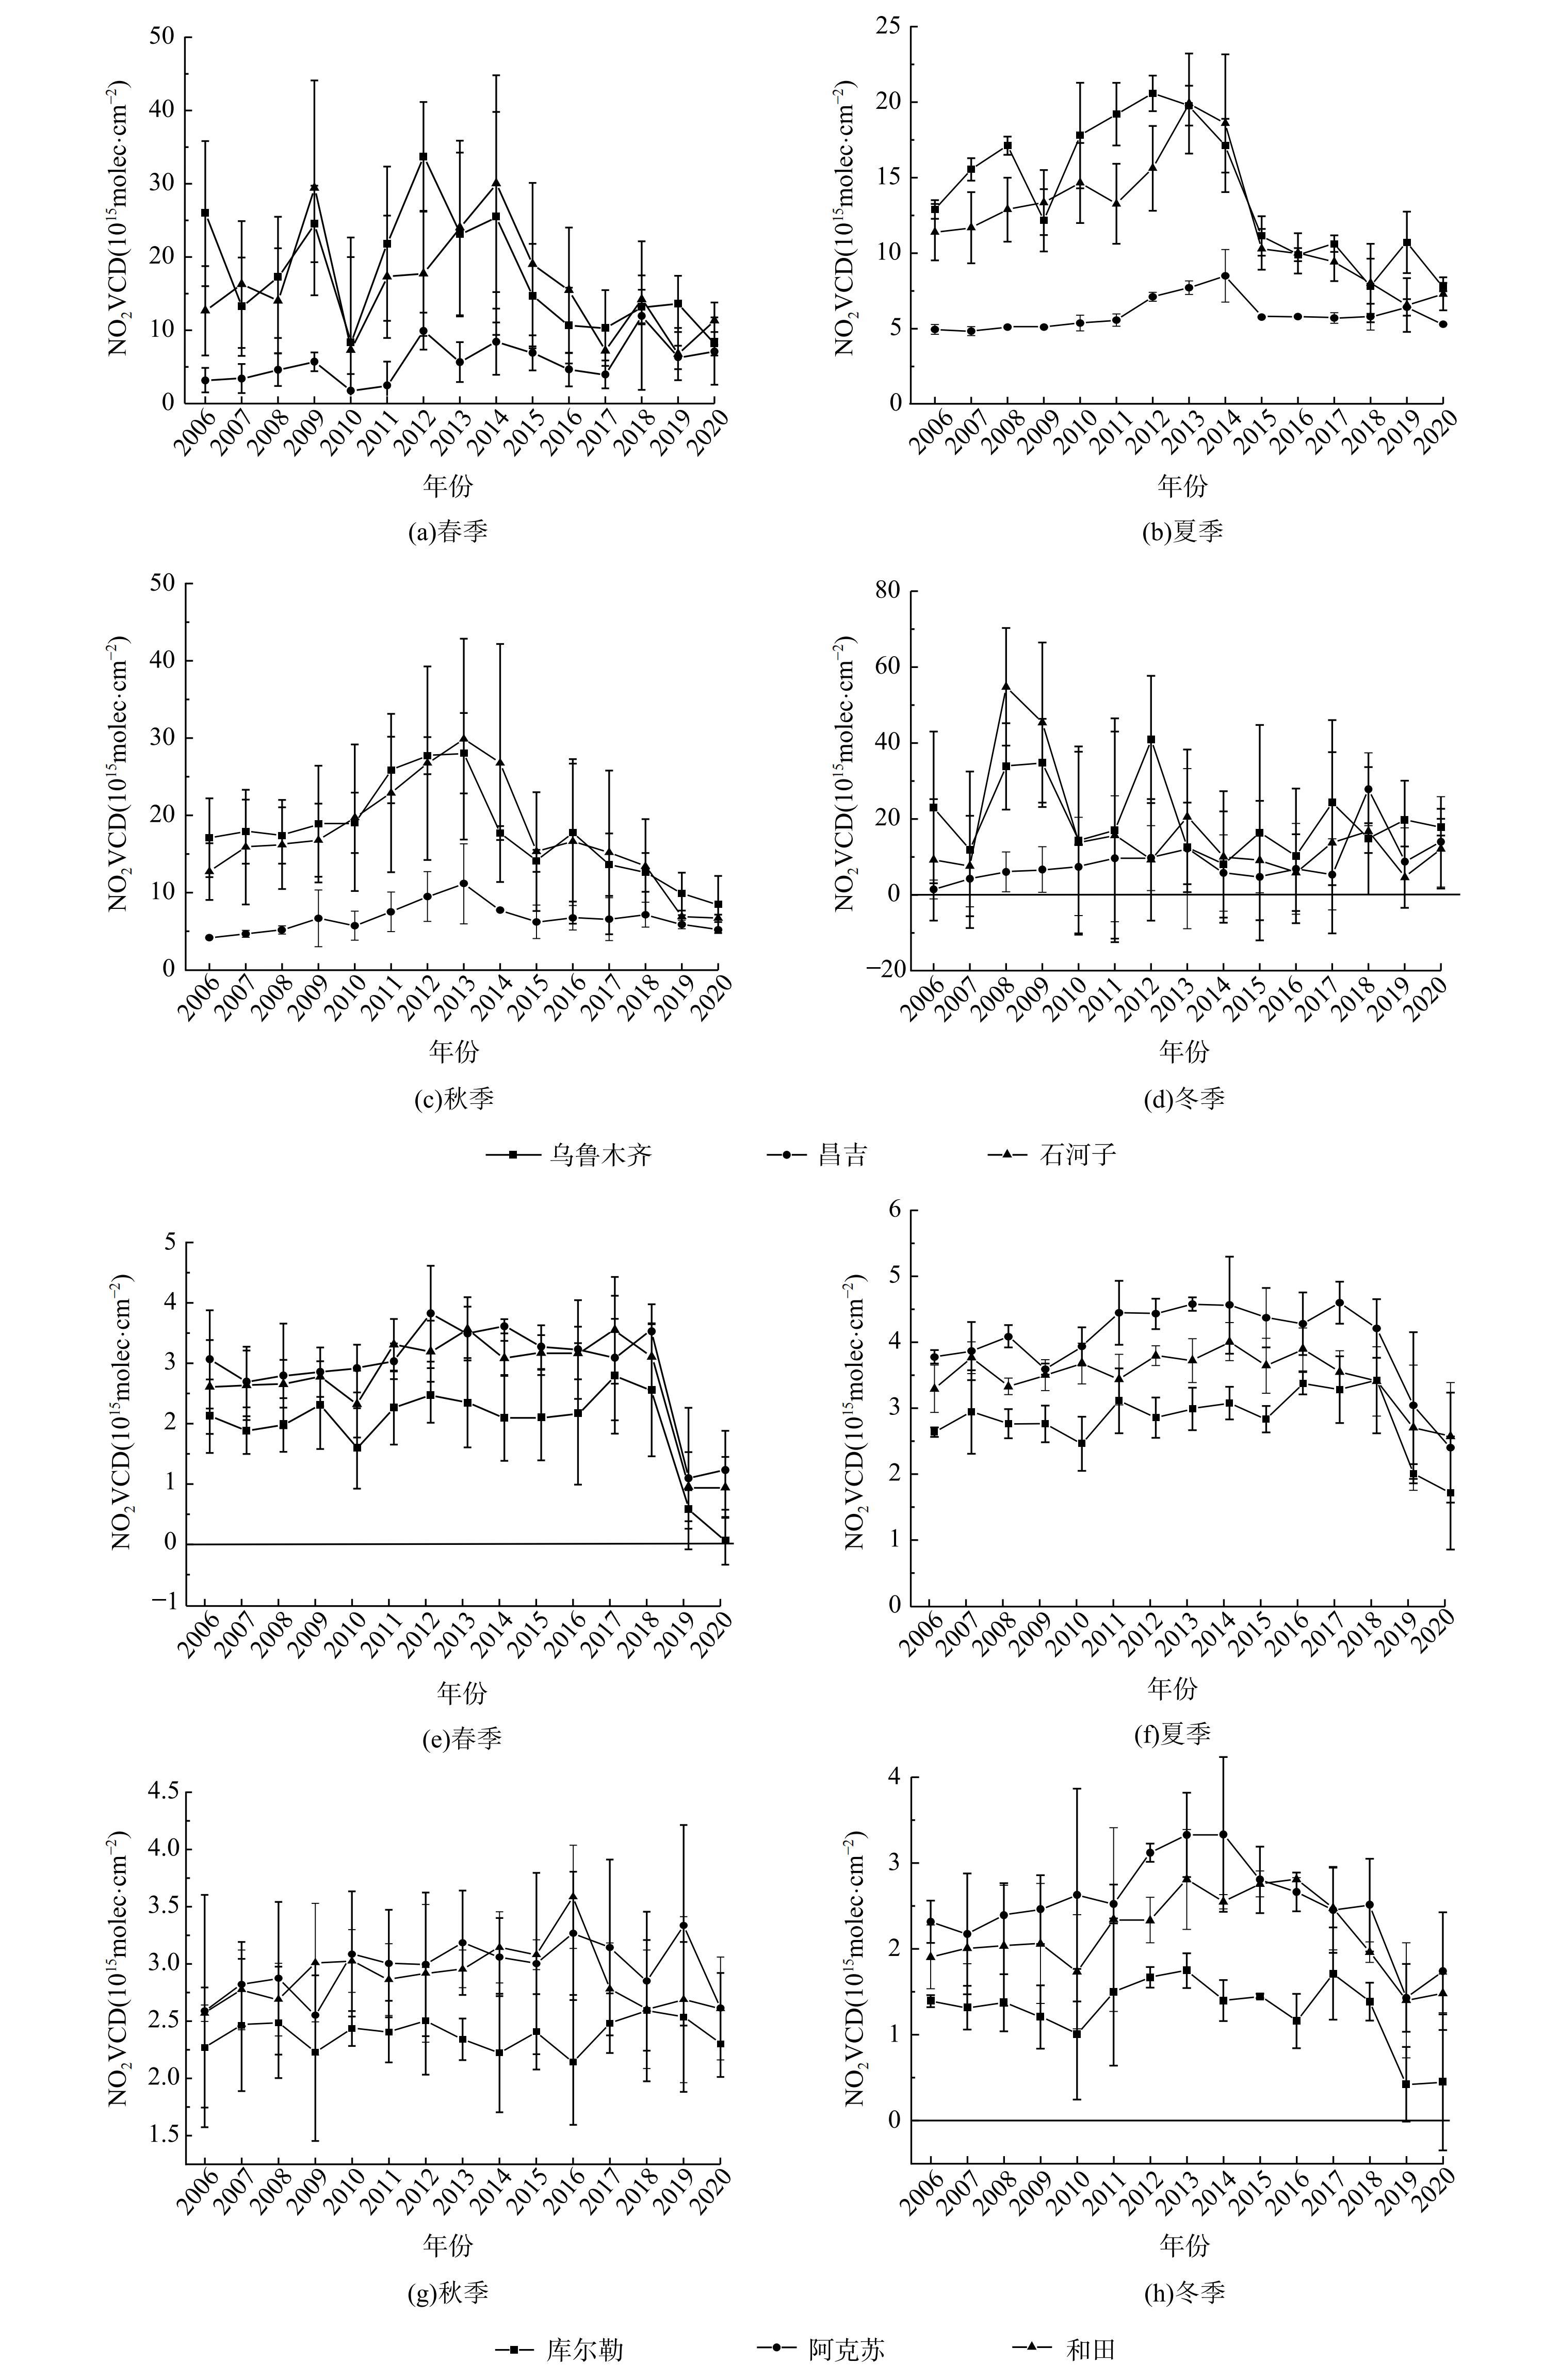
2) 季节变化。由于冬季太阳辐射强度和气温等低于夏季,使得NO2污染物不易被分解,故秋冬季NO2污染高于春夏季。由表2可知,在“十一五”期间,秋季NO2垂直柱浓度的减少幅度最大(-11.45%);在“十二五”期间,冬季NO2垂直柱浓度的减少幅度最大(-9.74%);其他季节均在“十三五”期间减少幅度最大;南北疆季节变化差异显著(p<0.05)。
由图3可知,对于北疆城市,其NO2垂直著浓度按季节排序为:冬季(38.90×10¹⁵ molec·cm−2)>秋季(21.77×10¹⁵ molec·cm−2)>春季(13.77×10¹⁵ molec·cm−2)>夏季(10.10×10¹⁵ molec·cm−2);对于南疆城市,其NO2排放量按季节排序为:夏季(3.36×10¹⁵ molec·cm−2)>春季(3.03×10¹⁵ molec·cm−2)>秋季(2.37×10¹⁵ molec·cm−2)>冬季(1.89×10¹⁵ molec·cm−2)。对比春季北疆城市的NO2排放量发现,乌鲁木齐(24.89×10¹⁵ molec·cm−2)与石河子(18.24×10¹⁵ molec·cm−2)的数据在“十一五”期间达到峰值,仅有昌吉市(13.90×10¹⁵ molec·cm−2)在“十三五”期间达到峰值,而南疆城市均在“十二五”期间达到峰值。对比冬夏两季数据发现,南北疆城市均在“十二五”期间达到峰值。而在秋季,除库尔勒(2.88×10¹⁵ molec·cm−2)在十三五”期间达到峰值外,其余南北疆各地均在“十二五”期间达到峰值。
3) 污染物重心变化特征。图4表明,近15年来,北疆城市的排放重心集中在乌鲁木齐东南部郊区与昌吉州西南部交界处的甘泉堡工业园附近,而研究区域的南疆排放重心则集中在工业发展较快的阿克苏市附近。
为进一步讨论重心变化规律,考虑到卫星数据受到极端天气和国家减排政策影响,设定2个时间尺度 (3年和5年) 来分析2006—2020年不同时间尺度下污染重心迁移变化情况。以3年为时间尺度的研究结果表明,2009年,在乌鲁木齐米东区成立了“国家级石油化工产业基地”,又因风向与地形因素的影响,2009—2011年与2006—2008年的数据对比表明,北疆的污染重心朝西北方向大城市乌鲁木齐东南部郊区 (达坂) 转移。2012年,在五家渠成立国家级经济技术开发区,使得2012—2014年的城市污染重心朝东北方向昌吉州西南部转移。2014年后,准东煤田成为我国第14个大型煤炭基地的组成部分。因此,2015—2017年该区域的污染重心朝西南方向转移,并集中在乌鲁木齐东南部郊区 (达坂) 与昌吉州西南部交界处甘泉堡工业园附近。2018—2020年,北疆污染重心朝准东经济技术开发区偏移,而南疆重心转移距离则不明显 (以向北方向移动为主) 。以5年为时间尺度的研究结果表明,天山以北城市在“十一五”期间的污染重心分布在乌鲁木齐东南部郊区 (达坂) ,而在“十二五”期间污染重心向准东经济技术开发区偏移,并在“十三五”期间继续向东北方向偏移。而南疆城市的污染重心分布情况则由和田地区北部不断向西北方向阿克苏市偏移。综上所述,近15年来,研究区域内的污染重心波动频繁,但重心偏移轨迹均向北部第二产业快速发展地区移动。
-
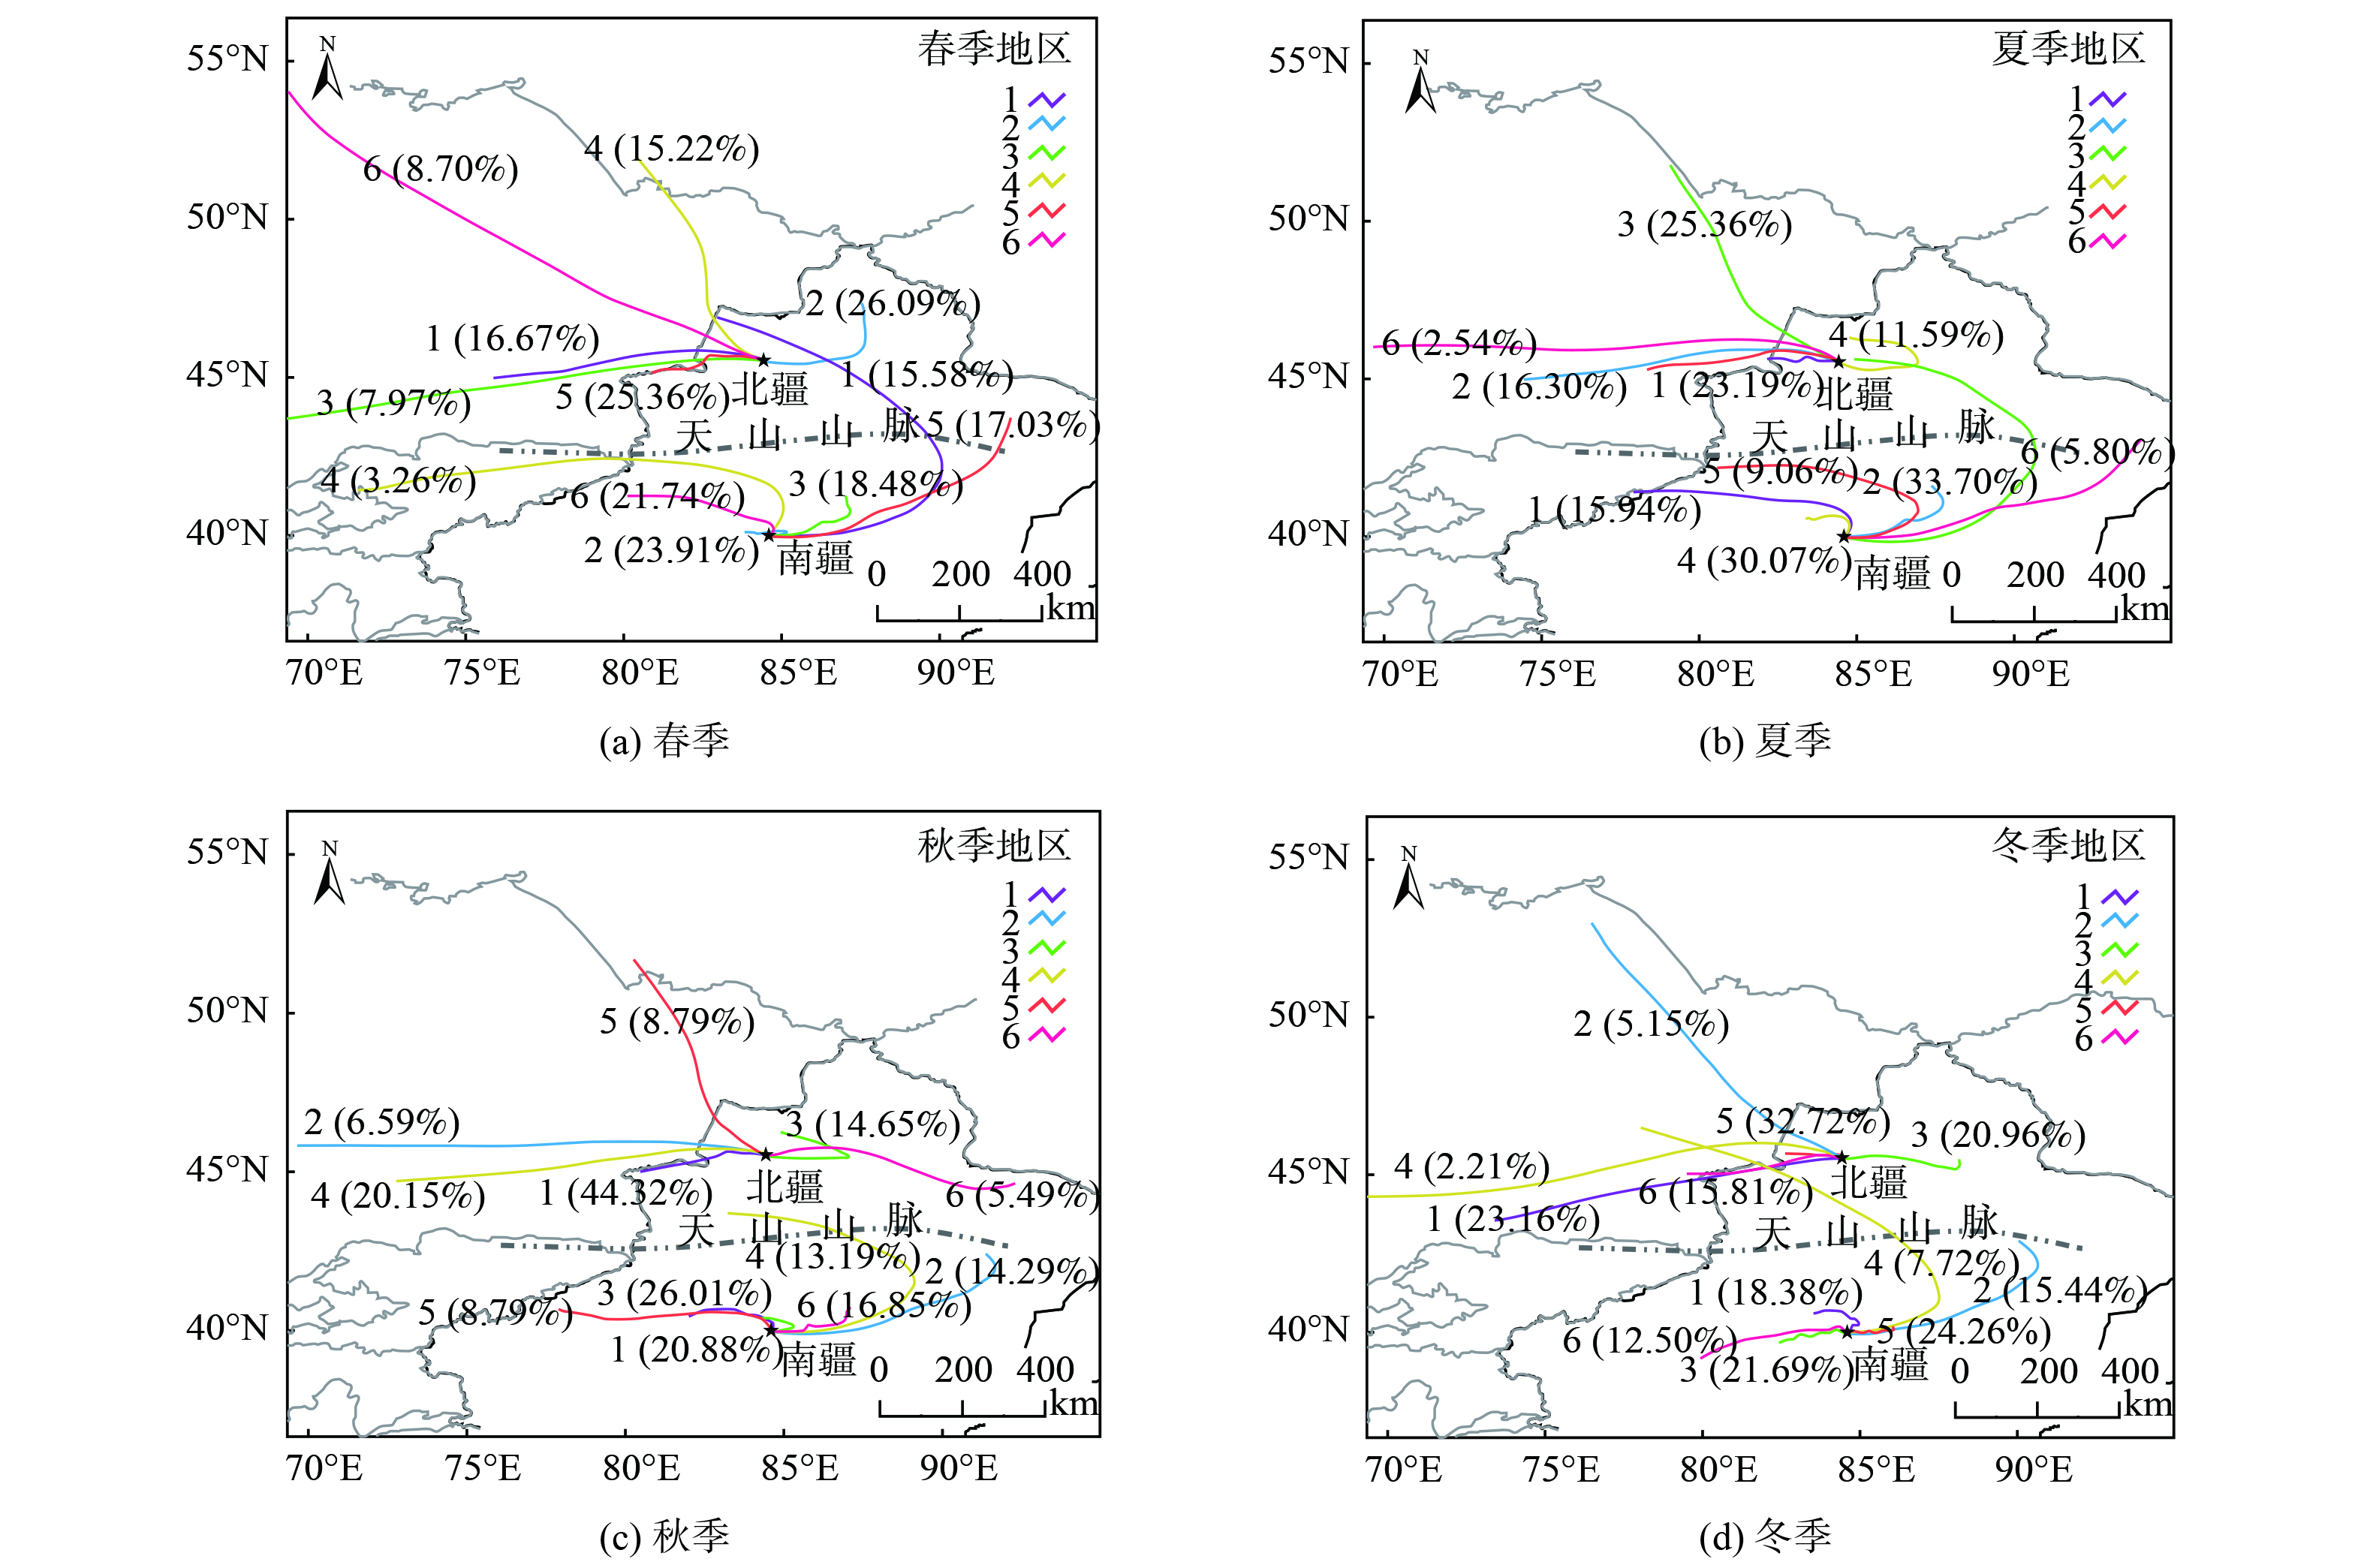
1) 重点地区气团轨迹来源。NO2污染不仅受到本地污染源排放的影响,还受到邻近地区跨区域输送影响[22]。为进一步了解气团输送对研究区域内NO2污染的影响,设定500 m为高度,48 h为后向追溯时,对4个季节分为6条聚类。选择大型城市乌鲁木齐市 (北疆,87.58E、43.83N) 和工业城市库尔勒 (南疆,86.14E、41.75N) 为代表,分析近15年来NO2污染随气团变化的影响。由图5可知,在本地源和气团传输共同影响下,北疆的四季均以远距离输送为主,西北气流占比最大。这是由于西北气流最远来自哈萨克斯坦,途径克拉玛依进入新疆腹地。而南疆城市以近距离输送为主,各季节气流变化明显。在春季与秋季,西北气流占比最大,主要途径阿克苏、喀什等南疆地区。而在夏季与冬季,东北气流占比最大,主要途径北疆乌昌石等人口密集地区。
2) 重点地区疫情前后污染程度分析。前述气团来源表明,南疆以近距离为主,北疆则以远距离为主。然而,在正常情况下,NO2是短寿命气体[23],受远距离输送影响不大,可利用PSCF模式进行计算。北疆的WPSCF潜在源区(WPSCF>0.5)主要分布在新疆中部与西北方向,包括NO2污染重心工业园区最集中的乌昌石等地。而南疆的WPSCF潜在源区(WPSCF>0.5)主要分布在工业发展较快的库尔勒与阿克苏地区。将疫情各阶段的污染物浓度值与2019年同期数据进行对比,第一阶段划定为疫情输入期 (1月1日—1月27日) ;第二阶段为输入与本地传播并存期 (1月28日—3月4日) ;第三阶段为“外防输入、内防反弹”阶段 (3月5日—7月16日) ;第四阶段疫情爆发期 (7月17日—9月1日) 。由表3可知,疫情前后除第一阶段疫情输入期外,其余阶段NO2污染均呈下降趋势。其中,第二阶段输入与本地传播并存期降幅最大。这说明疫情期间控制人为源对大气污染治理由明显的积极作用。
3) 新疆NO2污染物对人为排放源空间扩散特征。根据中国多尺度排放清单模型 (Multi-resolution Emission Inventory for China,MEIC) ,可对研究区域内不同排放源进行研究[24]。结果表明,新疆的NO2污染增加以工业源与交通源为主,而电厂源与居民源的影响较小[25]。表4说明,在“十一五”时期,由于高排放车辆报废政策的颁布,民用汽车的拥有量增长放缓,交通排放则明显减少;在“十二五”时期,新疆成为国家五大能源基地之一,工业生产总值较“十一五”期间倍增,故工业源排放显著增加;2013年“大气十条”出台后,新疆部分地区的减排效果显现。前文表明,在2012年,除乌鲁木齐外,天山以北其余城市的NO2排放量均达峰值;而南疆城市则在2016年后达到峰值,之后均呈下降趋势;在“十三五”时期,城市工业生产总值均显著下降,再加上2020年疫情期间人群流动的减少,亦对大气污染的减排有促进作用,如乌鲁木齐的2020年NO2垂直柱浓度为近15年的最低值。对NO2污染物的驱动因素研究[26]表明,工业生产及机动车尾气排放等人类活动已经成为NO2污染物的主要来源[27]。
4) 产业结构对不同类型城市NO2污染物空间扩散的影响。北疆地区城市秋冬季的NO2污染排放量最大[28],与本研究的结论大致相同。但也有部分学者的[29]研究表明,除乌鲁木齐外,西部其他城市的峰值均出现在夏秋两季;YIENGER等[30]发现,在偏远地区,第一产业的排放占总排放的一半以上;HE等[31]发现,东部工业城市的NO2排放峰值出现在冬季,而以自然源为主的西部城市的峰值出现在夏季。表5说明,近15年来,生产总值增长率西部盆地型城市与天山南北绿洲型城市大于东部平原型与沿海型发达城市。这表明近15年来,西部城市经济发展迅速。以绿洲型、小型城市和田为例,其第一产业平均增长值大于第二产业的平均增长值,故该城市以第一产业自然源增长为主。这也印证了天山以南城市污染排放的季节变化排序为:夏季>秋季>冬季>春季
-
1)图6表明,3组数据的变化趋势有较好的一致性:南疆地区的MAX-DOAS数据与地面监测数据均表现为冬季>春季>秋季>夏季,OMI则表现为夏季>春季>秋季>冬季;而在北疆地区的数据则表现为冬季>秋季>春季>夏季,且呈倒“U”型分布。
2)由于MAX-DOAS (地基监测数据) 与地面监测 (DMJC) 站点集中在城市及附近郊区,但南疆城镇规模小、分布不均,且分布着塔克拉玛干沙漠,故该区域无法满足长时间尺度、大范围高海拔、人烟稀少区域监测的条件。对于这类地区,OMI高光谱遥感数据则可用以弥补该缺陷。
3) OMI高光谱遥感技术易受极端天气影响,而MAX-DOAS与DMJC可采集到卫星无法获取的极端天气期间的数据。另外,由于采暖期多雾霾天气,卫星数据的敏感度降低,故采暖期卫星资料数值低于CMJC与MAX-DOAS监测数据。
4)建议针对不同研究区域的特点,结合各类监测方式的优势,以更好地验证遥感污染物监测的真实性。以此为各级政府针对不同来源污染物的治理提供基础数据,并为环境执法提供科学依据。
-
1) 近15年来,新疆NO2排放量表现为“十二五”期间>“十一五”期间>“十三五”期间。利用重心轨迹模型研究发现新疆绿洲型城市NO2重心变化规律。北疆的污染排放重心在乌鲁木齐东南部郊区与昌吉州西南部交界处甘泉堡工业园附近。南疆的研究区域的污染重心集中在工业发展较快的阿克苏市附近。
2) 结合地面监测与卫星遥感资料分析发现,新疆高海拔地区多、城市数量少,城建面积不大且分布不均。以自然源为主的南疆绿洲城市NO2污染峰值出现在夏季,而与北疆绿洲型城市相反。南疆多分布沙漠、高原、盆地等自然景观,地面监测站点仅能选在城市进行定点监测,采暖期多烟雾天气,卫星数据敏感度降低。因此,冬季南疆卫星遥感监测与地面监测所得结论不同,并且卫星资料低于地面监测资料。
3) 混合单粒子拉格朗日轨迹模型分析表明,南疆以近距离为主要输送路径,北疆以远距离为主要输送路径。但在正常情况下,NO2为短寿命气体,远距离输送影响不大,故影响新疆NO2污染排放因素均为本地源、污染物近距离传输,以及2种因素的共同影响。
基于OMI遥感数据及地面数据的新疆部分城市NO2污染特征分析及监测技术应用建议
Temporal and spatial variation of NO2 in oasis cities in Xinjiang based on hyperspectral remote sensing technology
-
摘要: 为推进《重点区域大气污染防治“十四五”规划》实施,更有效地治理新疆NO2污染。基于高光谱遥感技术,并结合地面监测技术,对新疆河谷型绿洲城市进行NO2污染物时空变化研究。结果表明:NO2污染特征整体表现为“十二五”期间>“十一五”期间>“十三五”期间;秋季“十一五”期间减少幅度最大(−11.45%);冬季在“十二五”期间减少幅度最大(−9.74%)。近15年来,北疆的NO2污染重心在乌鲁木齐东南部郊区与昌吉州西南部交界处甘泉堡工业园附近,南疆所研究区域污染主要出现在阿克苏市附近。新疆的NO2污染均由本地源与气团传输共同影响。北疆潜在源区主要分布在新疆中部,主要途径乌昌石等地区。天山南坡潜在源区主要分布在新疆南部,主要途径库尔勒与阿克苏地区。新冠疫情期间控制人为污染源排放对大气污染治理有明显影响。本研究可为新疆大气污染防治提供数据参考。Abstract: In order to promote the implementation of the “14th Five-Year Plan for the Prevention and Control of Air Pollution in Key Regions”, and to control NO2 pollution in Xinjiang more effectively. Based on hyperspectral remote sensing technology, combined with ground monitoring technology, this paper studies the temporal and spatial changes of NO2 pollutants in valley-type oasis cities in Xinjiang. The research results show that: (1) The overall characteristics of NO2 concentration are as follows: “Twelfth Five-Year” period > “Eleventh Five-Year” period > “Thirteenth Five-Year” period; the largest decrease (−11.45%) during the "Eleventh Five-Year" period in autumn; During the “Twelfth Five-Year Plan” period, the winter has the largest decrease (−9.74%). In the past 15 years, the center of NO2 pollution concentration in northern Xinjiang was near the Ganquanbao Industrial Park at the junction of the southeastern suburbs of Urumqi and the southwestern part of Changji Prefecture, and the concentration in the study area of southern Xinjiang was near Aksu City. The NO2 concentration in Xinjiang is influenced by both local sources and air mass transport. The potential source areas of northern Xinjiang are mainly distributed in the central part of Xinjiang, mainly through Wuchangshi and other areas. The potential source areas of the southern slope of the Tianshan Mountains are mainly distributed in the southern part of Xinjiang, mainly through the Korla and Aksu areas. During the COVID-19 epidemic, the control of man-made pollution sources has played a significant role in air pollution control. This study can provide data reference for the prevention and control of air pollution in Xinjiang.
-

-
表 1 新疆不同地区NO2排放浓度
Table 1. NO2 emissions in different areas of Xinjiang
城市 “十一五”时期
的排放浓度
(2006—2010年)“十二五”时期
的排放浓度
(2011—2015年)“十三五”时期
的排放浓度
(2016—2020年)乌鲁木齐 20.91 24.28 14.5 石河子 18.54 21.96 11.69 昌吉 5.99 9.71 8.23 吐鲁番 5.34 6.52 4.31 博乐 5.18 7.88 5.21 哈密 4.35 5.24 4.17 喀什 3.65 4.47 3.59 奎屯 2.92 3.22 3.12 阿克苏 3.01 3.56 2.83 库尔勒 2.06 2.26 1.92 和田 2.66 3.08 2.58 表 2 新疆主要时期NO2排放浓度变化幅度
Table 2. Variation range of NO2 emission in Xinjiang during the main period
时期 春季变化 夏季变化 秋季变化 冬季变化 非采暖期变化 采暖期变化 “十一五”时期(2006—2010年) −0.77% 3.08% −11.45% 1.99% 2.82% 6.30% “十二五”时期(2011—2015年) −0.31% −0.98% −2.86% −9.74% −2.08% −4.35% “十三五”时期(2016—2020年) −11.45% 7.40% −4.65% −4.86% −7.18% −9.05% 表 3 疫情前后各阶段NO2增减幅度
Table 3. Increase and decrease of NO2 in different stages before and after the epidemic
疫情发展阶段 乌鲁木齐 石河子 昌吉 库尔勒 阿克苏 和田 第一阶段 0.43% 0.26% 0.56% 0.37% 0.04% 0.69% 第二阶段 −0.58% −0.08% −0.26% −0.75% −0.13% −0.26% 第三阶段 −0.38% −0.03% −0.17% −0.08% −0.06% −0.1% 第四阶段 −0.07% −0.13% −0.19% −0.04% −0.16% −0.07% 表 4 新疆不同时期民用汽车拥有量与工业生产总值增长率
Table 4. Growth Rate of Civil Automobile Ownership and Industrial GDP in Different Periods of Xinjiang (%)
经济时期 民用汽车拥有量增长率 工业生产总值增长率 “十一五”时期 0.75% 0.89% “十二五”时期 1.29% 1.01% “十三五”时期 0.83% 0.19% 表 5 不同类型城市产业结构
Table 5. Industrial structure of different types of cities
城市类型 代表城市 第一产业平均增长值/亿元 第二产业平均增长值/亿元 第三产业平均增长值/亿元 生产总值增长率/% 平原型城市 北京 126.5 4 639.2 17 885.1 3.21 沿海型城市 上海 116.1 7 614.2 16 665.2 2.6 盆地型城市 重庆 930.9 5 685.1 7 102.3 5.05 北疆绿洲型城市 乌鲁木齐 19.7 586.2 1 441.3 3.99 南疆绿洲型城市 和田 56.9 36.7 31.9 5.82 -
[1] 吴淼, 杨兆萍, 张小云. 点—轴理论在新疆与西西伯利亚区域经济合作中的应用[J]. 地理学报, 2010, 65(8): 929-937. doi: 10.11821/xb201008004 [2] 新疆维吾尔自治区国民经济和社会发展第十四个五年规划和2035年远景目标纲要[N]. 新疆日报(汉), 2021-06-03(005). DOI:10.28887/n.cnki.nxjrb.2021.002896. [3] 仝泽鹏, 李艳红, 刘岩, 等. 天山南北绿洲城市重污染期对流层NO_2垂直柱浓度时空分布特征[J]. 环境污染与防治, 2018, 40(7): 812-818. doi: 10.15985/j.cnki.1001-3865.2018.07.016 [4] 2020年中国生态环境状况公报(摘录)[J]. 环境保护, 2021(4): 47-68. DOI:10.14026/j.cnki.0256-2021.11.010 [5] GALPERIN M. A Comparative genomics: From genome sequences to genome biology[J]. Journal of Proteomics & Bioinformatics, 2021, 14(5): 1-1.未查到原文,请提供. [6] ZHANG L J, WEI C, LIU H, et al. Comparison analysis of global methane concentration derived from SCIAMACHY, AIRS, and GOSAT with surface station measurements[J]. International Journal of Remote Sensing, 2021, 42(5): 1823-1840. doi: 10.1080/01431161.2020.1846221 [7] ZHU L L, MIN X S, JIA Y. Spatiotemporal variations and influent factors of tropospheric ozone concentration over China based on OMI data[J]. Atmosphere, 2022, 13(2): .未查到原文?请提供原文. [8] HUBERT D, HEUE K P, LAMBERT J C, et al. TROPOMI tropospheric ozone column data: geophysical assessment and comparison to ozonesondes, GOME-2B and OMI[J]. Copernicus GmbH, 2021, 14(12): 补充页码信息. [9] KONG L W, TAN Q W, FENG M, et al. Investigating the characteristics and source analyses of PM2.5 seasonal variations in Chengdu, Southwest China[J]. Chemosphere, 2020, 243: 125267. doi: 10.1016/j.chemosphere.2019.125267 [10] BELLA D, CULPEPPER J, KHAIMOVA J, et al. Characterization of pollution transport into Texas using OMI and TES satellite, GIS and in situ data, and HYSPLIT back trajectory analyses: implications for TCEQ State Implementation Plans[J]. Air Quality, Atmosphere and Health, 2016, 9(5): 569-588. doi: 10.1007/s11869-015-0363-2 [11] 赵权威, 何清, 王慧琴, 等. 阿克达拉大气本底站NO2输送路径及潜在源分析[J]. 环境科学学报, 2021, 41(3): 874-885. [12] MOU F S, LUO J, LI S W, et al. Vertical profile of aerosol extinction based on the measurement of O4 of multi-elevation angles with MAX-DOAS[J]. Chinese Physics B, 2019, 28(8): 199-204. [13] VLEMMIX T, PITERS A J M, BERKHOUT A J C, et al. Ability of the MAX-DOAS method to derive profile information for NO2: Can the boundary layer and free troposphere be separated?[J]. Atmospheric Measurement Techniques, 2011, 4(26): 2659-2684. [14] 任红梅, 李昂, 胡肇焜, 等. 基于多轴差分吸收光谱技术测量青岛市大气水汽垂直柱浓度及垂直分布[J]. 物理学报, 2020, 69(20): 255-267. doi: 10.7498/aps.69.20200588 [15] 韦民红, 刘诚, 李素文, 等. 基于QDOAS的多轴差分吸收光谱测量对流层HCHO的研究[J]. 光谱学与光谱分析, 2019, 39(8): 2332-2336. [16] 朱莹莹, 韩磊, 赵永华, 等. 中国西北地区NPP模拟及其时空格局[J]. 生态学杂志, 2019, 38(6): 1861-1871. doi: 10.13292/j.1000-4890.201906.012 [17] 乔中霞, 何红弟, 杨斌, 等. 香港港口近地面O3与氮氧化物浓度变化的多重分形特征[J]. 环境科学研究, 2017, 30(1): 121-129. [18] 李莉莉, 朱莉娜, 闫耀宗, 等. 绥化市一次空气污染过程及潜在源区分析[J]. 环境科学学报, 2020, 40(10): 3785-3793. doi: 10.13671/j.hjkxxb.2020.0358 [19] 方利江, 傅贤康, 谢立峰, 等. 舟山本岛大气污染输送过程的数值模拟分析[J]. 环境科学研究, 2014, 27(10): 1087-1094. doi: 10.13198/j.issn.1001-6929.2014.10.01 [20] 雷雨, 张小玲, 康平, 等. 川南自贡市大气颗粒物污染特征及传输路径与潜在源分析[J]. 环境科学, 2020, 41(7): 3021-3030. doi: 10.13227/j.hjkx.201911096 [21] 沈振萍. “一带一路”背景下的新疆研究回顾与思考[J]. 新疆社科论坛, 2017(3): 29-37. doi: 10.3969/j.issn.1671-4741.2017.03.006 [22] 古金霞, 董海燕, 白志鹏, 等. 天津市颗粒物散射消光特征及化学组分贡献研究[J]. 中国环境科学, 2012, 32(1): 17-22. doi: 10.3969/j.issn.1000-6923.2012.01.003 [23] 张志刚, 高庆先, 韩雪琴, 等. 中国华北区域城市间污染物输送研究[J]. 环境科学研究, 2004, 17(1): 14-20. doi: 10.3321/j.issn:1001-6929.2004.01.003 [24] 徐丹妮, 王瑾婷, 袁自冰, 等. 汾渭平原复杂地形影响下冬季PM_(2.5)污染分布特征、来源及成因分析[J]. 环境科学学报, 2021, 41(4): 1184-1198. doi: 10.13671/j.hjkxxb.2020.0553 [25] 苏锦涛, 张成歆, 胡启后, 等. 基于卫星高光谱遥感的2007年-2017年新疆地区大气NO2时空变化趋势分析[J]. 光谱学与光谱分析, 2021, 41(5): 1631-1638. [26] 崔远政, 姜磊, 张为师, 等. 中国西部人为源NO2污染的时空分布及影响因素研究[J]. 环境科学学报, 2019, 39(12): 4152-4161. [27] 郑子豪, 吴志峰, 陈颖彪, 等. 基于Sentinel-5P的粤港澳大湾区NO2污染物时空变化分析[J]. 中国环境科学, 2021, 41(1): 63-72. doi: 10.19674/j.cnki.issn1000-6923.2021.0008 [28] 赵晓蓉, 李艳红, 马莹萍. 新疆“乌-昌-五”城市圈对流层NO2、SO2时空变化特征[J]. 环境科学与技术, 2021, 44(6): 133-142. [29] 程韵初, 吴莹. 基于OMI资料的中国对流层NO2柱浓度时空变化及其影响因子分析[J]. 地球物理学进展, 2020, 35(5): 1644-1650. doi: 10.6038/pg2020DD0237 [30] YIENGER J J, LEVY II H. Empirical model of global soil-biogenic NOx emissions[J]. Journal of Geophysical Research Atmospheres, 1995, 100(D6): 11447-11464. doi: 10.1029/95JD00370 [31] HE Y J, UNO I, WANG Z F, et al. Variations of the increasing trend of tropospheric NO2 over central east China during the past decade[J]. Atmospheric Environment, 2007, 41: 4865-487. doi: 10.1016/j.atmosenv.2007.02.009 -


 下载:
下载:


