-
赤水河流域是长江上游重要生态屏障,生物多样性的重要保护区,生态价值弥足珍贵;更是全世界首屈一指的优质白酒产区,沿岸地区数千家酒企,为中国白酒产业贡献了数万亿产值,成为长江经济带上以生态立身的制造业产业群,具有极其重要的生态和经济地位[1-2]。赤水河水质状况的好坏不仅直接影响流域生态稳定和环境质量,还与国民经济和社会发展息息相关[2]。但由于白酒工业的快速发展及城镇化的推进,沿河取水,同时又排放大量COD、氨氮(NH3-N)等污染物进入河流,水量减少、水质变差等水环境问题逐渐显现。据报道,2001~2012年干流上茅台断面水质污染最为严重,水质整体上呈现恶化趋势,高锰酸盐指数(CODMn)、BOD5、NH3-N和大肠杆菌超标(Ⅱ类)[3-4];主要支流中盐津河污染较严重[2],其中总磷(TP)严重超标。但2015~2017年,习水县境监测结果显示除了TP,其余各指标均呈下降趋势[5]。受涵盖多省域、地形地貌复杂等因素影响,目前,关于赤水河水质时空变化的研究要么时间序列短,要么尺度范围小,还难以表征其整体水质污染变化特征。对污染源定性或推测分析显示,枯水期,水质受城镇污水影响明显[2];丰水期,主要污染源为农田径流面源污染,其次是煤矿和白酒工业[3]。但不同断面(空间尺度)是否存在一致的主要污染源尚不清楚,而这是制定出针对性和有效性防治策略的重要支撑。为此,研究基于10年(2008~2017年),干流3个断面水质、水量和对应的经济社会指标,分析水质状况的时空变化过程、趋势及其突变情况,解析其主要污染源,以期为因地制宜、科学管理赤水河流域水环境提供参考。
-
赤水河发源于云南省镇雄县,沿川黔边界流至贵州省茅台镇,经古蔺河至赤水市,再经四川省合江县与习水河相汇后入长江,干流全长444.5 km。其中上游云南省河段长73.5 km,完全流经贵州省境内的河段共长126 km,下游四川省境内51 km,川黔界河3段共长194 km。流域处于高原与盆地过渡地带,地势西南高而东北低,流域落差1 588 m,平均比降3.57‰,多年平均气温13.1~17.6 ℃,降水>量随海拔增高递减,中、下游丘陵区1 000~1 500 mm,上游高原区年降雨900~1 000 mm,降水主要集中于6~9月(约占全年的70%)。涉及云南省镇雄、威信,四川省叙永、古蔺、合江,贵州省七星关、大方、金沙、仁怀、赤水、习水、桐梓、播州13个县(市、区),流域土地总面积18 959.50 km2。
-
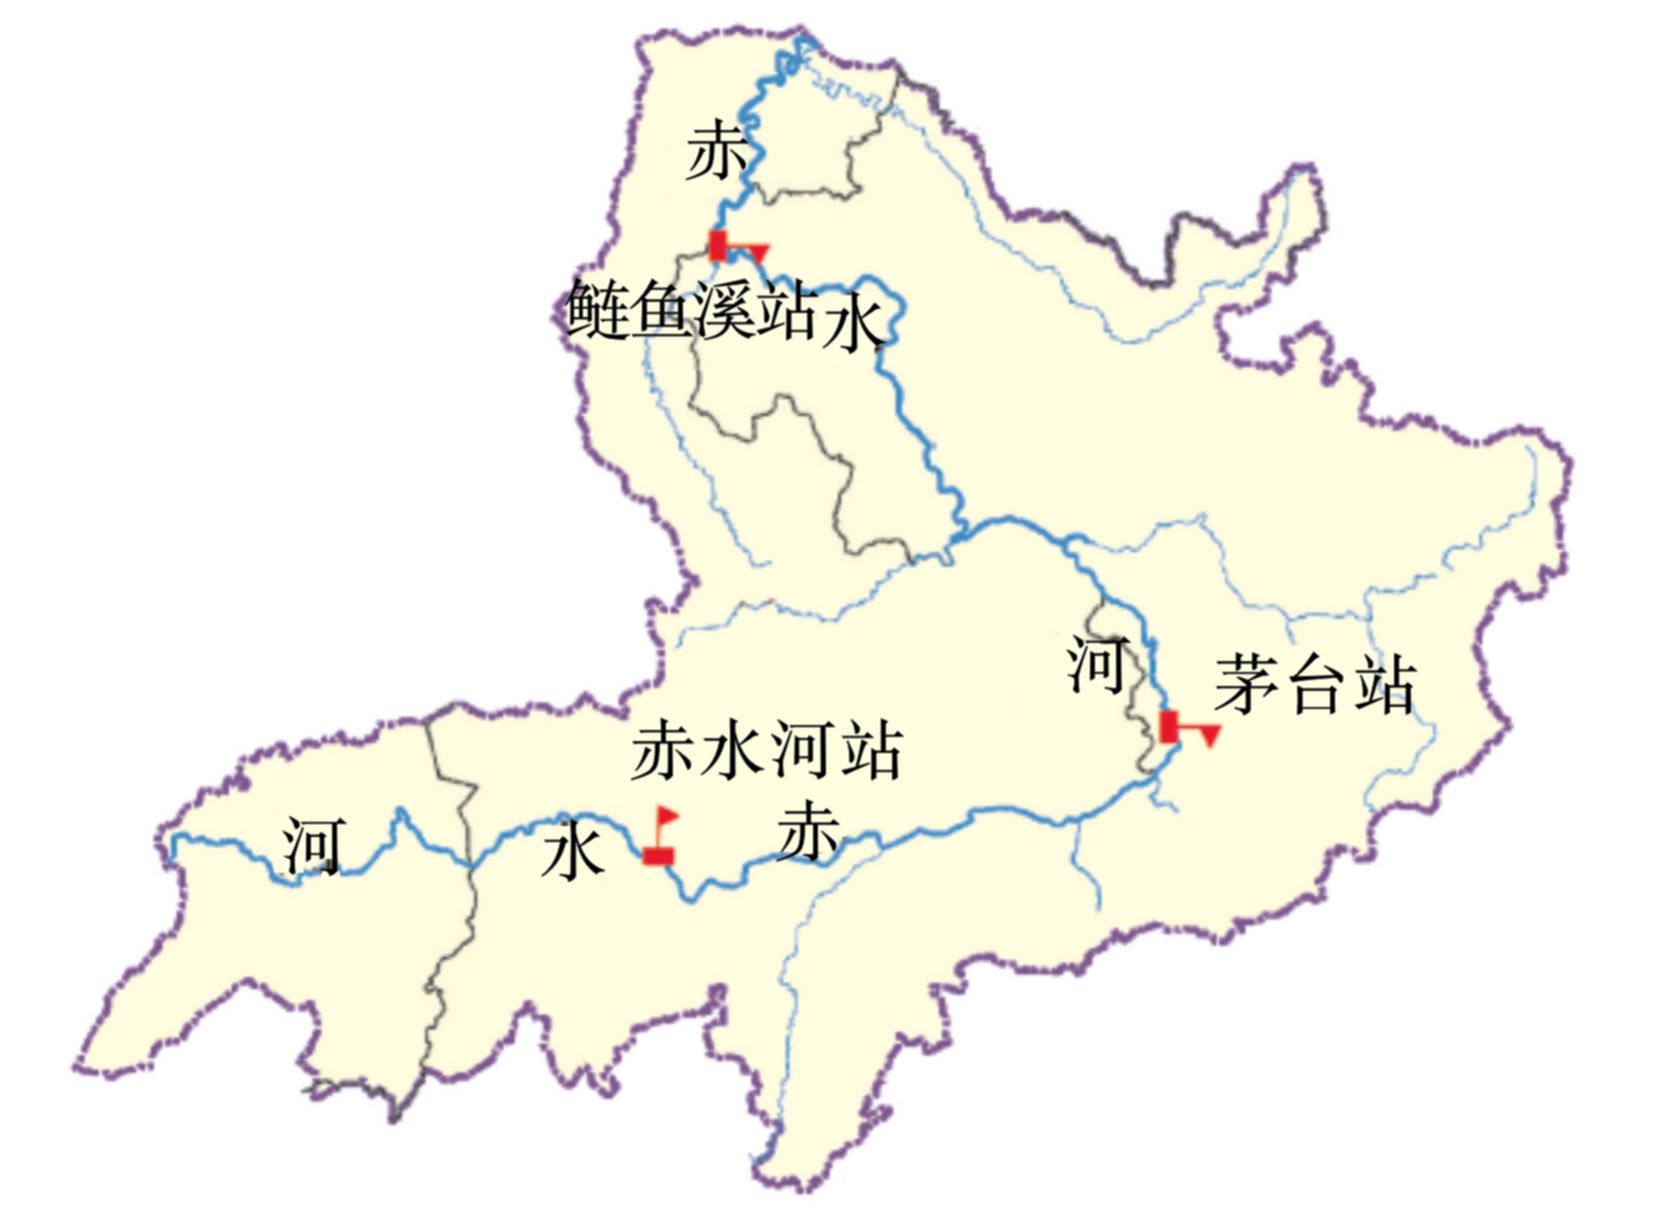
以赤水河流域(贵州省)3个长期水文、水质监测断面,分别是上游断面-赤水站、中游断面-茅台站、下游断面-鲢鱼溪站,见图1。
2008年1月~2017年12月逐月水质、水量监测数据为评价数据集。其中水质指标为国内河流水环境要求的主要考核污染物: CODMn、NH3-N和TP。
-
污染指数法是通过计算各断面水质的若干个指标的污染指数,对比相关标准以反映水体的质量状况,评价标准根据《贵州省赤水河流域环境保护规划:2013—2020年》,赤水、茅台和鲢鱼溪3个监测断面水质按照《地表水环境质量标准:GB 3838—2002》Ⅱ类考核。污染指数包括单因子污染指数、综合污染指数,见式(1~2):
式中:
$ P_{ij}$ 为j断面i指标单因子污染指数;$ C_{ij}$ 为j断面i指标的实际监测值,mg/L;$ C_{i0}$ 为i指标的Ⅱ类评价标准值,mg/L;$ P_j$ 为j断面综合污染指数;n为指标项数。 -
时间序列法能够测度出单一或多项因素对序列的作用影响,常用的方法包括趋势拟合法、平滑法、累积距平法和Mann-Kendall检验法等。其中Mann-Kendall检验法是一种非参数检验方法,变量不会受到异常值影响,能有效揭示某一样本过程的变化趋势及其突变情况[6]。采用其来分析流域内水质指标的变化规律及突变特征。
-
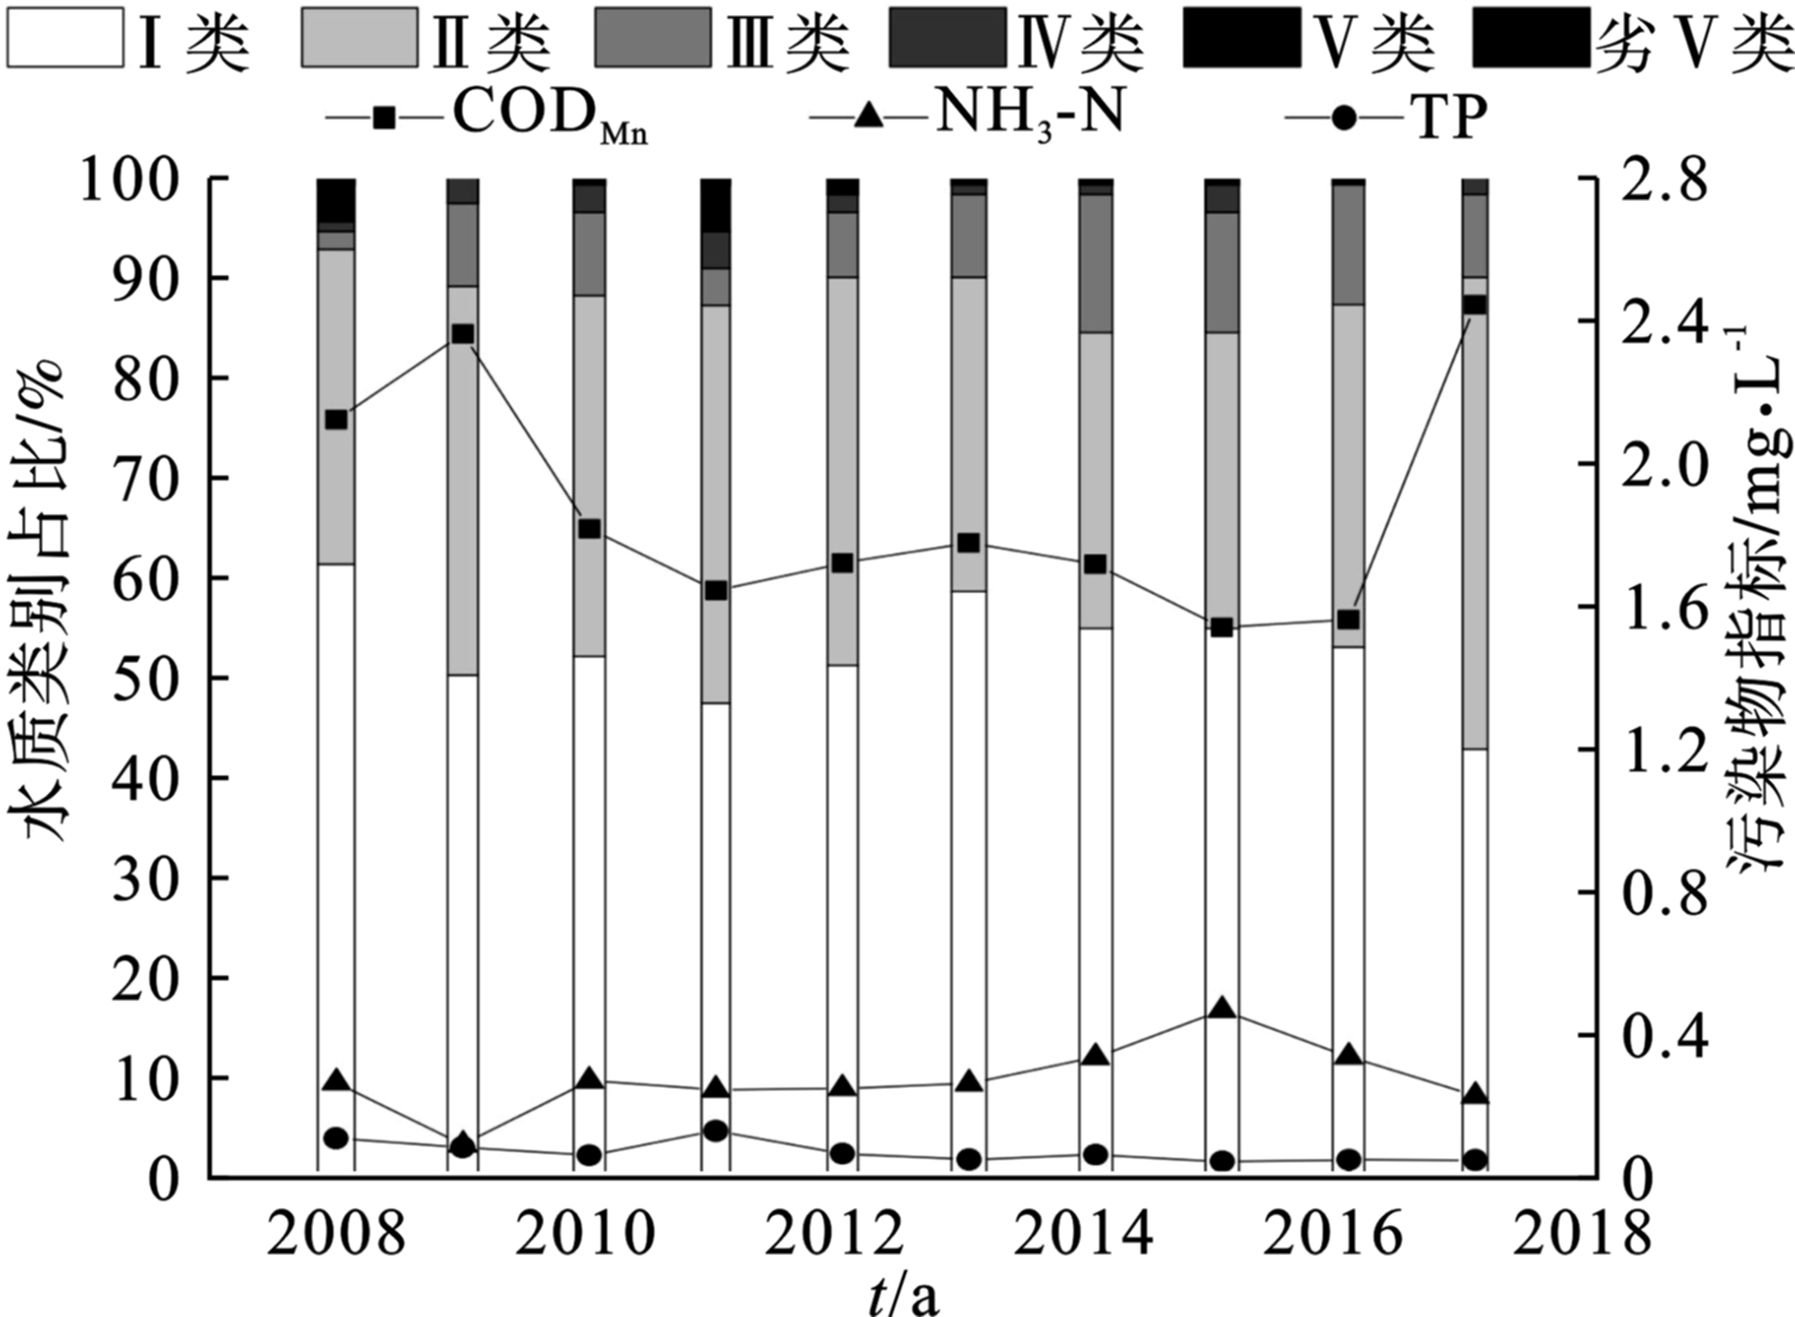
赤水河流域水质类别占比情况,见图2。
图2可知,2008~2017年间,赤水河干流以Ⅰ类、Ⅱ类水体为主,基本能达水质考核要求。但2011年以前Ⅰ类和Ⅱ类水质占比连续下降,Ⅳ类及以下水质比例则增加;2012年Ⅰ类和Ⅱ类水质占比有所回升,之后连续2年又回落,至2016年起才再次上升。从监测指标的年均浓度来看,TP浓度变化不明显,CODMn浓度变化较为显著。当CODMn、NH3-N浓度升高时,Ⅰ类水质占比明显降低,表明其为水体主要的污染因子,对水质影响较大。
-
(1)污染指数变化。各污染指数年际变化情况,见图3。
10年间,3个断面CODMn污染指数在0.23~0.91之间波动,其中茅台站和鲢鱼溪站在2017年均出现较大幅度上升。相比较,茅台站和鲢鱼溪站断面NH3-N年际变化较剧烈,其中在2009~2015年呈持续上升趋势,之后出现好转;而赤水站则呈现稳定变化特征。TP污染指数变化最为显著的是赤水站,由2008年的最高位(2.85)下降至2009年的0.25;其次是茅台站,2008~2011年TP污染指数整体呈上升趋势,2011年达到峰值2.40后出现大幅下降再逐渐趋于稳定;鲢鱼溪站TP污染指数在2008~2012年波动较大,之后在0.50上下小幅浮动。
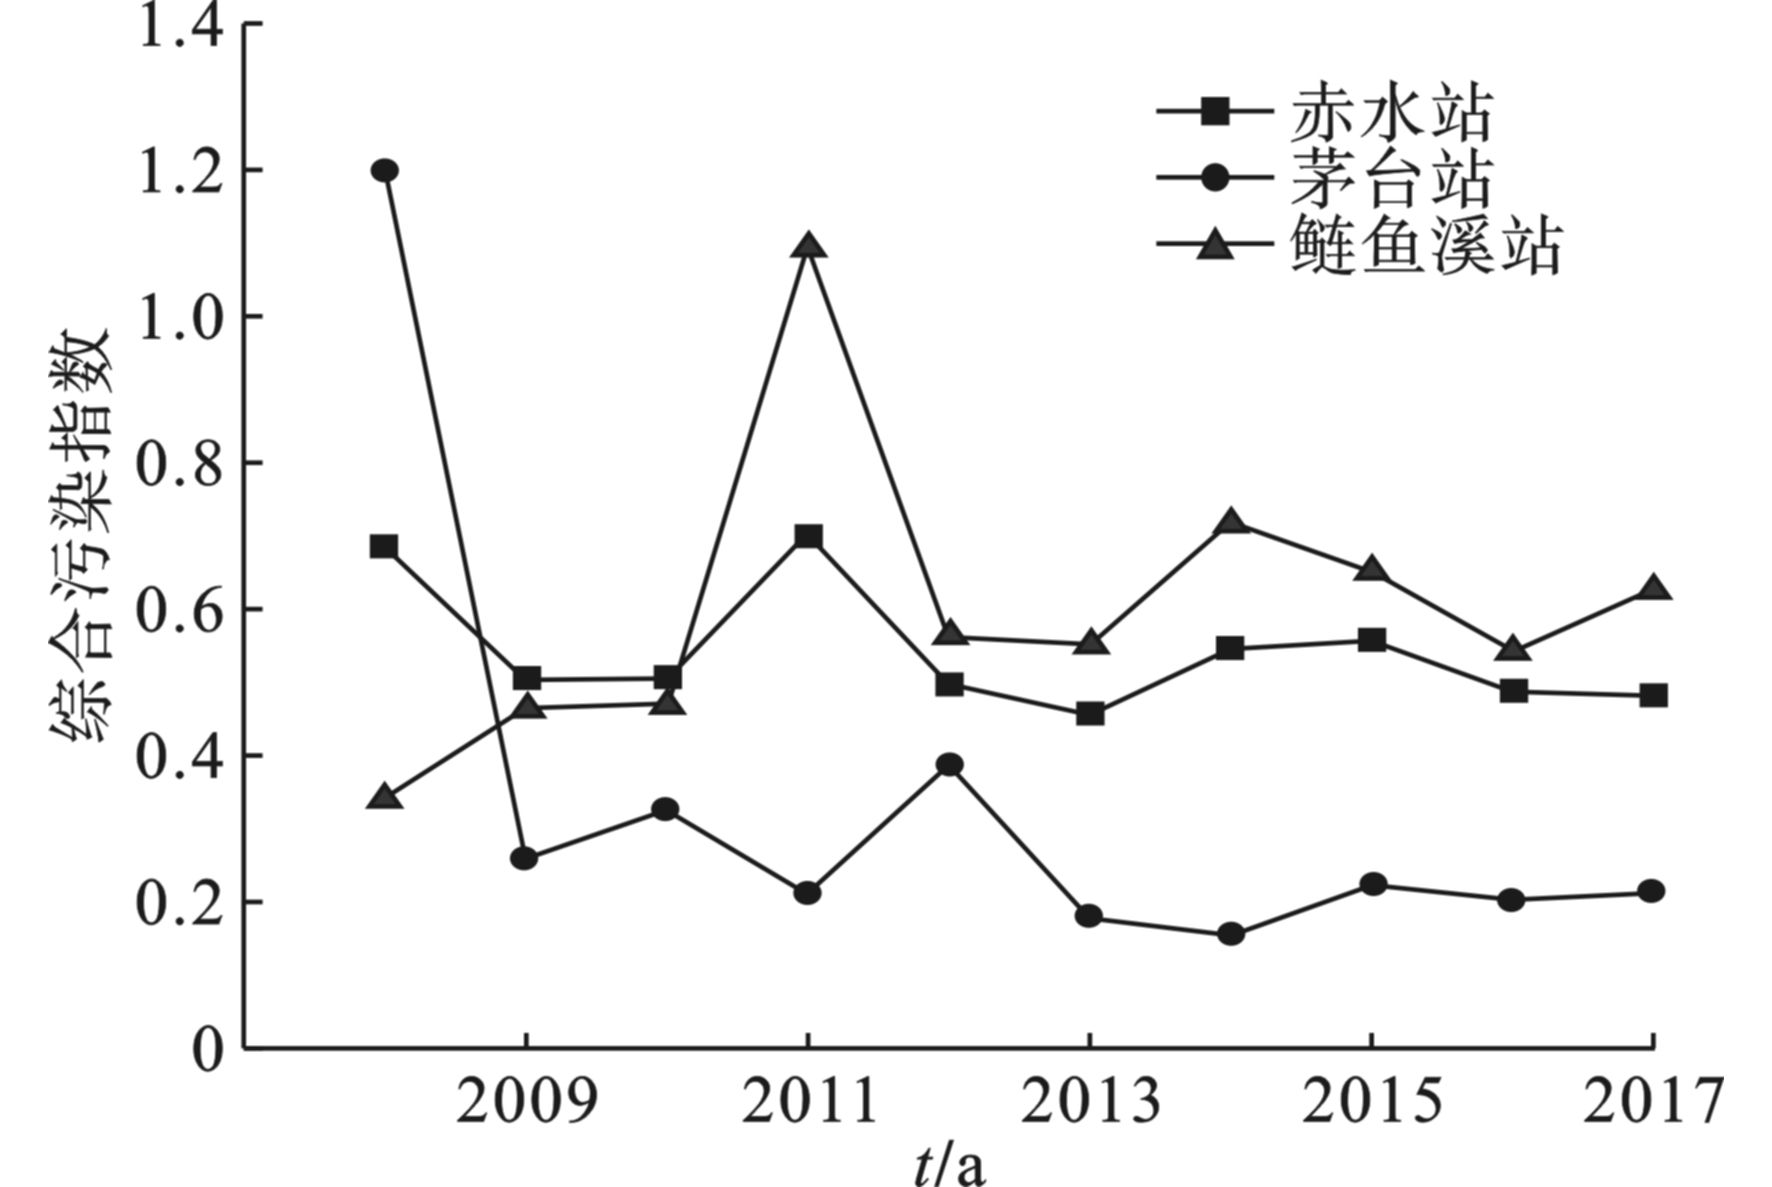
综合污染指数结果显示,见图4。3个断面水质综合污染指数整体介于0.20~1.20之间,波动显著,相互之间变化趋势分异也较为显著。其中,2008~2011年,赤水站水质先变好再变差;茅台站由2008年峰值1.20剧烈下调,而至鲢鱼溪站水质呈持续恶化趋势,至2011年综合污染指数达到峰值1.09,远高于其他年份。说明此期间茅台站至鲢鱼溪站河段污染排放量较大,集中造成了干流水质变差。2012年以后流域水质综合指数呈现稳定态势,在恶化过程中出现好转,可能得益于《贵州省赤水河流域保护条例》的出台,滥排放得到整治,水质状况明显改善[7]。
总体来看,2008~2017年间,上、中、下游水质污染指数变化较大,中游和下游变化趋势较为相似。2008~2011年干流水质污染指数经历剧烈变化后趋于平稳,但中游和下游的CODMn和NH3-N污染指数2012年后又出现大幅度波动。表明随着中游和下游白酒工业及其城镇化快速发展,污染负荷加重,导致水质在好转过程中会逆变。
(2)突变检验分析。利用Mann-Kendall检验进一步验证代表断面3个检测指标的变化趋势,并确定其突变年份,检验结果,见表1。
表1可知,各断面水质指标变化趋势基本与污染指数变化分析结果一致, 2011和2015年茅台站、鲢鱼溪站NH3-N、TP均发生突变,也是年际变化中的值峰点;再次表明中游和下游水质污染超标风险比较大,应予高度关注。
-
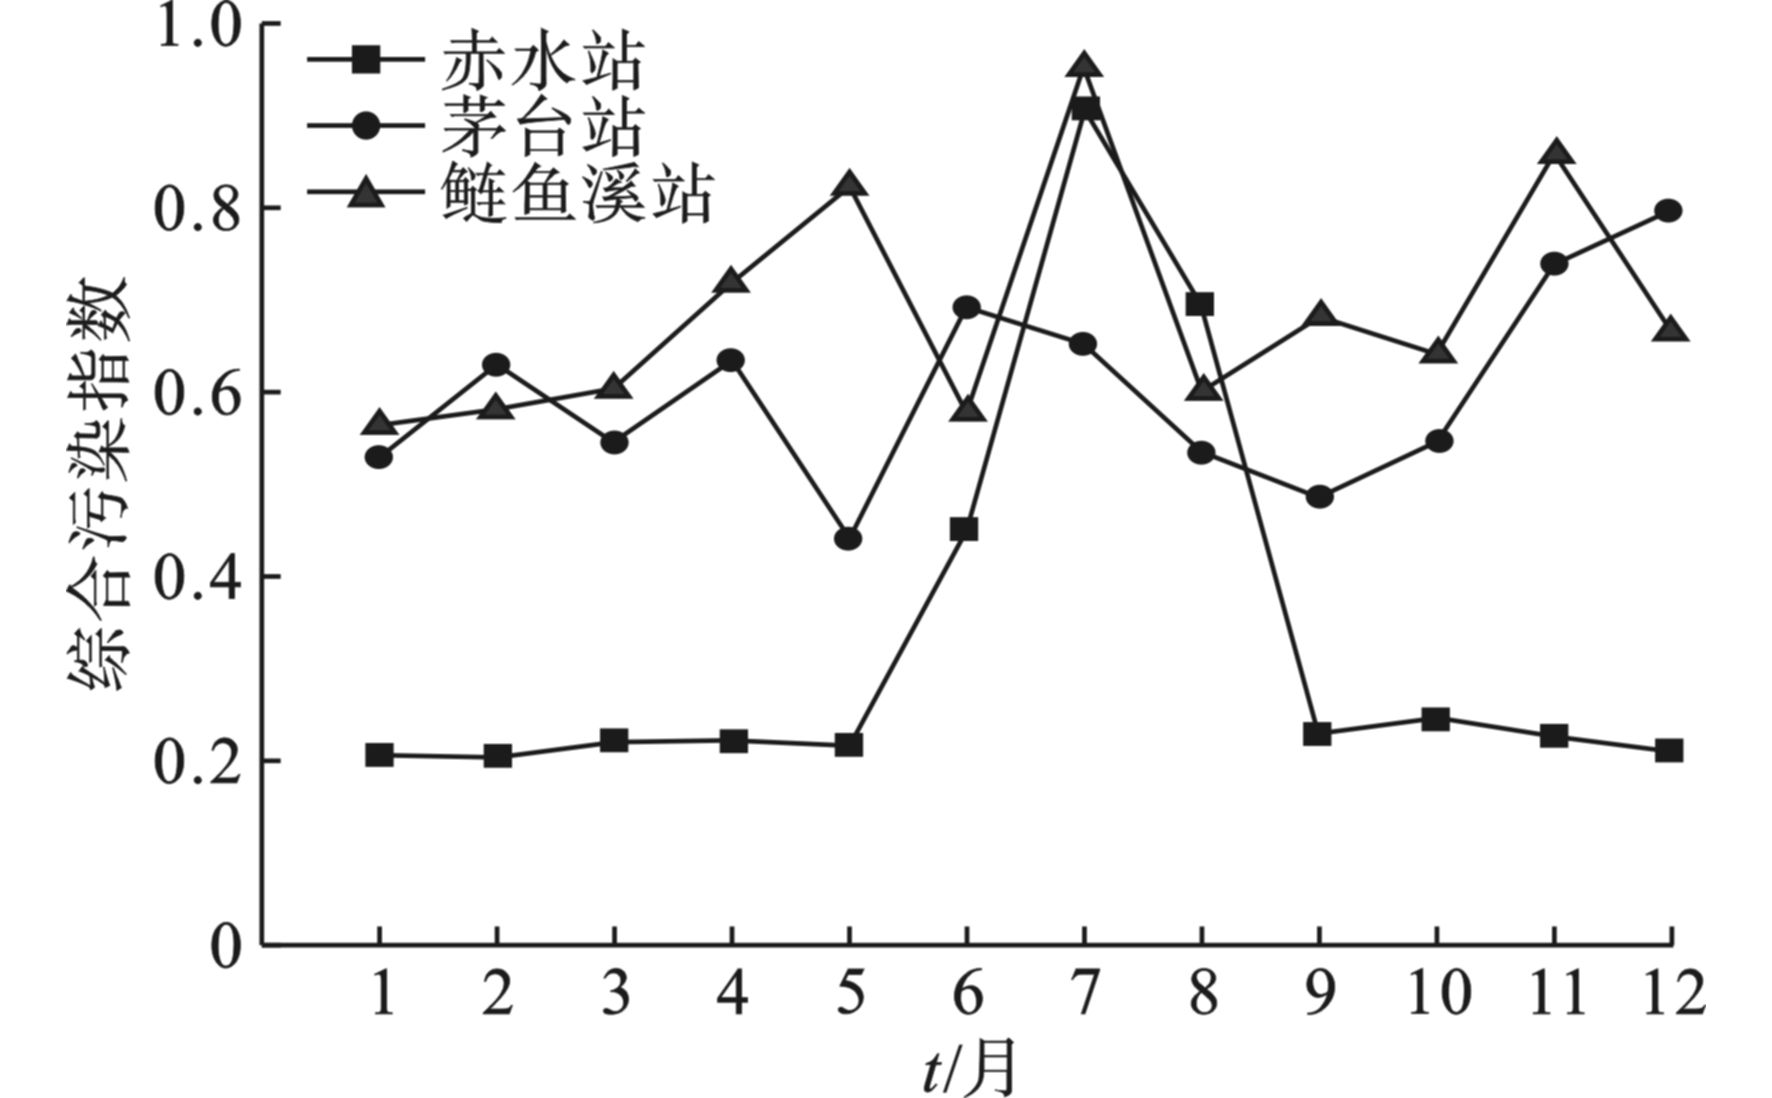
水质综合污染指数年内变化情况,见图5。
图5可知,各断面污染指数年内变化显著。其中,赤水站年内变化幅度最大,从0.20~0.91,7月污染指数最大;茅台站4、6和10~12月月污染指数较大,其他月份污染指数波动幅度大,6月达到较高值0.69,后污染指数下降至10月开始大幅上升,在12月出现最大值0.80。鲢鱼溪站水质在5、7和11月污染指数较大,最大污染指数出现在7月,为0.95。总体而言,流域年内以7月水质最差,11月至次年3月水质较好。
-
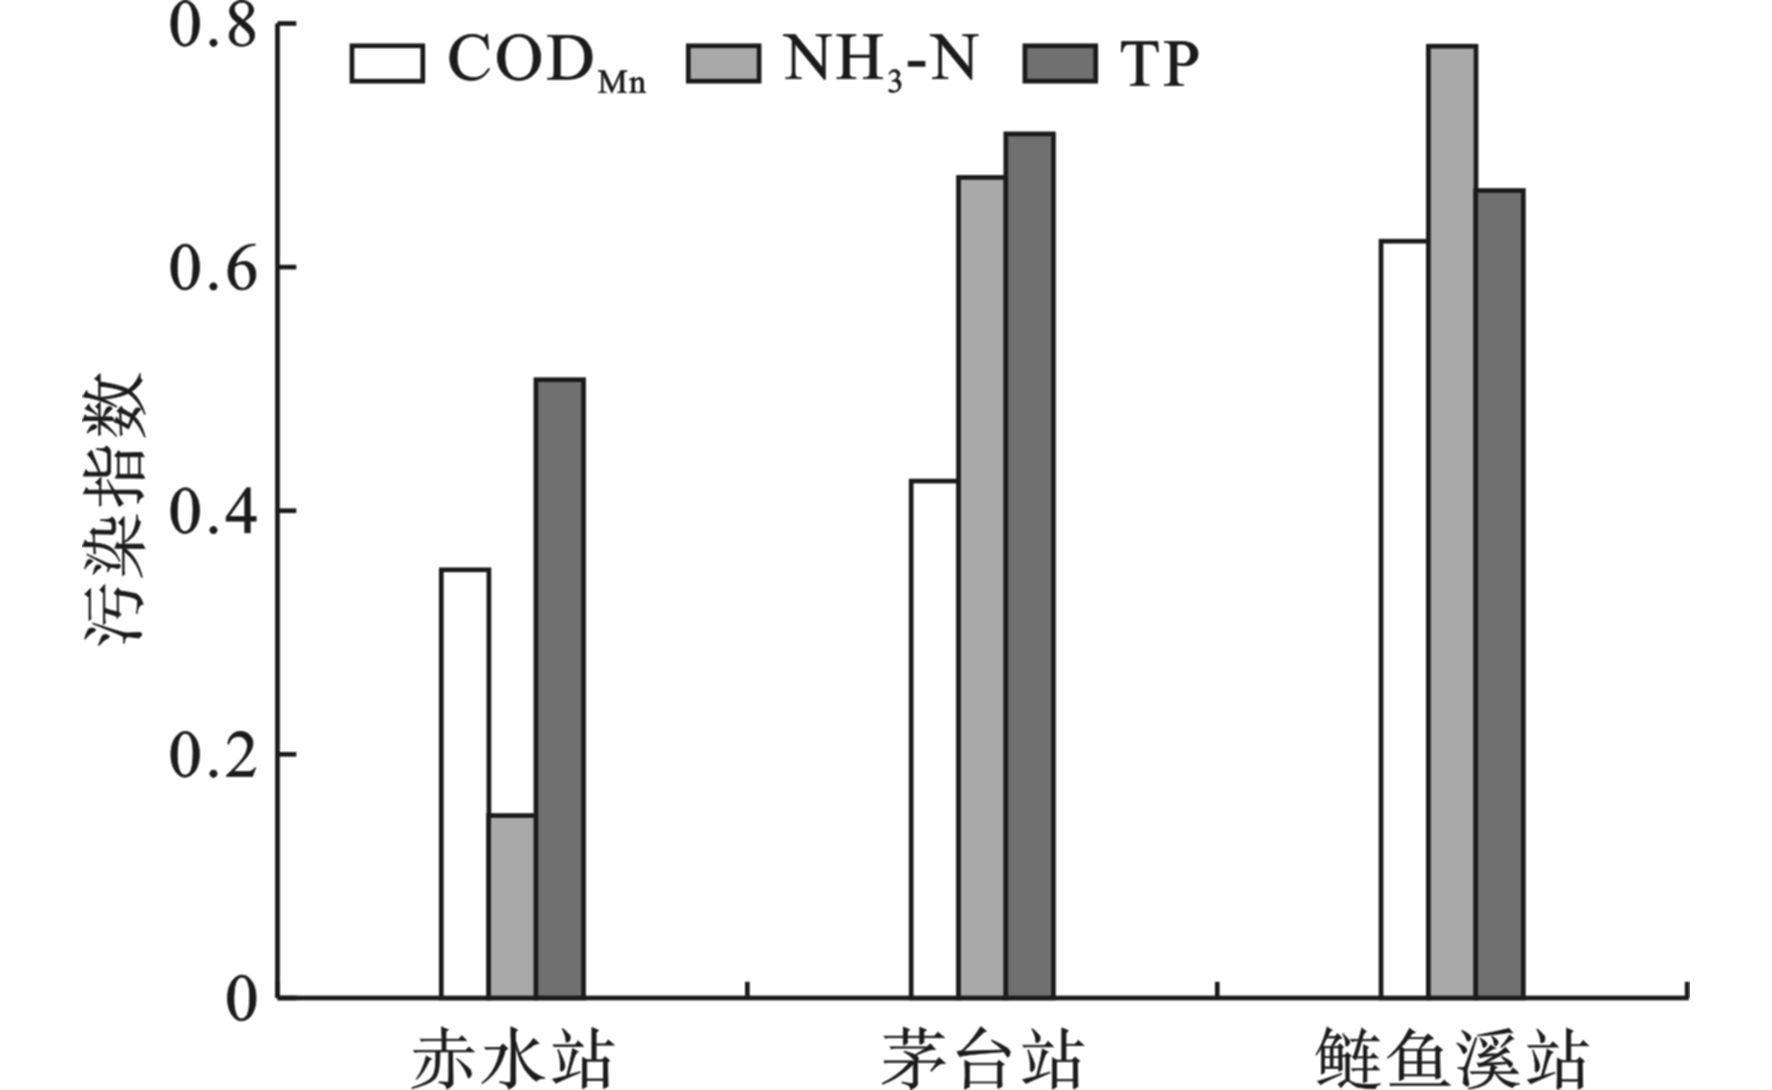
水质指标污染指数沿程变化情况,见图6。
图6可知,CODMn污染指数沿程变化较为显著,从上游至下游呈增大趋势,在下游污染指数达到最大0.62,说明流域范围越大其受人类活动带来的污染负荷越大。NH3-N污染指数变化幅度最大,变化范围为0.15~0.78,也是沿程上升趋势,其中至茅台站后大幅上升,与其白酒工业在此开始高度密集相关[8]。TP污染指数沿程变化从上游至下游呈先增大后减小的趋势,但污染负荷也增加。
综上,赤水河干流水质沿程逐渐变差,至中游主要污染因子为NH3-N和TP,且CODMn开始影响水质,至下游CODMn已成为主要污染因子。
-
为进一步分析影响赤水河流域水质变化的污染物来源,基于水质演变特征,结合流域周围社会经济发展因子(城镇人口、农村人口、白酒产量、粮食种植和牲畜养殖)与水质监测指标年浓度均值,通过Pearson相关系数判断不同因子之间的相关性及其强弱程度,并对结果进行评价和检验,以初步研究赤水河流域污染物主要来源,有利于针对性进行流域污染防治。具体相关系数结果,见表2。
水质指标CODMn污染源相关性结果显示,除位于中游的茅台站断面外,常驻人口与CODMn年浓度呈现显著正相关性,上游赤水站断面中与农村人口相关系数达0.76,下游鲢鱼溪站断面中与城镇人口相关系数达0.41,说明上游水质污染与农村地域差异大、村寨分散和生活污水管理水平低下有关,而下游因城镇化程度高、生活污水排放密集,对水质污染影响较大。NH3-N解析结果表明,与赤水站相关系数最高的是粮食种植面积,白酒产量、城镇人口对中游断面茅台站NH3-N影响最大,相关系数分别达到0.83和0.61,均表现出高度正相关性;其中,白酒生产为主导的轻工业在中游地区发展迅猛,且由于其每年10月“下沙”期的取水主要依赖于赤水河,造成干流中游断面径流量减少,工业污水及废弃物增多,污染负荷加大[9],这也与茅台站NH3-N污染指数逐年升高并且年内变化突变的特征相符。同时,下游断面也受到酒类企业、城镇发展与农业生产影响。通过分析TP年浓度相关性结果可知,农村人口对流域水质影响主要集中在上游断面,相关系数为0.68;而中游、下游污染负荷主要来源于农业生产中粮食种植所产生的大量化肥、农药残留和规模化养殖产生的大量排泄物、废弃物。
综上,农村生活污水是赤水河上游污染物的主要来源,主要呈现在CODMn和TP;中游起水质主要受到工业废水和城镇污水影响,体现于CODMn和NH3-N上。
-
为落实及推进赤水河流域的水污染防治,基于综合污染指数法与污染物朔源评价结果对污染物来源进行详细分析。赤水河流域主要超标污染物为CODMn、NH3-N和TP等,污染源有生活污水、工业废水等,根据污染源的排放情况将其分为点源污染和非点源污染。
(1)点源污染。赤水河流域的点源污染主要为白酒工业和城镇生活污水。按照流域不同区域污水、废水排放情况分析,流域上游主要受生活污染源影响,由于上游以较为分散的农村村镇为主,其生活污水相邻点源距离跨度大,范围广,污染物复杂,且村庄缺乏完善的污水收集处理系统,极大地影响了赤水河流域水体环境质量。而中游、下游城镇化进程加快,人口密度增大,白酒工业经济迅猛发展,城镇生活污水、生活垃圾、工业废水和工业固体废弃物等污染源成为影响流域水质的重要因素。
(2)非点源污染。赤水河流域内除白酒工业集中区外,多以农业生产为主[10],农业生产中大量使用的化肥、农药等有害物质,大部分都仍然残留在土壤及水分中。除此之外,秸秆农膜等固体废弃物、畜禽养殖粪便污水,都会通过地表径流、土壤侵蚀和农田排水等形式进入赤水河,且可能因长期使用产生了累积,导致造成的面源污染具有分散性、随机性和累积性等特点,污染治理难度大。
-
(1)2008~2017年赤水河干流以Ⅰ类、Ⅱ类水质为主,水质年际和年内变化都较显著。2008~2011年整体持续变差,2012年起开始进入相对平稳好转期,但也有逆变发生;7月污染指数最高,水质最差;11月至次年3月污染指数低,水质较好。
(2)赤水河干流水质沿程逐渐变差。上游水质优良,茅台站起受白酒工业影响,NH3-N污染指数大幅上升,CODMn污染指数也升高;至下游,CODMn、NH3-N污染指数持续升高,水质受到城镇生活、白酒工业双重影响。
(3)上游断面CODMn、TP污染负荷与农村人口呈显著正相关,表明点源污染是其主要污染源;同时,农业面源污染源对水质影响也较大。至中游,NH3-N、TP年浓度与白酒产量、城镇人口相关系数最高,成为其主要污染源。至下游水质压力来自城镇化、白酒工业和农业面源等多方面。
赤水河流域水质演变特征及污染源识别
Water quality evolution characteristics and pollution source identification in Chishui River Basin
-
摘要: 为了解赤水河流域水污染及时空变化状况,基于2008~2017年干流上、中、下游3个长期监测断面逐月水质数据,采用单因子评价法、综合污染指数法、Mann-Kendall检验法和Person相关系数法对其水质的时空演变特征及其主要污染源进行了分析。结果表明, 2008~2017年赤水河上、中、下游水质以Ⅰ类和Ⅱ类为主,水质综合污染指数波动较剧烈,其中2008~2011年整体水质持续恶化,2012年进入相对平稳好转期,但时有再逆变情况。7月综合污染指数最高,11月至次年3月水质状况较好。水质沿程逐渐变差,至中游(茅台站)受白酒工业和城镇化影响,NH3-N污染指数大幅上升,CODMn污染指数也升高;到下游,CODMn和NH3-N污染指数持续升高。不同流域尺度下水质的主要污染源存在异同,白酒工业和城镇化对水环境影响显著。Abstract: In order to understand the water pollution situation and its temporal and spatial variation of Chishui River Basin, based on the monthly monitoring water quality data of the downstream, midstream and upstream hydrological station from 2008 to 2017, the spatiotemporal characteristics and main pollution sources of water quality in Chishui River Basin were analyzed. Single factor evaluation method, comprehensive pollution index method, Mann Kendall test method and person correlation coefficient method were used. The results showed that from 2008 to 2017, the water quality in the upper, middle and lower reaches of the Chishui River was mainly class I and II, and the comprehensive pollution index of water quality fluctuated violently. The overall water quality continued to deteriorate in 2008~2011 and entered into a relatively stable improvement period in 2012. However, the water quality got worse sometimes. The comprehensive pollution index was the highest in July, and the water quality was good from November to March of the next year. Water quality was gradually deteriorated along the way. The middle reaches (Moutai station), influenced by the liquor-making industry and urbanization, the NH3-N pollution index increased significantly, and the CODMn pollution index also increased. For the lower reaches, CODMn and NH3-N pollution indexes continued to rise. There were similarities and differences among the main pollution sources in different watershed scales, but the influences of the liquor-making industry and urbanization on the water environment were significant.
-

-
表 1 监测指标Mann-Kendall检验结果
监测断面 监测指标 检验统计量 突变年份/a 变化趋势 赤水站 CODMn −4.12*** 2011 下降 NH3-N 0.19 \ 上升 TP −4.23*** 2008 下降 茅台站 CODMn −1.54* 2016 下降 NH3-N 4.81*** 2011、2015 上升 TP 1.52* 2011 上升 鲢鱼溪站 CODMn 1.33* 2016 上升 NH3-N 3.33*** 2015 上升 TP −0.57 2009、2011 下降 注:*表示通过90%显著性水平检验,***表示通过99%显著性水平检验。 表 2 Pearson相关系数结果表
监测断面 监测指标 城镇人口 农村人口 白酒产量 粮食种植面积 畜禽养殖 赤水站 CODMn −0.65** 0.76** −0.62 −0.55 −0.55 NH3-N −0.11 0.02 −0.08 0.53 −0.11 TP −0.55 0.68** −0.52 −0.44 −0.44 茅台站 CODMn −0.13 0.17 −0.38 −0.41 −0.53 NH3-N 0.61 −0.65** 0.83*** −0.10 0.02 TP −0.02 −0.13 −0.13 0.82*** 0.07 鲢鱼溪站 CODMn 0.41* −0.34 0.14 −0.56 −0.60 NH3-N 0.13 −0.11 0.38* 0.28 0.14 TP −0.25 0.04 −0.38 0.26 0.17 注:*通过95%显著性水平检验,***通过99%显著性水平检验。 -
[1] 任晓冬, 黄明杰. 赤水河流域产业状况与综合流域管理策略[J]. 长江流域资源与环境, 2009, 18(2): 97 − 103. doi: 10.3969/j.issn.1004-8227.2009.02.001 [2] 安艳玲, 蒋浩, 吴起鑫, 等. 赤水河流域枯水期水环境质量评价研究[J]. 长江流域资源与环境, 2014, 23(10): 1472 − 1478. doi: 10.11870/cjlyzyyhj201410019 [3] 滕智超, 丁爱中, 李亚惠, 等. 赤水河上游水质时空特征分析及其污染源解析[J]. 北京师范大学学报(自然科学版), 2016, 52(3): 322 − 327. [4] 季益虎, 方宏萍, 沈兴鹏, 等. 赤水河茅台段水环境趋势分析[J]. 贵州化工, 2012, 37(5): 37 − 38. doi: 10.3969/j.issn.1008-9411.2012.05.019 [5] 王中, 陈萍, 许昌敏, 等. 赤水河流域下游水质监测及评价[J]. 热带农业科学, 2017, 37(5): 86 − 90. [6] PIRNIA A, GOLSHAN M, DARABI H, et al. Using the Mann–Kendall test and double mass curve method to explore stream flow changes in response to climate and human activities[J]. Journal of Water and Climate Change, 2019, 10(4): 725 − 742. doi: 10.2166/wcc.2018.162 [7] 黄小刚. 赤水河流域酒文化研究进展[J]. 中国酿造, 2019, 38(12): 205 − 207. doi: 10.11882/j.issn.0254-5071.2019.12.041 [8] 张丛林, 王毅, 乔海娟, 等. 酒类企业对赤水河流域水环境的影响[J]. 水资源保护, 2015, 31(4): 62 − 66. doi: 10.3880/j.issn.1004-6933.2015.04.011 [9] 田义超, 白晓永, 黄远林, 等. 基于生态系统服务价值的赤水河流域生态补偿标准核算[J]. 农业机械学报, 2019, 50(11): 312 − 322. doi: 10.6041/j.issn.1000-1298.2019.11.035 [10] 王萌, 周丽丽, 耿润哲. 农业面源污染治理的技术与政策研究进展[J]. 环境与可持续发展, 2020, 45(1): 98 − 103. doi: 10.19758/j.cnki.issn1673-288x.202001098 -


 下载:
下载:
