-
大气颗粒物可通过散射和吸收紫外线等方式对光化学进程进行影响,进而影响臭氧的形成[1]。研究颗粒物光学特性对光化学反应的影响对于理清PM2.5和O3的关系、加强PM2.5和O3的协同控制具有重要意义。20世纪90年代国外率先开展了相关研究。早期的研究主要集中在大气颗粒物对紫外辐射的影响,通常采用一维的辐射传输模型,得出的主要结论是吸收性气溶胶可能会抑制大气光化学反应,而散射性气溶胶能增大光解速率,加快臭氧生成。近年来,随着对太阳辐射和气溶胶光学厚度的地面观测,以上结论被北美、欧洲、巴西、澳大利亚等用观测手段得到了证明[2-5]。国内的相关研究工作主要集中在珠三角和京津冀等地区,如LI et al[6]利用区域多尺度空气质量模型(NAQPMS)通过改变光解速率的方式评估了华北地区大气颗粒物对O3生成的影响。ZHU et al[7]和XU et al[8]使用盒子模型和三维区域化学迁移模型来评估沙尘颗粒对北京对流层光化学反应的影响,研究表明沙尘能降低O3浓度。FENG et al[9]通过分析西北地区一个特大城市夏季O3形成原因,发现高浓度大气颗粒物可以显著降低光解速率,导致O3浓度削减超过50 μg/m3。吕欢等[10]使用TUV模式,探讨了南京吸收型气溶胶对光解系数J[O1D]和J[NO2]日变化及垂直变化的影响,结果表明吸收型气溶胶对J[O1D]和J[NO2]的衰减作用正午时最小,在6:00 和18:00 左右较大,最大分别可达−13.7%和−19.0%。杨豪[11]使用WRF-Chem模式模拟了华北地区4个PM2.5、O3复合污染过程时气溶胶对光解速率的影响,结果表明气溶胶-辐射相互作用使4个污染过程中J[O1D]和J[NO2]分别降低了1.8×10⁻³~2.0×10⁻³ s−1和5.7×10⁻⁶~6.4×10⁻⁶,导致4个过程中O3浓度分别减少18.2、22.1、19.5和24.4 μg/m3。
由于气溶胶组分、形态等存在明显的地域差异,对当地的光化辐射、光解速率和O3浓度等的影响也存在地域差异[12-14],而文献中的研究多采用模式模拟法研究其对光解速率的影响,基于观测的研究相对较少,尤其是长时段、高精度的光解速率观测数据较为缺乏。模式模拟由于其自身的局限性无法完全模拟实际情况,需要由较长的观测数据进行验证,而这方面的研究相对较少,且研究多集中于京津冀、长三角、珠三角等地区,现阶段沈阳市相关方面的研究还相对薄弱,本文基于2018年11月—2021年10月3年的高精度太阳光度计、黑碳仪、浊度仪、光谱仪观测数据对沈阳市气溶胶光学特性进行了系统的分析,并研究不同气溶胶光学特性对于J[O1D]和J[NO2]的影响,以期为沈阳市环境管理部门应对PM2.5、O3复合污染提供思路,为制定精准高效的协同防控措施提供参考。
-
环境空气中的O3采用美国thermo公司生产的model 49i O3分析仪进行测定;环境空气中的PM2.5采用美国thermo公司生产的5030型监测仪进行测定。使用O3校准仪对model 49i O3分析仪进行校准,PM2.5颗粒物监测仪(model 5030 sharp monitor)每周检查纸带和更换滤膜,定期清洗切割头;按时对监测仪进行检漏和校正流量等。
-
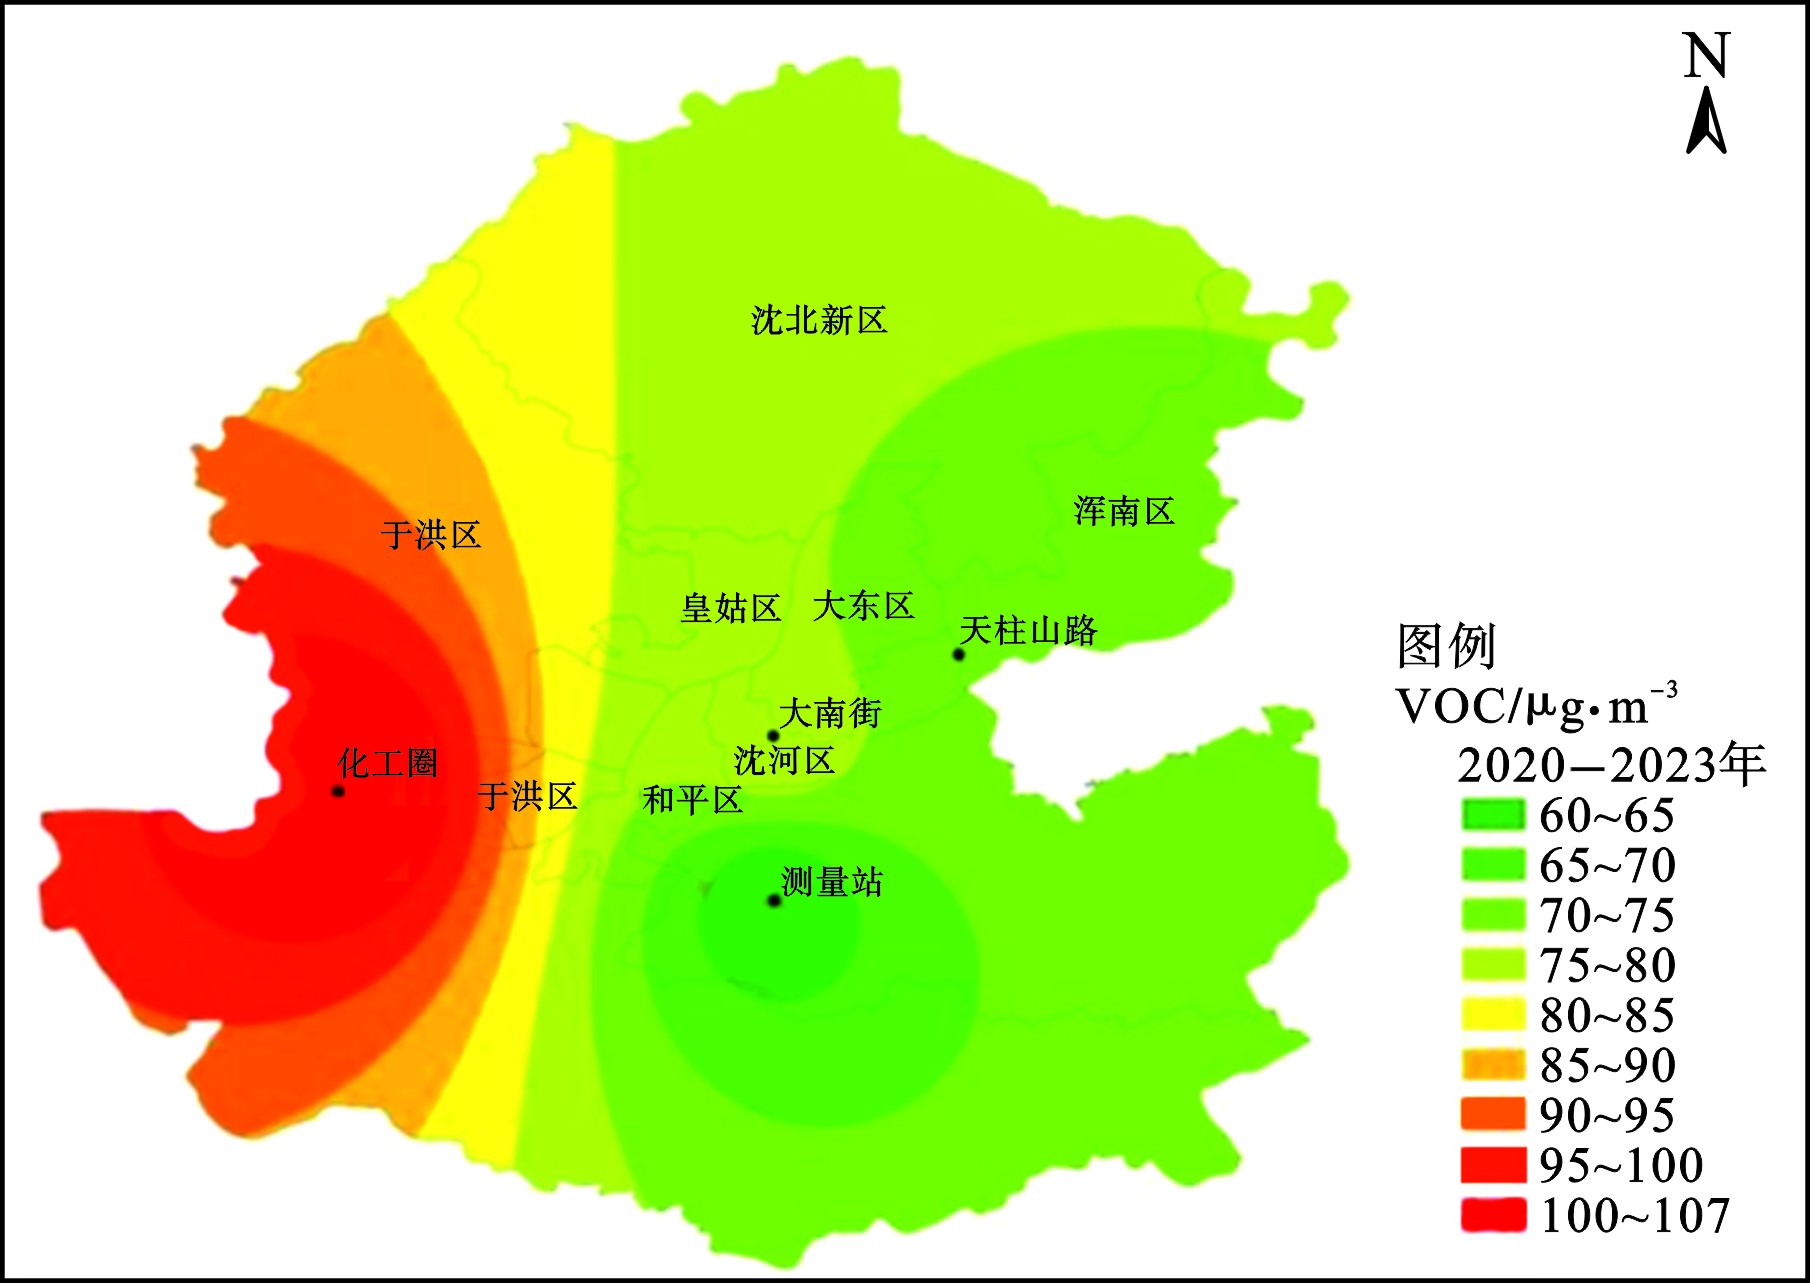
VOCs的测定采用德国AMA公司生产的AMA-GC5000系列臭氧前体物(C2~C12)在线监测系统。该系统主要包括GC5000VOC、GC5000BTX两个分系统组成,分别测量C2~C6范围的低沸点物种和C6~C12范围的高沸点物种。其中两台仪器均采用FID监测器,最多可监测57种VOCs。4个采样点位分别为城市西部的化工园点位,是工业区的典型代表。城市南部的超级站点位,代表文化居民混合区。城市中部的大南街点位,是商业交通居民混合区的代表。城市东北部的天柱山路点位,代表郊区植被区。
-
利用法国CIMEL公司生产的CE318型太阳光度计对大气气溶胶光学厚度进行测量。CE318型太阳光度计在可见光波段共设有8个光谱通道,分别为1 620、1 020、870、670、500、440、380和340 nm,在以上8个波段测量的数据均用来反演气溶胶光学厚度。每6个月对仪器标定一次,定期更换仪器中的滤光片。
-
利用黑碳气溶胶数据来计算气溶胶吸收系数,所获取的黑炭气溶胶数据来自美国玛基科技公司(Magee Scientific Company)生产的AE33型黑碳仪。根据黑碳气溶胶在370、470、520、590、660、880和950 nm波段对光的吸收特性和透射光的衰减程度,获得黑碳气溶胶的浓度。AE33型黑碳仪的测量范围0.01~100 μgBC/m3。检出限(1 h)<0.005 μg/m3。定期对黑碳仪进行维护和常规保养。定期清洗光学采样和分析腔,对流量计进行校准、定期更换滤膜带。
-
利用澳大利亚Ecotech公司生产的Aurora3000浊度仪对气溶胶散射系数进行观测。可同时测量颗粒物在450(蓝)、525(绿)和635 nm(红)3个不同波段上的散射系数。测量范围0~2 000 Mm−1。检出限:总散射和后向散射均为0.3 Mm−1(可选0.1 Mm−1)(1 min平均值)。定期通过零气检测和标准气体检测两种方式对仪器进行检测和校准,仪器进行检测时散射系数仅在相对较小的范围内波动。
-
光解速率的测定采用Metcon公司研制生产的UF-CCD型光谱仪。该光谱仪能够测量280~650 nm波段的太阳光谱,获得相应波段内重要物质的光解速率值(J(O1D)、J(HCHO)、J(NO2)、J(HONO)、J(NO3)、J(H2O2))。光谱测量范围:280~650 nm,光谱分辨率<1.8 nm(FWHM)。
-
单次散射反照率是气溶胶散射系数与吸收系数的比值[14],见式(1):
式中:σext为气溶胶消光系数,Mm−1;λ为波长,nm;σsp为气溶胶散射系数,Mm−1;σap为气溶胶吸收系数,Mm−1。
-
气溶胶的吸收系数[15],见式(2):
式中:MBC为黑碳气溶胶质量浓度,μg/m3;σap为气溶胶吸收系数,Mm−1。
-
大气气溶胶光学厚度与波长指数和大气浑浊度系数(3)之间的关系[16],见式(3):
式中:AOD为气溶胶光学厚度;AE为波长指数;β为大气浑浊度系数;λ表示波长,nm。
波长指数可通过气溶胶厚度(4)计算,见式(4):
常将两个不同波长(λ1=400 nm和λ2=870 nm)的AOD代入式(4)可计算得到波长指数。
-
监测期间沈阳市环境空气中PM2.5平均浓度为41 μg/m3,超过国环境空气质量二级标准0.17倍。其中PM2.5浓度最高的季节是冬季,为64 μg/m3,平均浓度最低的季节是夏季,为22 μg/m3,冬季是夏季的2.91倍。BC的平均浓度为2.38 μg/m3,在季节变化上呈冬季>秋季>春季>夏季的特征。从PM2.5中BC的占比来看,秋、冬季中BC/PM2.5的值较高,春、夏季较低。
-
监测期间沈阳市环境空气中VOCs体积分数分布,见图1。
图1可知,沈阳市环境空气中VOCs体积分数在地理位置上呈现出西高东低的特征,在功能分区上呈现出工业区〉商业交通居民混合区〉郊区植被区〉文化居民混合区。从检出化合物种类上看,城市南部的超级站点位检出种类最多,为VOCs53种,其中烷烃26种,烯烃10种、芳香烃16种及乙炔。中部的大南街点位共检出VOCs48种,其中烷烃29种、烯烃10种、芳香烃8种及乙炔。西部的化工园点位共检出VOCs44种,其中烷烃27种、烯烃、芳香烃各8种及乙炔。
-
监测期间沈阳市气溶胶3个波段的散射系数(σsp)、吸收系数(σap)均随波长的增加呈减少的趋势。分季节对沈阳市气溶胶光学特性进行统计,并与国内其他城市进行对比,见表1。
表1可知,沈阳市气溶胶的σsp、σap均呈冬季>秋季>春季>夏季的特征。这与沈阳市的能源结构、气象条件有关,沈阳市能源结构仍以燃煤为主,秋、冬季采暖燃煤量剧增,导致PM2.5排放量增大。同时沈阳市秋、冬季低压带、高压前弱气压场或均压场、长白山小高压等天气形势出现频率较高,风速小、湿度大,且常伴有逆温,扩散条件相对较差,因此秋、冬季PM2.5、σsp、σap明显高于春夏季。从沈阳市与国内、外其他城市的比较来看,沈阳市气溶胶的σsp低于北京[15]、南京[16];σap高于北京[15]、南京[16]。散射系数、吸收系数均高于泰山[16]。
大气气溶胶单次散射反照率(SSA)为大气气溶胶σsp与大气气溶胶消光系数(气溶胶σap+气溶胶σsp)的比值,其值的大小可表征散射性污染物与吸收性污染物在总消光性物质中的占比。表1为不同PM2.5浓度下大气气溶胶的光学特性。从表1中看出沈阳市4个季节SSA的值在0.76~0.83之间,表明沈阳市大气气溶胶对大气层顶有净正辐射强迫,对大气表现为“升温”效应[19]。其中夏季的SSA的最低,为0.76,秋季最高,为0.83。通常认为纯散射型气溶胶的SSA值为1,可见沈阳市秋季以散射型气溶胶为主,而夏季吸收型气溶胶的占比有所增加。
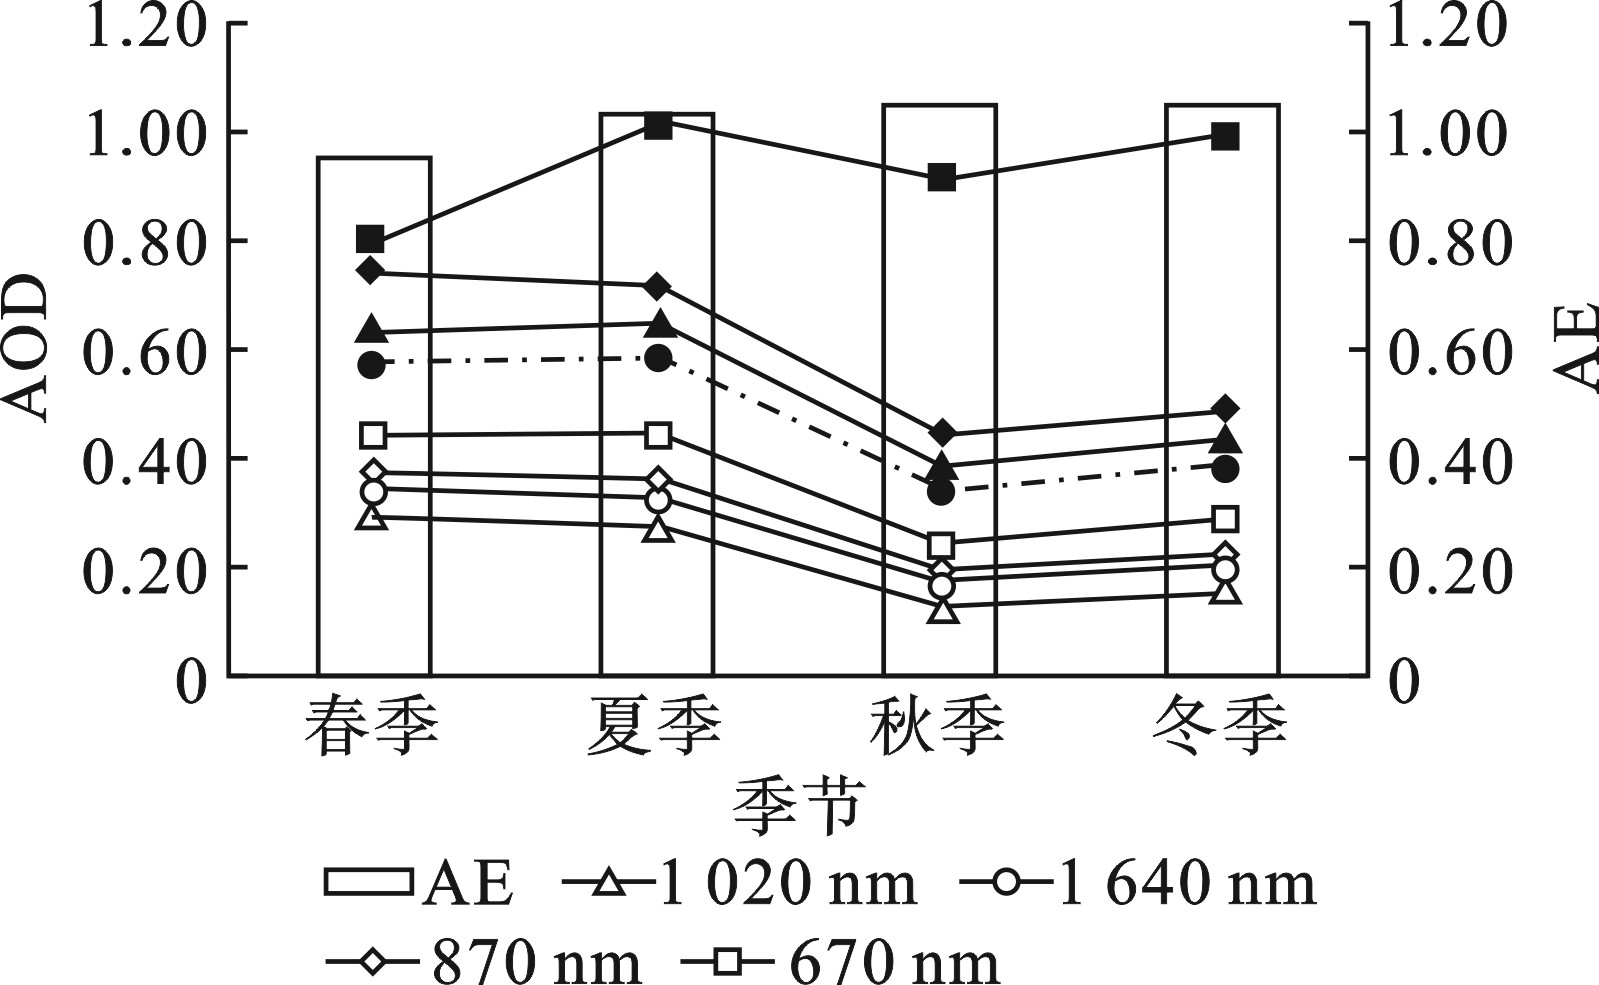
气溶胶光学厚度(aerosol optical depth,AOD)是评价大气污染的一个重要指标,研究表明AOD值越小,表明空气越清洁;AOD值越大,表明空气越浑浊。沈阳市不同季节不同波段AOD及AE值,见图2。
图2可知,各波段AOD值变化趋势较为相似,随波长的增加,AOD呈减小趋势。表明500 nm处的AOD数值能够较好地反映全波段AOD的变化特征[20-22],因此在以下分析时采用500 nm处的数据。沈阳市AOD数值在0.06~3.82之间。4个季节中AOD均值略有不同。春季均值最高,为0.58;秋季最低,为0.34,具体表现为春季>夏季>冬季>秋季。结合沈阳地区的地理位置及气象特征,推测有以下原因:沈阳市属温带大陆性气候,春季沈阳市属温带大陆性气候,春季以干冷空气为主,地面强低压前部、蒙古高压东北低压等天气形势出现频率相对较高,当地面处强低压系统前部时,西南风风速较大,易引起本地扬尘;当地面处东北气旋后部时,西北风风速较大,易受到蒙古国东南部及我国内蒙古西部沙尘传输的影响,出现沙尘传输,因此春季AOD值居四季之首。夏季一方面气温高、湿度大,使得“气-粒”转换作用更易发生,有助于气溶胶粒子的生长。另一方面,降水也较多,对气溶胶粒子有一定的清除作用,因此夏季AOD浓度较高,但低于春季。冬季温度低,逆温、静稳天气频发,扩散条件差,且12和1月是沈阳市气温最低的两个月,采暖燃煤量加大,污染物排放量随之增加,因此冬季AOD值也相对较高。
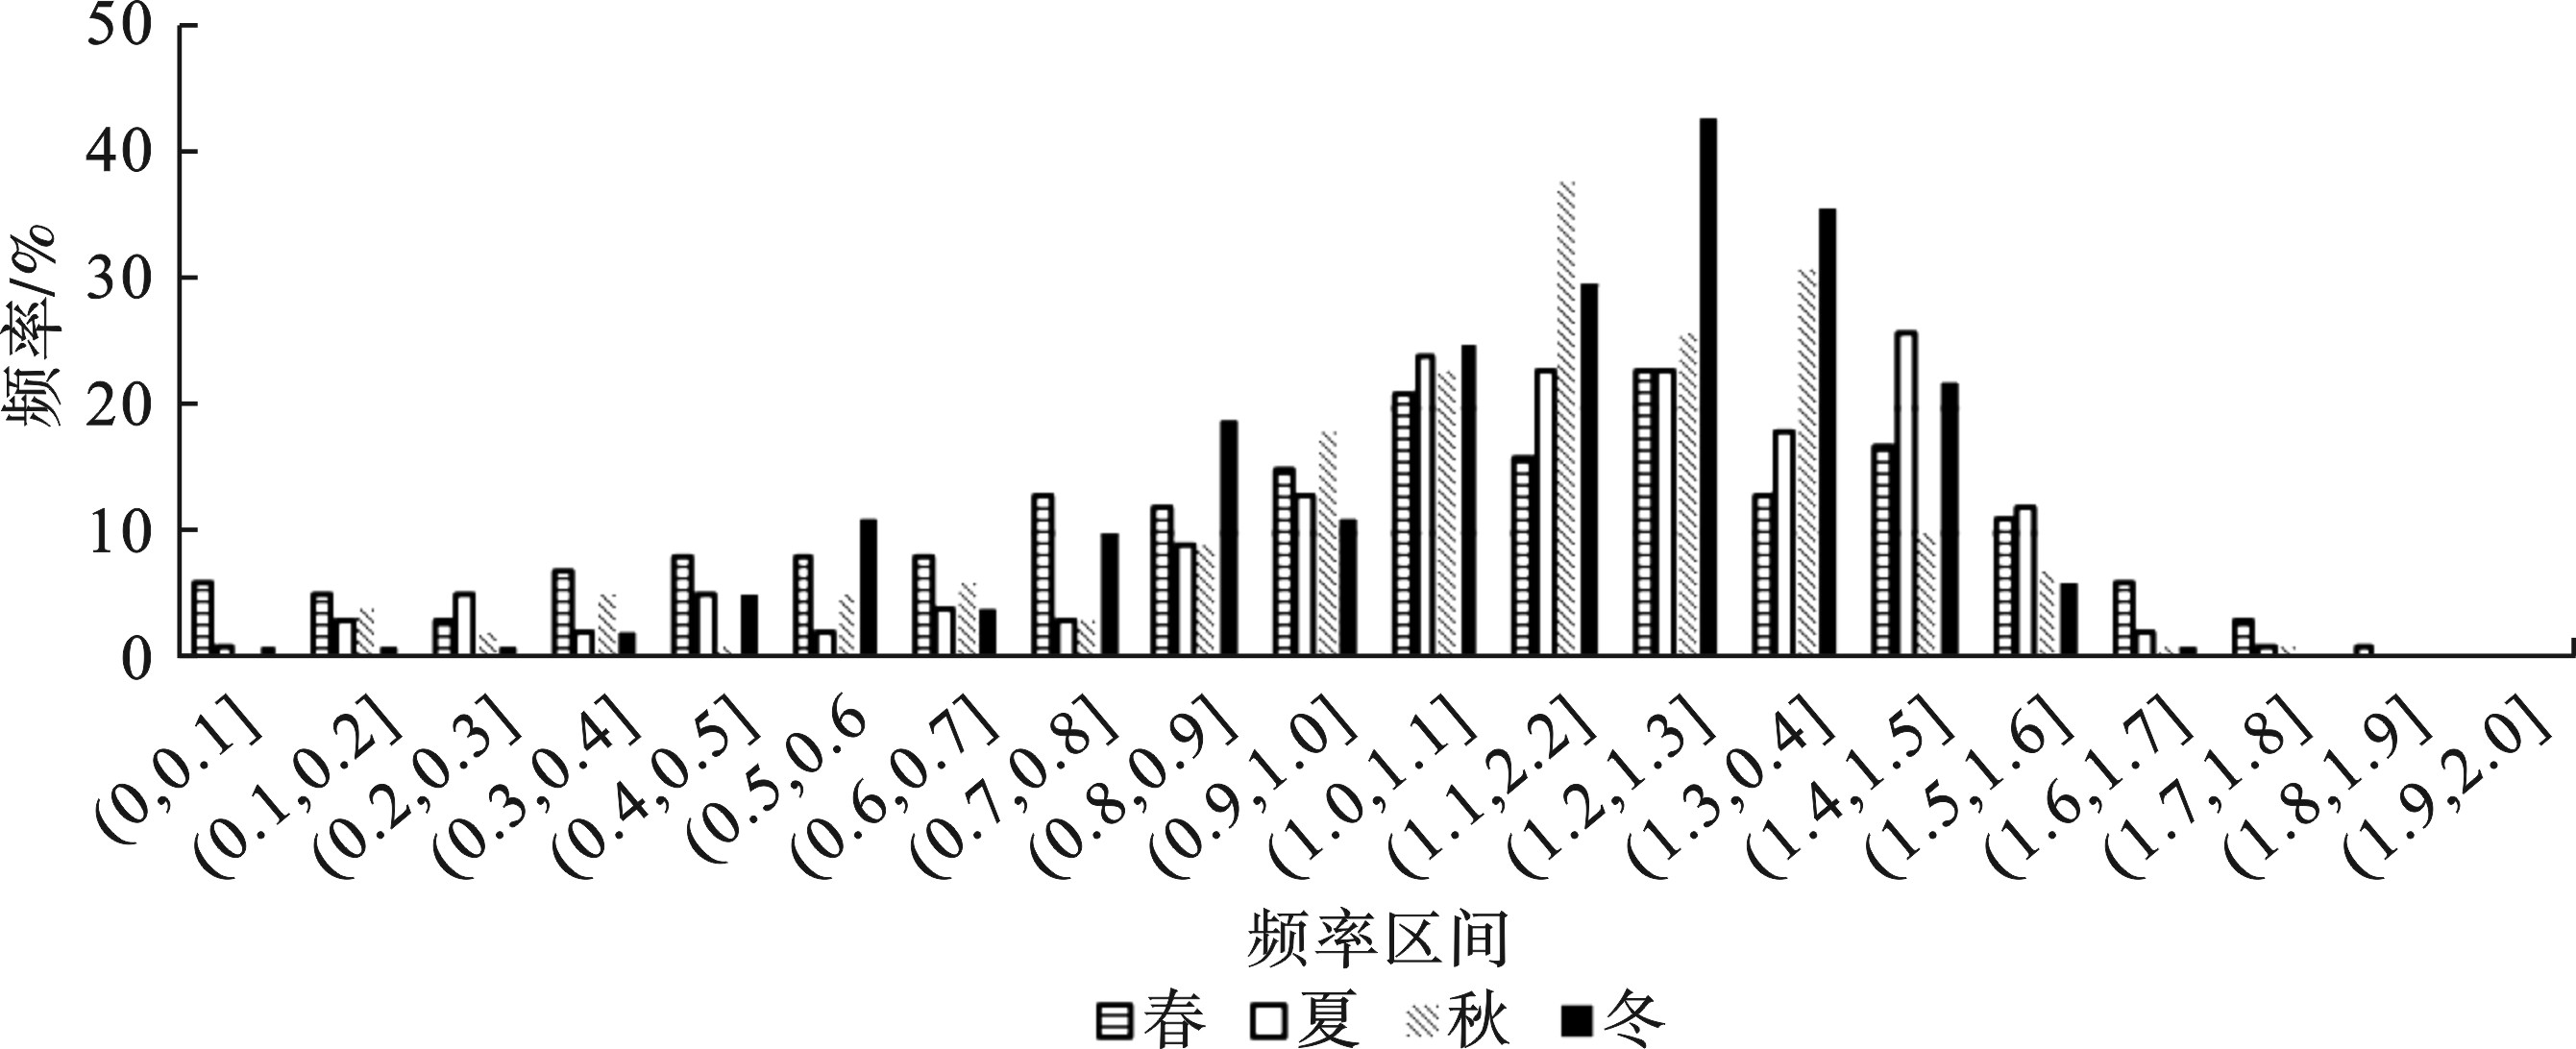
气溶胶波长指数(Angstrom expoent,AE)是衡量气溶胶粒子大小的一个重要光学参数,研究表明AE值越大,表明粒子粒径越小;反之,AE值越小,粒子粒径越大。当AE≥1时,气溶胶以细模态形式存在,AE<1时,气溶胶以粗模态形式存在[23],从图2中可以看出,沈阳市4个季节的AE平均值具有显著不同。其中春季AE的值在0.01至1.85之间,平均值最低,为0.95,夏、秋、冬季较高,AE值区间分别为[0.02,1.68]、[0.11,1.71]、[0.05,1.63],平均值分别为1.04、1.05、1.05。这仍然与沈阳市的气象条件有关。如前所述,沈阳市春季易受本地扬尘及沙尘传输影响,扬尘及沙尘均属大粒径离子,因此春季气溶胶以粗模态形式存在。夏季多雨,经过雨水的冲刷,湿沉降使粗颗粒得以有效清除,因而AE值有所下降。秋、冬季沈阳市多高湿、低风速的静稳天气,利于细模态气溶胶的生成,因而AE值较低。沈阳市秋冬季气溶胶以细模态形式存在,而春季气溶胶以粗、细模态两种形式存在。沈阳市说明沈不同季节AE的分布情况,见图3。
图3可知,4个季节AE频率的变化较明显。春季AE频次出现最高和次高区间分别为(1.2,1.3]和(1.0,1.1],占比分别为11.7%和10.7%。夏季AE频次出现最高和次高的区间分别为(1.4,1.5]和(1.0,1.1],占比分别为14.8%和13.6%。秋季AE频次出现最高和次高的区间分别为(1.1,1.2]和(1.3,1.4],占比分别为20.0%和16.3%。冬季AE频次出现最高和次高的区间分别(1.2,1.3]和(1.3,1.4],占比分别为18.9%和15.8%。可见,夏、秋、冬季AE在1.0以上的频次均大于70.0%,主要集中在(1.0,1.5]之间,其中说明夏、秋、冬季沈阳市气溶胶粒子的主控模态相对稳定,以细模态粒子为主,且人为源产生的污染物粒子对空气质量有明显的影响。春季气溶胶粒子相对较复杂,AE在1.0以上的频次仅为51.6%,粗、细模态粒子均占有一定比例,说明春季污染由粗模态和细模态的气溶胶粒子共同导致。这与沈阳市的地理位置、气候条件及污染源排放有关,沈阳市春季易出现本地扬尘及蒙古国东南部及我国内蒙古西部沙尘传输影响,因此春季粗模态粒子占比增加。秋、冬季经常出现逆温、静稳天气,且燃煤采暖、秸秆焚烧等导致细颗粒物排放量增加,因此秋、冬季气溶胶以细模态形式存在。
-
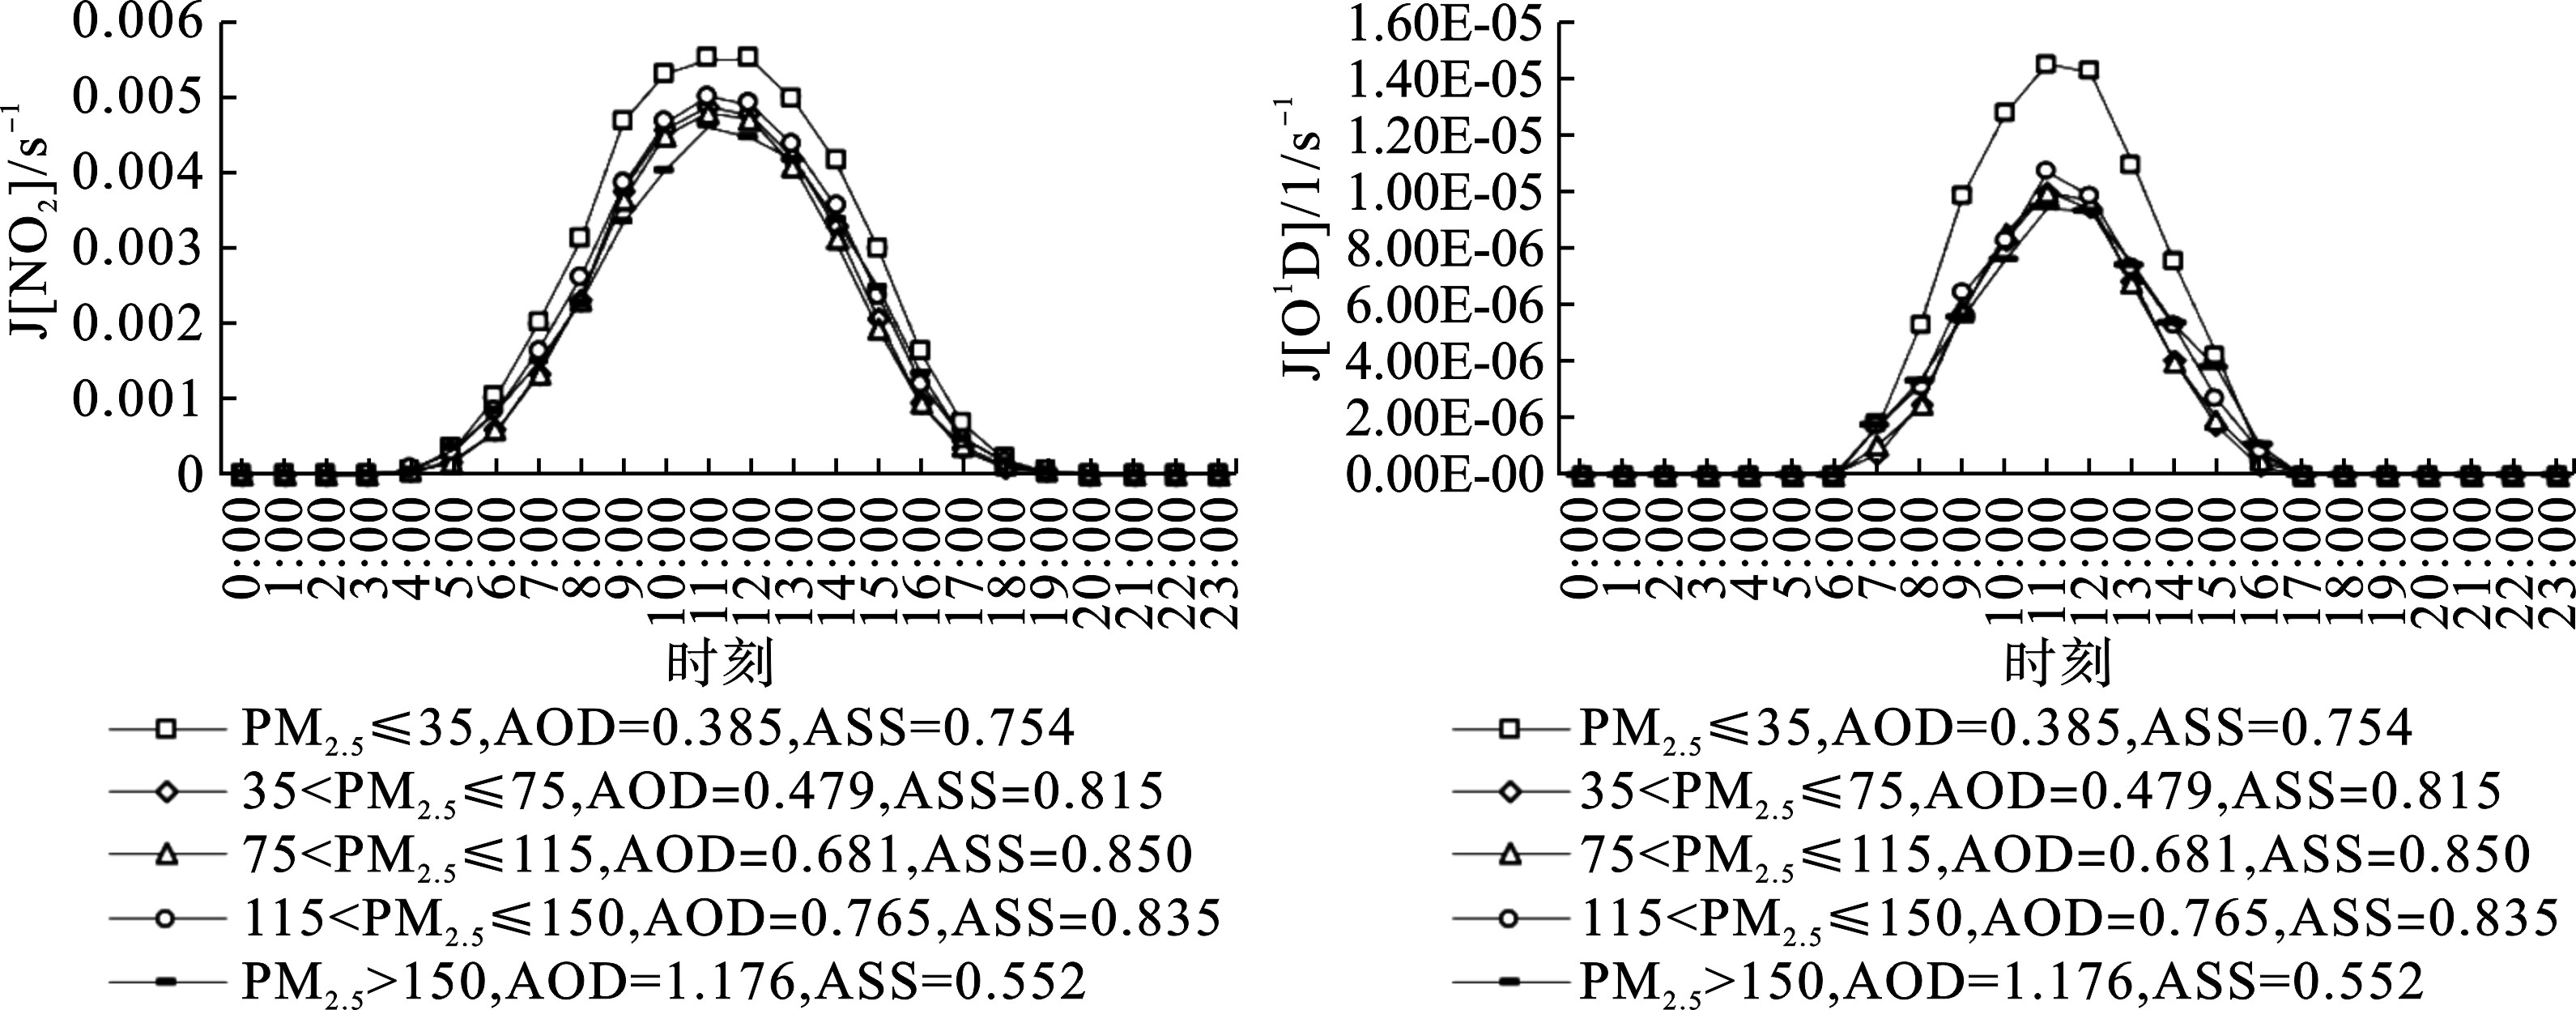
为探讨不同PM2.5浓度对J[NO2]、J[O1D]的影响,统计了不同PM2.5浓度范围内J[NO2]、J[O1D]的日变化曲线,见图4。
图4可知,无论PM2.5浓度处于什么范围,J[NO2]、J[O1D]的日变化曲线均保持一致,都是在夜间最弱,在中午11:00达到峰值。随着PM2.5浓度的增加,J[NO2]、J[O1D]的最大值逐渐降低。当PM2.5>150时,J[NO2]、J[O1D]的最大值分别为0.005 s−1、1.45e−5 s-1,较PM2.5≤35时,分别减少了16.3%和35.3%,对应的AOD和SSA分别增加了0.49和0.37倍。J[O1D]的最大值的相对变化率绝对值明显大于J[NO2],这可能是因为二者光解发生的主要波段不同,O3发生光解的波段在300 nm,NO2发生光解的波段在400 nm附近。中午J[NO2]、J[O1D]的最大值出现的时刻,近地面光化辐射通量比值
$\left( { \dfrac{a{f}_{{\rm{AOD}}=1.5}}{s{f}_{{\rm{AOD}}=0.5}}} \right)$ 的衰减是随波长的增加而不断减小的,因而PM2.5的变化使中午时段J[O1D]的最大值的相对变化率的绝对值更低[24],这与昝雅媛[24]等对北京的研究结果相似。 -
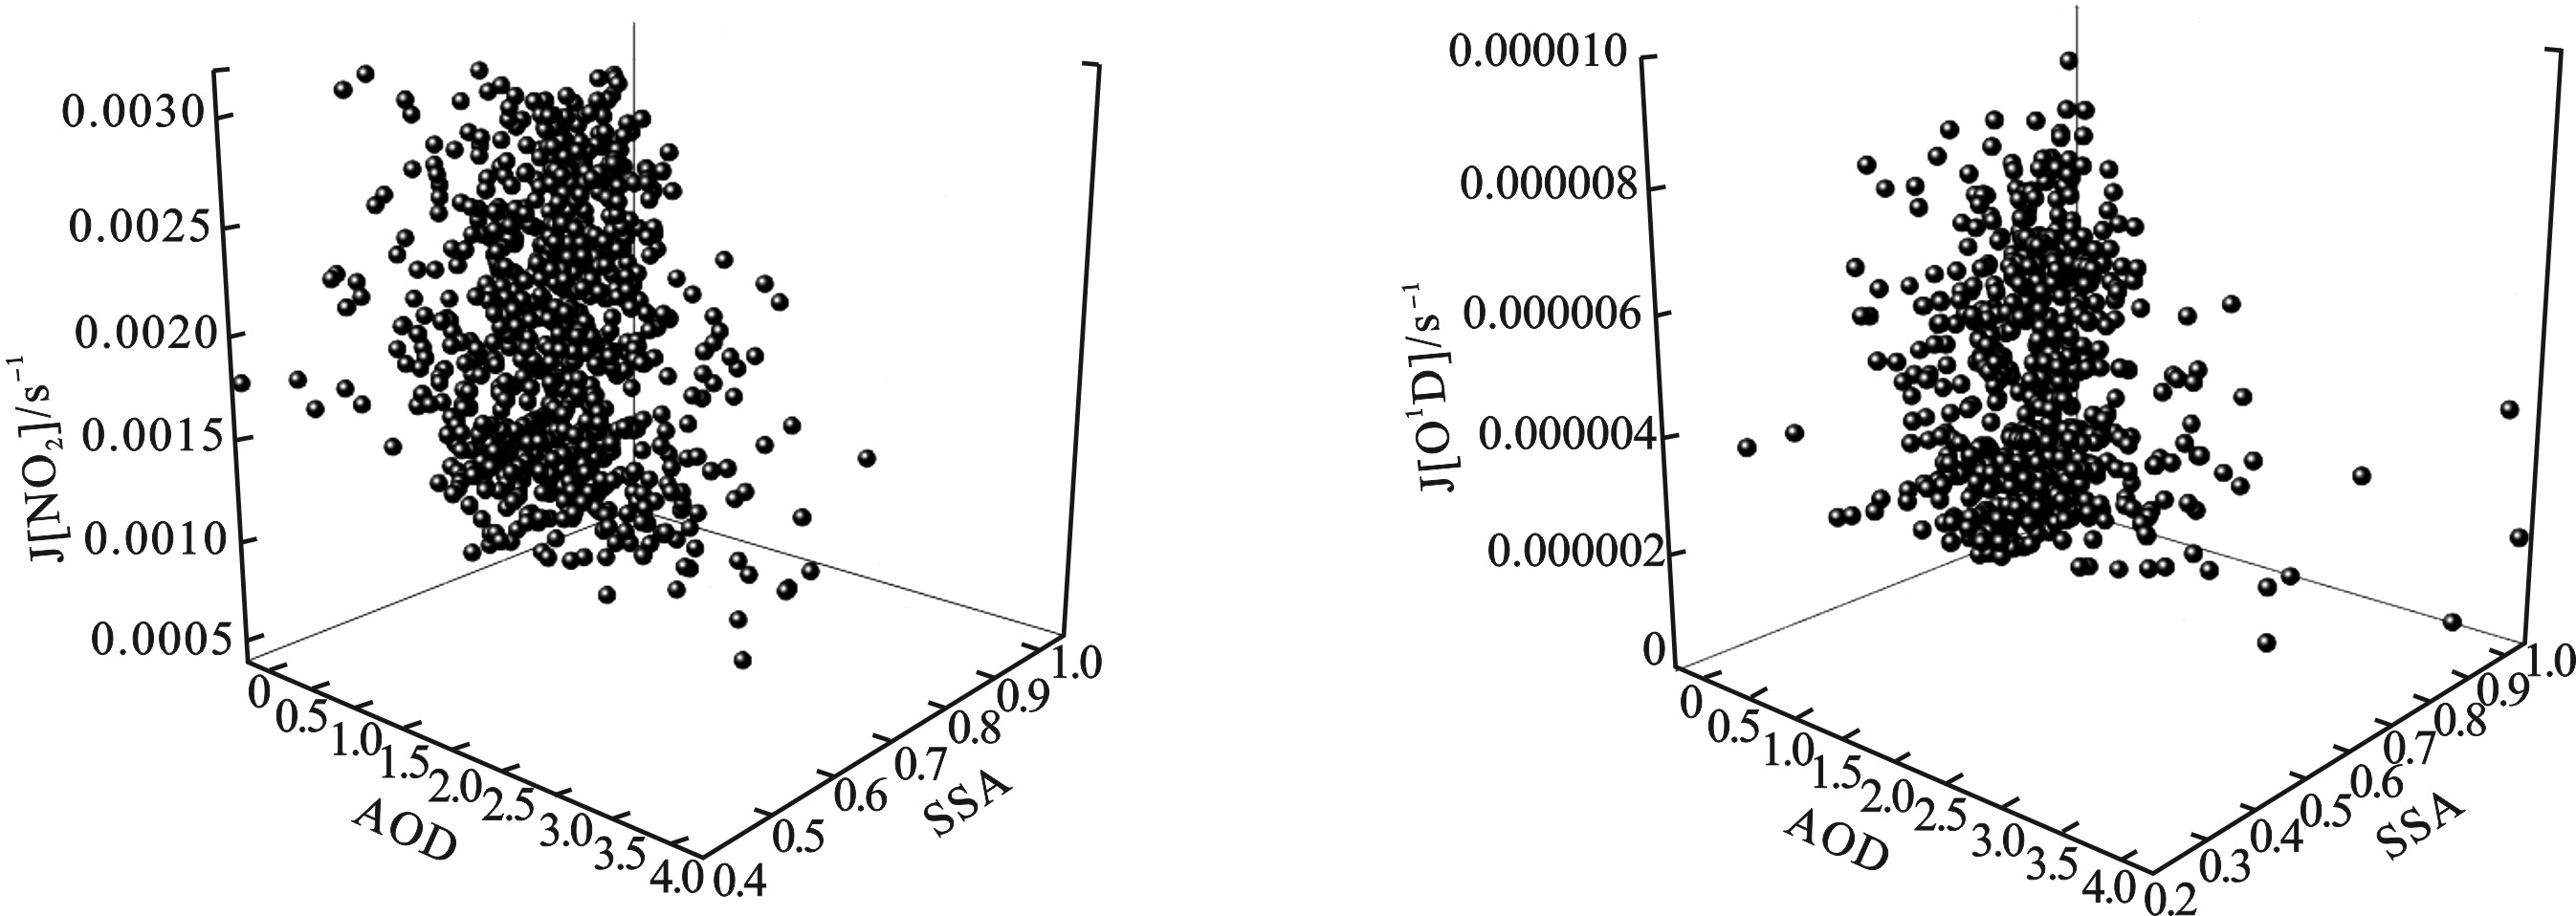
为探讨AOD、SSA对J[NO2]、J[O1D]的影响,绘制了J[NO2]、J[O1D]随AOD、SSA的变化图,并对其进行相关分析,见图5。
图5可知,当SSA一定时,J[NO2]、J[O1D]均随AOD的增加而减小,二者间存在负相关关系。其中SSA≈1.0时(此时气溶胶为强散射型气溶胶),二者的相关性最显著,相关性系数分别为−0.78、−0.64。这与李陵[15]对北京的模拟研究的结论相同。这是因为紫外辐射是对流层光解反应的主导因素,而AOD的增加会直接削弱到达地面的紫外辐射强度,从而降低J[NO2]、J[O1D]的值。当AOD一定时,J[NO2]、可以看出J[O1D]随SSA的增加而增加,但二者相关性不显著。这是因为当AOD一定时,SSA的增加使气溶胶的散射能力明显增强,到达地面的紫外辐射随之增强,增加了有效光化通量,从而使得J[NO2]、J[O1D]增大[24]。
-
沈阳市PM2.5的散射系数、吸收系数均呈冬季>秋季>春季>夏季的特征。秋季以散射型气溶胶为主,而夏季吸收型气溶胶的占比有所增加。
4个季节中夏季的SSA的最低,为0.76,秋季最高,为0.83。秋季以散射型气溶胶为主,而夏季吸收型气溶胶的占比有所增加。
夏、秋、冬季气溶胶粒子以细模态粒子为主,春季气溶胶粒子相对较复杂,AE在1.0以上的频次仅为54.1%,粗、细模态粒子均占有一定比例,说明春季污染由粗模态和细模态的气溶胶粒子共同导致。
当PM2.5>150时,J[NO2]、J[O1D]的最大值分别为0.005 s−1、1.45e−5 s−1,较PM2.5≤35时,分别减少了16.3%和35.3%。
当SSA一定时,J[NO2]、J[O1D]随AOD的增加而减小,二者间存在负相关关系。其中SSA≈1.0时(气溶胶为强散射型气溶胶),二者的相关性最显著。当AOD一定时,J[NO2]、J[O1D]随SSA的增加而增加,但二者相关性不显著。
基于观测的沈阳市气溶胶光学特性对J[NO2]、J[O1D]的影响
Effects of aerosol optical properties on J[NO2] and J[O1D] in Shenyang based on observations
-
摘要: 文章基于2018年11月—2021年10月沈阳市大气复合污染立体监测超级站颗粒物光学特征观测数据、光解光谱仪观测数据及11个国控点位PM2.5及O3浓度数据,分析了沈阳市气溶胶光学特性及其对光化学反应的影响。结果表明,沈阳市PM2.5的散射系数、吸收系数均呈冬季>秋季>春季>夏季的特征。秋季以散射型气溶胶为主,而夏季吸收型气溶胶的占比有所增加。夏、秋、冬季气溶胶粒子以细模态粒子为主;春季污染由粗模态和细模态的粒子共同导致。当PM2.5>150时,J[NO2]、J[O1D]的最大值分别为0.005 s−1、1.45e−5 s−1,较PM2.5≤35时,分别减少了16.3%和35.3%。当SSA一定时,J[NO2]、J[O1D]随AOD的增加而减小,二者间存在负相关关系。其中SSA≈1.0时(气溶胶为强散射型气溶胶),二者的相关性最显著。当AOD一定时,J[NO2]、J[O1D]随SSA的增加而增加,但二者无显著相关性。Abstract: In this paper, the optical characteristics of aerosol and its effect on photochemical reactions in Shenyang were analyzed based on the optical characteristics of particulate matter observed at Shenyang Combined Atmospheric Pollution Monitoring Superstation from November 2018 to October 2021. The optical data of photodecomposition spectrometer and PM2.5 and O3 concentration data at 11 national control sites were also used to anaylze. The results showed that the scattering coefficient and the absorption coefficient of PM2.5 in Shenyang were winter > autumn > spring > summer. Scattering aerosols were dominant in autumn, while absorption aerosols increased in summer. Aerosol particles were mainly fine modal particles in summer, autumn and winter. Spring pollution was caused by both coarse and fine modal particles. When PM2.5>150, the maximum values of J[NO2] and J[O1D] were 0.005 s−1 and 1.45e-5 s−1, respectively, decreasing by 16.3% and 35.3% compared with PM2.5≤35. When SSA was constant, J[NO2] and J[O1D] decreased with the increase of AOD, and there was a negative correlation between them. When SSA≈1.0 (aerosol is strongly scattering aerosol), the correlation between them was most significant. When AOD was constant, J[NO2] and J[O1D] increased with the increase of SSA, but there was no significant correlation between them.
-
Key words:
- observation /
- Aerosol optical properties /
- J[NO2] /
- [O1D] /
- Shenyang
-

-
表 1 观测期间沈阳气溶胶的σsp、σap和SSA与文献报道的对比
Table 1. Comparison of σsp, σap and SSA of aerosols over Shenyang during observation period with literature reports
观测地点 观测时间 σsp/Mm−1 σap/Mm−1 SSA 参考
文献北京 2019.07—2019.08 214±124(525 nm) 17.4±6.9(525 nm) 0.91±0.03(525 nm) [15] 2019.09—2019.10 191±113(525 nm) 22.8±9.0(525 nm) 0.86±0.04(525 nm) 南京 2014.03—2016.02 338±228(550 nm) 29.6±20.5(525 nm) 0.9±0.04(550 nm) [16] 泰山 2014.07—2014.08 141±61(550 nm) 13±4(532 nm) 0.90±0.03(532 nm) [17] 济南 2013.12—2014.05 204±188 43±33 0.80±0.09 [18] 沈阳 2019—2021年春季 221±178(450 nm)
190±163(525 nm)
135±113(635 nm)34±19(450 nm)
30±16(525 nm)
24±14 (635 nm)0.82±0.13(450 nm)
0.81±0.14(525 nm)
0.79±0.15(635 nm)本研究 2019—2021年夏季 166±220(450 nm)
132±163(525 nm)
103±66(635 nm)28±18(450 nm)
24±15(525 nm)
20±13(635 nm)0.75±0.49(450 nm)
0.74±0.49(525 nm)
0.73±0.48(635 nm)2019—2021秋季 177±142(450 nm)
140±99(525 nm)
115±89(635 nm)46±25(450 nm)
39±21(525 nm)
33±18(635 nm)0.76±0.15(450 nm)
0.75±0.11(525 nm)
0.74±0.12(635 nm)2019—2021冬季 293±182(450 nm)
242±150(525 nm)
193±123(635 nm)53±34(450 nm)
46±29(525 nm)
38±24(635 nm)0.83±0.10(450 nm)
0.82±0.10(525 nm)
0.82±0.10(635 nm) -
[1] 蔡彦枫, 王体健, 谢旻, 等. 南京地区大气颗粒物影响近地面臭氧的个例研究[J]. 气候与环境研究, 2013, 18(2): 251 − 260. doi: 10.3878/j.issn.1006-9585.2012.11111 [2] CASTEO T, MADRONICH S, RIVALE S, et al. The influence of aerosols on photochemical smog in Mexico City[J]. Atmospheric Environment, 2001, 35(10): 1765 − 1772. doi: 10.1016/S1352-2310(00)00449-0 [3] ZANIS P, KOURTIDIS K, RAPPENGLUECK B, et al. A case study on the possible link between furface ozone photochemistry and total ozone column during the PAUR II experiment at Crete: Comparison of observations with box model calculations[J]. Journal of Geophysical Research-Atmospheres, 2002, 107(D18): PAU 3-1-PAU 3-13. [4] GAFFNEY J, MARLEY N, DRAYTON P, et al. Field observations of regional and urban impacts on NO2, ozone, UVB, and nitrate radical production rates in the Phoenix air basin[J]. Atmospheric Environment, 2002, 36(5): 825 − 833. doi: 10.1016/S1352-2310(01)00528-3 [5] KALASHNIKOVA O, MILLS F, ELDERING A, et al. Application of satellite and ground-based date to investigate the UV radiative effects of Australian aerosols[J]. Remote Sensing of Environment, 2007, 107(1-2): 65 − 80. doi: 10.1016/j.rse.2006.07.025 [6] LI J, WANG Z, WANG X, et al. Impacts of aerosols on summertime tropospheric photolysis frequencies and photochemistry over Central Eastern China[J]. Atmospheric Environment, 2011, 45: 1817 − 1829. doi: 10.1016/j.atmosenv.2011.01.016 [7] ZHU S, BUTLER T, SANDER R, et al. Impact of dust on tropospheric chemistry overpolluted regions: A case study of the Beijing megacity[J]. Atmospheric Chemistry and Physics, 2010, 10: 3855 − 3873. doi: 10.5194/acp-10-3855-2010 [8] XU J, ZHANG Y, WANG W. Numerical Study on the impacts of heterogeneous reactions on ozone formation in the Beijing urban area[J]. advances in Atmospheric Sciences, 2006, 23: 605 − 614. doi: 10.1007/s00376-006-0605-1 [9] FENG T, BEI N, HUANG R, et al. Summertime ozone formation in Xi’an and surrounding areas, China[J]. Atmospheric Chemistry and Physics Discuss, 2015, 15: 30563 − 30608. [10] 吕欢, 安俊琳, 苏筱倩, 等. 南京北郊地区黑碳气溶胶对光解系数的影响[J]. 中国环境科学, 2020, 40(4): 1421 − 1428. doi: 10.3969/j.issn.1000-6923.2020.04.004 [11] 杨豪. 气溶胶-辐射相互作用对中国东部臭氧浓度影响的数值模拟研究[D]. 南京: 南京信息工程大学, 2022 [12] JONSON J, KYLLING A, BERNTSEN T, et al. Chemical effects of UV fluctuations inferred from total ozone and tropospheric aerosol variations[J]. Journal of Geophysical Research:Atmospheres, 2000, 105(D11): 14561 − 14574. doi: 10.1029/1999JD901130 [13] REAL E and SARTELET K. Modeling of photolysis rates over Europe: impact on chemical gaseous species and aerosols[J]Atmospheric Chemistry and Physics, 2011, 11(4): 1711-1727. [14] 赵帝, 卞思思, 王帅, 等. 沈阳市分季节环境空气PM2.5组分特征分析与来源解析[J]. 环境保护科学, 2021, 47(2): 128 − 135. [15] 李陵. 北京市近年大气颗粒物和近地面臭氧的相互影响研究[D]. 北京: 中国环境科学研究院, 2020. [16] ZHANG B, WANG T, LIU J, et, al. The surface aerosol optical properties in the urban area of Nanjing, West Yangtze River Delta, China[J]. Atmospheric Chemistry and Physics, 2017, 17(2): 1143 − 1160. doi: 10.5194/acp-17-1143-2017 [17] 张婉, 杨凌霄, 张雄飞, 等. 山东农村和背景地区雾霾天与清洁天气溶胶光学特性[J]. 山东大学学报(工学版), 2020, 50(2): 1 − 8. [18] YAN W, YANG L, CHEN J, et al. Aerosol optical properties at urban and coastal sites in Shandong province, Northern China[J]. Atmospheric Research, 2017, 188: 39 − 47. doi: 10.1016/j.atmosres.2016.12.011 [19] 许天峰, 马焉, 郑军, 等. 2019年秋季南京北郊气溶胶光学特性研究[J]. 环境科学学报, 2021, 41(11): 4353 − 4365. doi: 10.13671/j.hjkxxb.2021.0198 [20] 吴兑, 毛节泰, 邓雪娇, 等. 珠江三角洲黑碳气溶胶及其辐射特性的观测研究[J]. 中国科学:地球科学, 2009, 11: 1542 − 1553. [21] 王贺, 曹念文, 王鹏, 等. 南京地区大气气溶胶综合观测与对比分析[J]. 遥感学报, 2017, 21(1): 125 − 135. doi: 10.11834/jrs.20175328 [22] 吴立新, 吕鑫, 秦凯, 等. 基于太阳光度计地基观测的徐州气溶胶光学特性变化分析[J]. 科学通报, 2016, 61(20): 2287 − 2298. [23] 郑玉蓉, 王旭红, 张秀, 等. 基于Landsat数据的关中盆地腹地AOD时空格局及城市化对其影响[J]. 环境科学, 2021, 42(6): 2699 − 2712. doi: 10.13227/j.hjkx.202010018 [24] 昝雅媛, 马晓燕, 田蓉. 基于TUV模式的对流层光解速率影响因子的研究[J]. 中国环境科学, 2019, 39(9): 3707 − 3718. doi: 10.3969/j.issn.1000-6923.2019.09.014 -


 下载:
下载:
