-
近年来,随着我国大气污染防治工作的逐步推进,全国范围内环境空气质量总体改善。与2017年相比,2018年我国大部分城市的PM2.5、PM10、NO、COx和SO2等污染物浓度和超标天数均下降,而O3浓度和超标天数比例均增加,臭氧污染问题逐渐凸显[1]。VOCs可以和氮氧化物发生光化学反应形成光化学烟雾,也可与大气环境中的氢氧自由基、硝酸自由基、臭氧等氧化剂发生多途径反应,生成二次有机气溶胶,对环境空气中的臭氧和PM2.5有重要影响,直接或间接的影响着人体健康和环境空气质量[2-3]。基于PM2.5和O3污染的协同调控已成为我国在大气污染防治方面亟需解决的关键问题,从VOCs污染特征着手直接分析其对臭氧生成与影响的研究十分必要。
目前,国内已开展了大量关于VOCs的浓度水平、污染特征、化学反应活性和污染物来源等研究,如北京[4-5]、上海[6]、南京[7]、天津[8]、郑州[9]、合肥[10]等地。安庆市位于长江中下游北岸,是安徽省西南部重要的工业城市。随着安庆市经济的快速发展,能源消耗持续上升,大气污染问题频发。据安庆市环境质量公报显示,2018年安庆市环境空气质量优良率只有77%,首要污染物以O3和PM2.5为主,分别占144 d和116 d。VOCs是臭氧和二次有机气溶胶产生的重要前体物,但目前尚未见到研究安庆市大气中VOCs的相关报道。
本研究于2019年5月对安庆市城区大气VOCs开展了为期1周的定点离线观测,分析VOCs的浓度水平和组分特征,估算VOCs的化学反应活性,筛选出VOCs关键活性组分,以期为安庆市大气污染防控提供科学支撑。
安庆市城区春季挥发性有机物组成特征及大气反应活性
Composition characteristics and atmospheric reactivity of volatile organic compounds in Anqing City in spring
-
摘要:
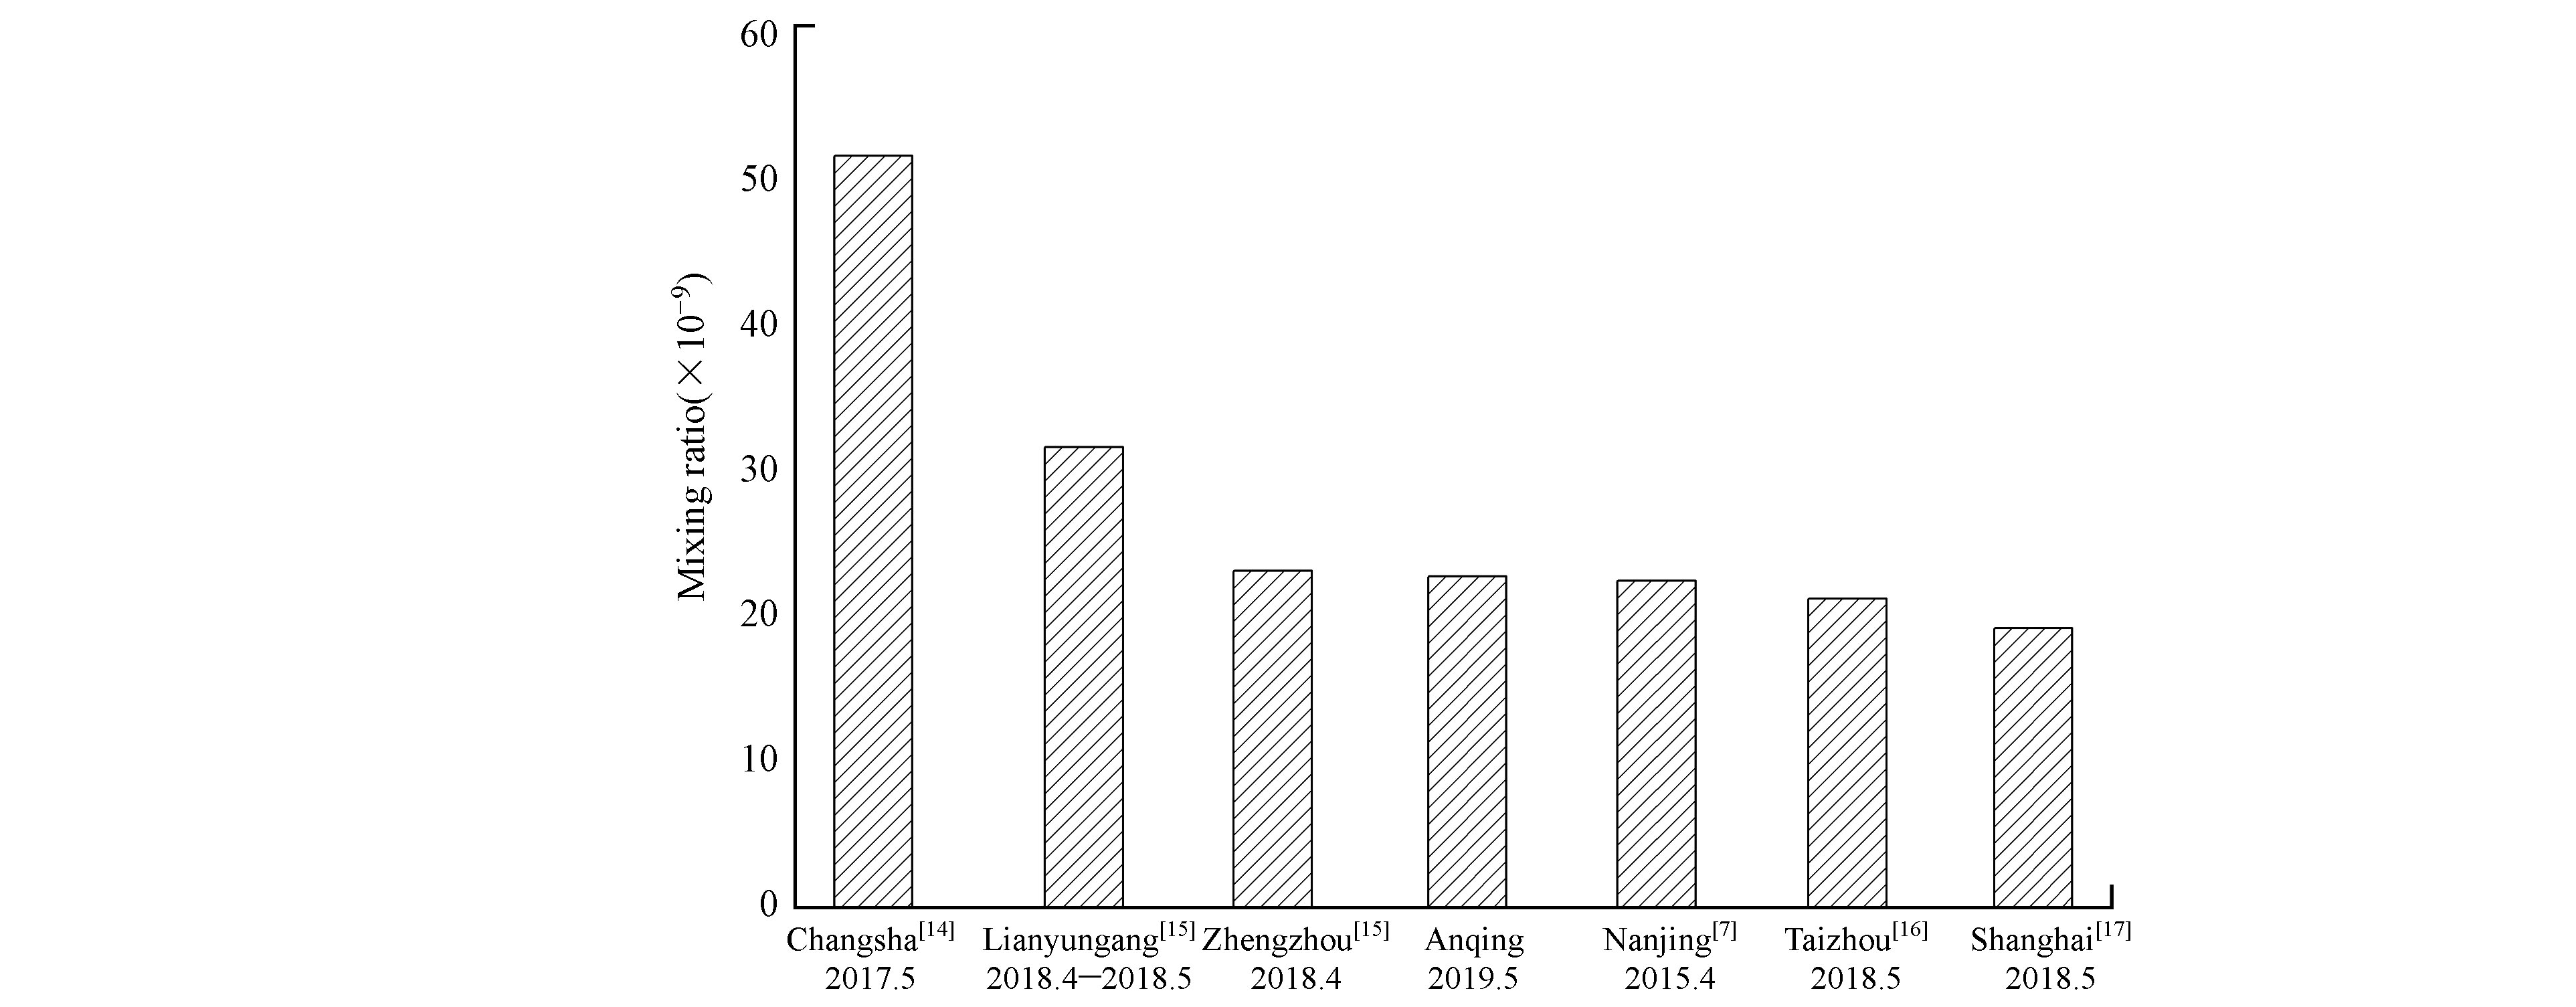
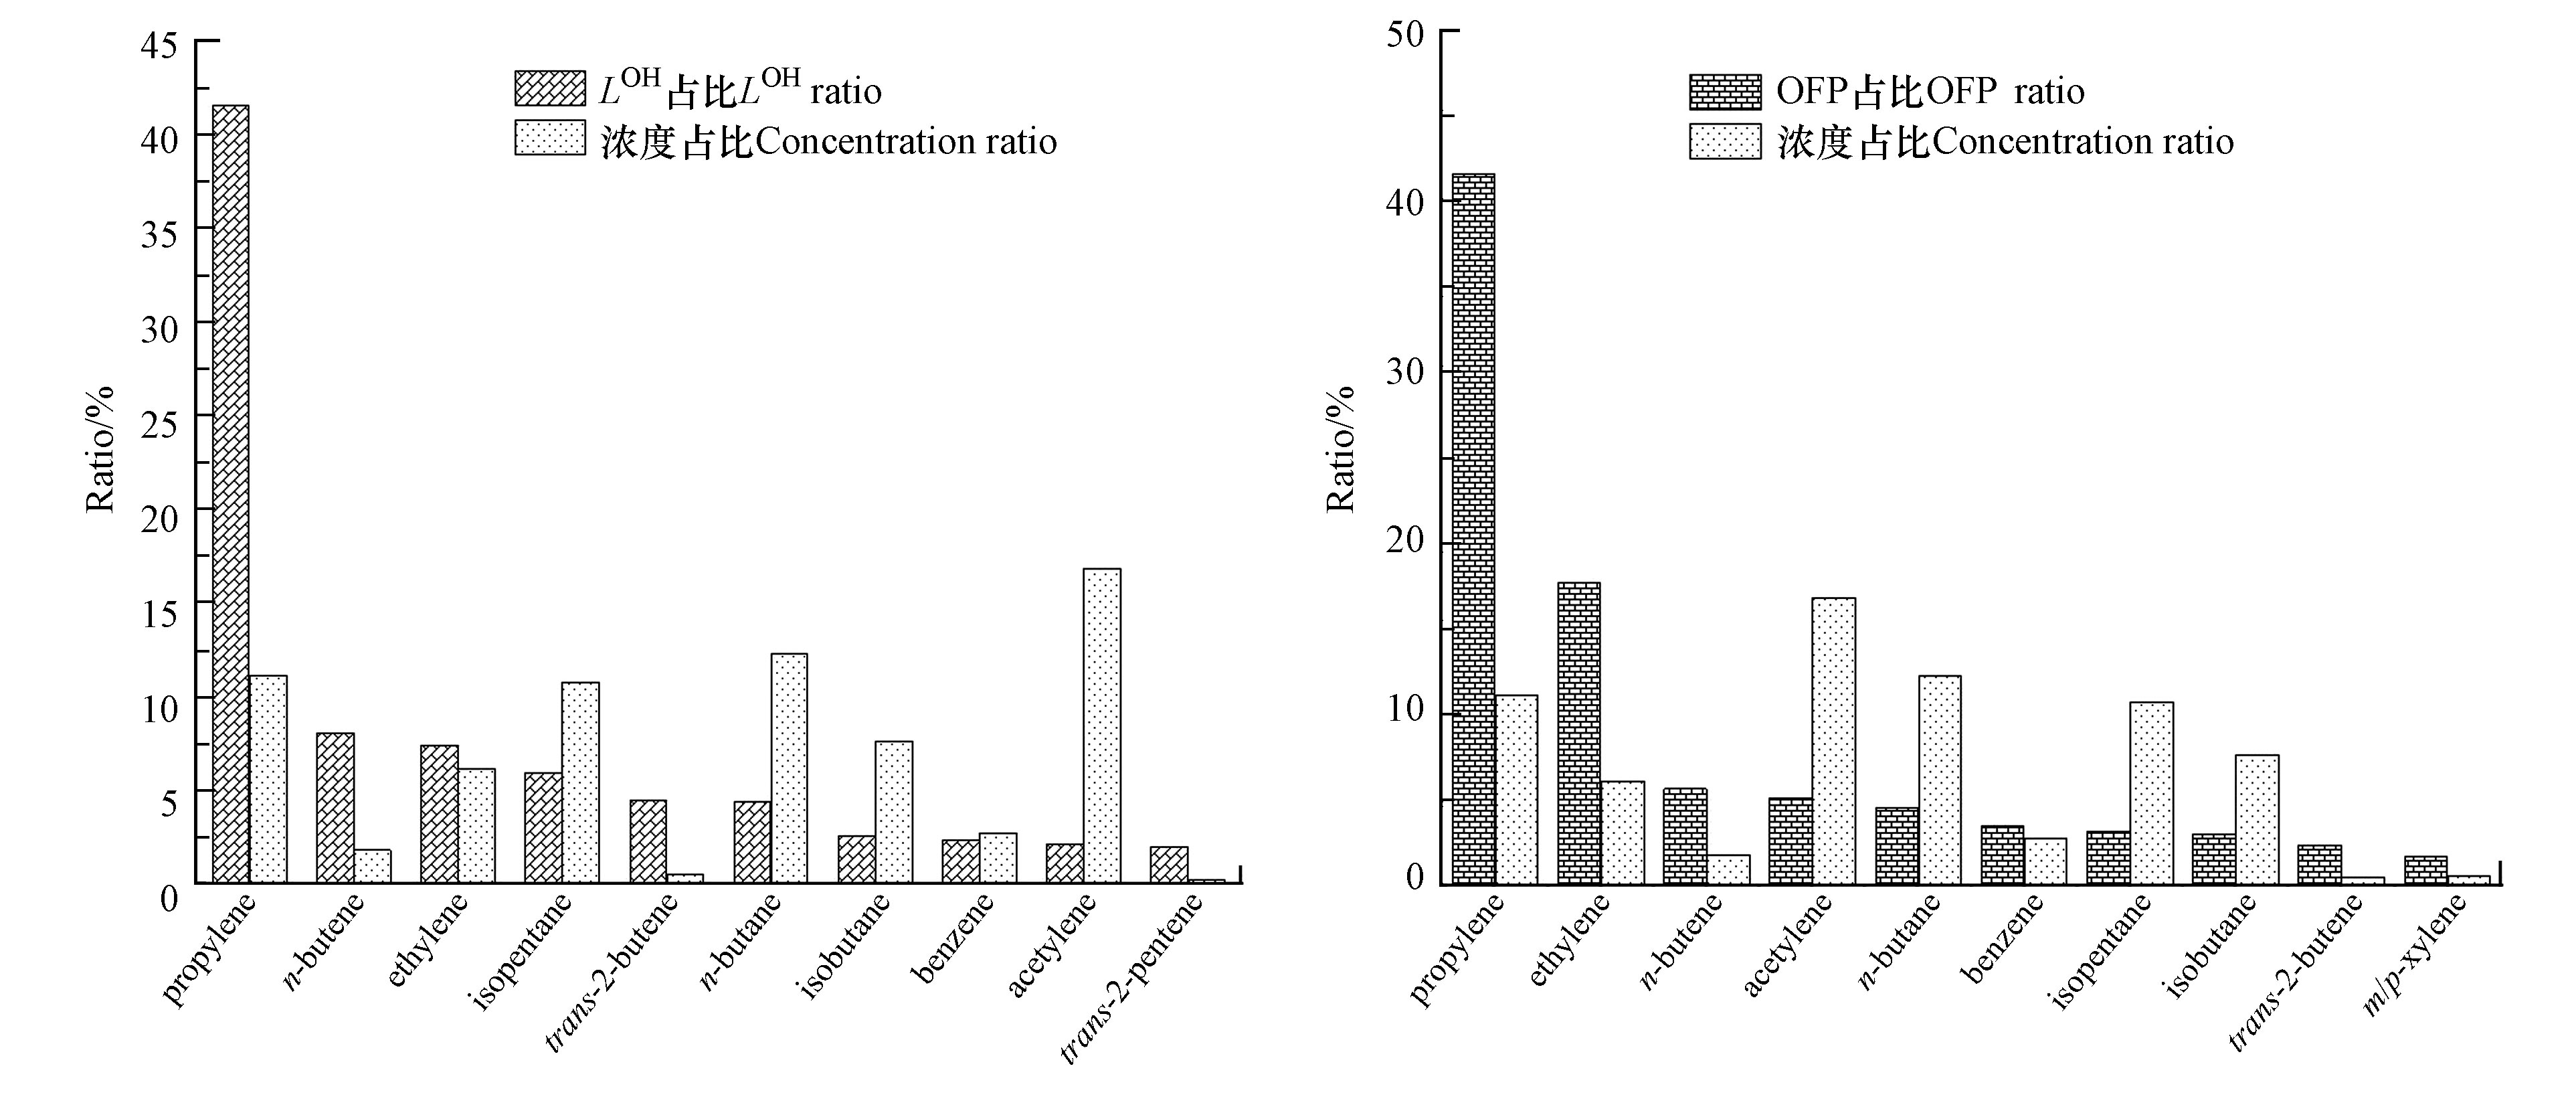
本研究基于2019年5月在安庆市城区离线采集大气中VOCs样品获取的监测结果,分析了安庆市城区大气中VOCs的污染特征、化学反应活性及与二次气溶胶生成之间的关系。结果表明,2019年5月安庆市城区大气VOCs日均体积分数范围为18.56×10⁻⁹—25.05×10⁻⁹,均值为22.53×10⁻⁹,烷烃、烯烃、炔烃和芳香烃占比分别为52.40%、20.81%、16.90%和9.89%。C2—C5的烷烃、乙烯、丙烯、甲苯和苯是含量最丰富的组分。甲苯/苯(T/B)均值为1.67,表明安庆市城区大气VOCs符合机动车尾气为主要贡献源的特征。乙烷/乙炔(E/E)均值为0.49,表明采样区域大气老化程度较轻,受本地污染排放影响较大。利用·OH消耗速率(LOH)和臭氧生成潜势(OFP)评估了大气VOCs的反应活性,安庆市城区大气VOCs中烯烃活性最高,对LOH和OFP的贡献依次为67.08%和69.80%,丙烯、乙烯、正丁烯、乙炔等是安庆市大气VOCs的关键活性组分。利用气溶胶生成系数法(FAC)估算了大气中VOCs的二次气溶胶生成潜势,芳香烃对SOA的贡献率最大,高达94.09%,甲苯、苯和间/对二甲苯等是对SOA生成贡献较大的组分。
Abstract:In this study, the volatile organic compounds (VOCs) samples in the atmosphere were collected offline in Anqing city in May 2019 to analyze the pollution characteristics and the chemical reactivity of VOCs. The relationships between VOCs and the formation of the secondary aerosol were analysed. The results showed that the daily average volume fraction of VOCs in Anqing ranged from 18.56 × 10⁻⁹ to 25.05 × 10⁻⁹ with an average value of 22.53 × 10⁻⁹. Alkanes, olefins, alkynes and aromatic hydrocarbons accounted for 52.40%, 20.81%, 16.90% and 9.89% of the total VOCs, respectively. Alkanes (C2—C5), ethylene, propylene, toluene and benzene were the most predominant components. The average value of toluene / benzene (T/B) was 1.67, indicating that atmospheric VOCs pollution in Anqing were mainly affected by vehicle exhausts. The average value of ethane / acetylene (E/E) was 0.49, which showed that the aging degree of atmosphere in the sampling area was relatively low, which was greatly affected by local pollution emissions. ·OH depletion rate (LOH) and ozone formation potential (OFP) was adapted to evaluate the reactivity of atmospheric VOCs. The results indicated that olefin activity of atmospheric VOCs in Anqing was the highest, which contributed 67.1% to the LOH and 69.8% to the ORP. Propylene, ethylene, n-butene and acetylene were the main active components of atmospheric VOCs in Anqing. The secondary aerosol generation potential of VOCs in the atmosphere was estimated by using the aerosol generation coefficient method (FAC). The contribution rate of aromatic hydrocarbons to SOA was the highest, which was up to 94.09%. Toluene, benzene and m/p-xylene were the most important components to the formation of SOA.
-
Key words:
- volatile organic compounds /
- reactivity /
- pollution characteristics /
- Anqing City
-
表 1 安庆市大气中VOCs占比前十的物质浓度水平
Table 1. concentration level of VOCs in the atmosphere of Anqing City
VOCs组分
VOCs component检出限(×10−9)
Detection limit最大值(×10−9)
Maximum value最小值(×10−9)
Minimum value平均值(×10−9)
Average value标准偏差
Standard deviation体积分数占比/%
Percentage of volume fraction乙炔 0.01 4.37 3.26 3.81 0.38 16.92 正丁烷 0.06 3.19 2.31 2.78 0.29 12.32 丙烯 0.01 3.62 1.89 2.52 0.53 11.17 异戊烷 0.1 3.44 1.26 2.43 0.90 10.80 乙烷 0.02 2.24 1.35 1.87 0.33 8.29 异丁烷 0.09 2.02 1.37 1.73 0.20 7.68 乙烯 0.02 1.76 1.13 1.39 0.27 6.16 甲苯 0.02 1.12 0.89 1.04 0.10 4.60 丙烷 0.01 0.88 0.54 0.70 0.14 3.09 苯 0.02 0.67 0.56 0.62 0.04 2.75 表 2 安庆市城区大气VOCs中各类别的体积分数及其对LOH和OFP贡献比
Table 2. volume fraction of components in air VOCs in Anqing city and their contribution ratio to LOH and OFP
VOCs类别
VOCs category体积分数占比/%
Percentage of volume fractionLOH占比/%
LOH ratioOFP占比/%
OFP ratio烷烃 52.43 22.03 15.89 烯烃 20.74 67.08 69.80 芳香烃 9.92 8.73 9.16 炔烃 16.92 2.16 5.14 表 3 观测期间VOCs各组分的浓度水平及SOA生成潜势
Table 3. concentration level of VOCs components and SOA generation potential during observation
VOCs类别
VOCs categoryVOCs组分
VOCs component平均值(×10−9)
Average valueFAC/
%FVOCr/
%SOA(×10−2)/
(μg·m−3)贡献率/%
Contribution rate烷烃 非SOA前体物 — — — — — 甲基环戊烷 0.05 0.17 10 0.04 0.07 环己烷 0.04 0.17 14 0.03 0.06 甲基环己烷 0.04 2.7 20 0.53 1.00 正庚烷 0.03 0.06 14 0.01 0.02 2-甲基庚烷 0.04 0.5 10 0.12 0.22 3-甲基庚烷 0.01 0.5 10 0.04 0.07 正辛烷 0.02 0.06 17 0.01 0.01 正壬烷 0.01 1.5 20 0.14 0.26 正癸烷 0.06 2 22 1 1.88 正十一烷 0.01 2.5 25 0.33 0.63 正十二烷 0.01 3.00 0.26 0.44 0.83 小计 0.33 — — 2.68 5.05 芳香烃 非SOA前体物 — — — — — 苯 0.62 2.00 0.1 4.80 9.05 甲苯 1.04 5.40 0.12 26.18 49.30 乙苯 0.14 5.40 0.15 4.13 7.78 间/对二甲苯 0.13 4.70 0.34 4.24 7.99 邻二甲苯 0.09 5.00 0.26 3.02 5.69 间乙基甲苯 0.03 6.30 0.31 1.33 2.50 1,2,4,-三甲基苯 0.04 2.00 0.58 1.02 1.92 1,3,5,-三甲基苯 0.02 2.90 0.74 0.94 1.77 1,2,3,-三甲基苯 0.02 3.60 0.51 0.73 1.38 对乙基甲苯 0.02 2.50 0.21 0.34 0.64 邻乙基甲苯 0.02 5.60 0.23 0.67 1.26 正丙苯 0.02 1.60 0.12 0.17 0.31 异丙苯 0.01 4.00 0.13 0.35 0.66 间二乙基苯 0.01 6.30 0.47 0.61 1.15 对二乙基苯 0.02 6.30 0.47 1.42 2.68 小计 2.21 — — 49.96 94.09 烯烃 非SOA前体物 — — — — — 异戊二烯 0.08 2.00 0 0.46 0.86 小计 0.08 — — 0.46 0.86 合计 2.61 — — 53.10 100.00 -
[1] 中华人民共和国生态环境部. 2018年中国生态环境状况公报[R]. 2019. Ministry of Ecological Environment of the People's Republic of China. Bulletin of China's ecological environment in 2018[R]. 2019(in Chinese).
[2] WANG T, XUE L, BRIMBLECOMB P, et al. Ozone pollution in China: A review of concentrations, meteorological influences, chemical precursors, and effects [J]. Science of the Total Environment, 2016, 575: 1582-1596. [3] MATUS K, NAM K, SELIN N E, et al. Health damages from air pollution in China [J]. Global Environmental Change, 2012, 22(1): 66. [4] 张利慧, 毋振海, 李斌, 等. 北京市城区春季大气挥发性有机物污染特征 [J]. 环境科学研究, 2020, 33(3): 526-535. ZHANG L H, WU Z H. LI B, et al Pollution characterizations of atmospheric volatile organic compounds in spring of Beijing urban area [J]. Research of Environmental Sciences, 2020, 33(3): 526-535(in Chinese).
[5] 吕子峰, 郝吉明, 段菁春, 等. 北京市夏季二次有机气溶胶生成潜势的估算 [J]. 环境科学, 2009, 30(4): 969-975. doi: 10.3321/j.issn:0250-3301.2009.04.005 LV Z F, HAO J M, DUAN Q C, et al. Estimate of the formation potential of secondary organic aerosol in Beijing summer time [J]. Environmental Science, 2009, 30(4): 969-975(in Chinese). doi: 10.3321/j.issn:0250-3301.2009.04.005
[6] 王倩, 陈长虹, 王红丽, 等. 上海市秋季大气VOCs对二次有机气溶胶的生成贡献及来源研究 [J]. 环境科学, 2013, 34(2): 424-433. WANG Q, CHEN C H, WANG H L, et al. Forming potential of secondary organic aerosols and sources apportionment of VOCs in autumn of Shanghai [J]. Environmental Science, 2013, 34(2): 424-433(in Chinese).
[7] 杨笑笑, 汤莉莉, 胡丙鑫, 等. 南京城区夏季大气VOCs的来源及对SOA的生成研究——以亚青和青奥期间为例 [J]. 中国环境科学, 2016, 36(10): 2896-2902. doi: 10.3969/j.issn.1000-6923.2016.10.003 YANG X X, TANG L L, HU B X, et al. Sources apportionment of volatile organic compounds VOCs in summertime Nanjing and their potential contribution to secondary organic aerosols(SOA) [J]. China Environmental Science, 2016, 36(10): 2896-2902(in Chinese). doi: 10.3969/j.issn.1000-6923.2016.10.003
[8] 卢学强, 韩萌, 冉靓, 等. 天津中心城区夏季非甲烷有机化合物组成特征及其臭氧产生潜力分析 [J]. 环境科学学报, 2011, 31(2): 373-380. LU X Q, HAN M, RAN J, et al. Characteristics of nonmethane organic compounds and their ozone formation potentials in downtown Tianjin in summer [J]. Acta Scientiae Circumstantiae, 2011, 31(2): 373-380(in Chinese).
[9] 张翼翔, 尹沙沙, 袁明浩, 等. 郑州市春季大气挥发性有机物污染特征及源解析 [J]. 环境科学, 2019, 40(10): 4372-4381. ZHANG Y X, YIN S S, YUAN M H, et al. Characteristics and source apportionment of ambient VOCs in spring in Zhengzhou [J]. Environmental Science, 2019, 40(10): 4372-4381(in Chinese).
[10] 王磊. 合肥市环境空气中痕量挥发性有机物的污染特征研究[D]. 合肥: 安徽农业大学, 2015. WANG L. Study on pollution characteristics of trace volatile organic compounds in ambient air of Hefei[D]. Hefei: Anhui Agricultural University, 2015(in Chinese).
[11] ATKINSON R, AREY J. Atmospheric degradation of volatile organic compounds [J]. Chemical Reviews, 2003, 103(12): 4605-4638. doi: 10.1021/cr0206420 [12] CARTER W P L. Development of ozone reactivity scales for volatile organic compounds [J]. Air & Waste: Journal of the Air & Waste Management Association, 1996, 44(7): 881-899. [13] GROSJEAN, DANIEL. In situ organic aerosol formation during a smog episode: Estimated production and chemical functionality [J]. Atmospheric Environment, 1992, 26(6): 953-963. doi: 10.1016/0960-1686(92)90027-I [14] 黄海梅, 戴春皓, 王章玮, 等. 长沙市大气挥发性有机物的组成与来源 [J]. 环境化学, 2019, 38(3): 539-547. doi: 10.7524/j.issn.0254-6108.2018042501 HUANG H M, DAI C H, WANG Z W, et al. Composition and source apportionment of ambient volatile organic compounds in Changsha, China [J]. Environmental Chemistry, 2019, 38(3): 539-547(in Chinese). doi: 10.7524/j.issn.0254-6108.2018042501
[15] 王伶瑞, 李海燕, 陈程, 等. 长三角北部沿海城市2018年大气VOCs分布特征 [J]. 环境科学学报, 2020, 40(4): 1385-1400. WANG L R, LI H Y, CHEN C, et al. Distributions of VOCs in a coastal city in the Northern Yangtze River Delta during 2018 [J]. Acta Scientiae Circumstantiae, 2020, 40(4): 1385-1400(in Chinese).
[16] 杨文武. 泰州市环境空气中挥发性有机物分布特征 [J]. 环境监测管理与技术, 2020, 32(3): 68-71. doi: 10.3969/j.issn.1006-2009.2020.03.016 YANG W W. Distribution characteristics of volatile organic compounds in the ambient air of Taizhou [J]. The Administration and Technique of Environmental Monitoring, 2020, 32(3): 68-71(in Chinese). doi: 10.3969/j.issn.1006-2009.2020.03.016
[17] 王倩. 2019年5月上海复合污染过程中挥发性有机物的污染特征及来源 [J]. 环境科学, 2020, 41(6): 2555-2564. WANG Q. Chemical characteristics and source of volatile organic compounds in Shanghai during ozone pollution and particle pollution episode in May, 2019 [J]. Environmental Science, 2020, 41(6): 2555-2564(in Chinese).
[18] CHAN C Y, CHAN L Y, WANG X M, et al. Volatile organic compounds in roadside microenvironments of metropolitan Hong Kong [J]. Atmospheric Environment, 2002, 36(12): 2039-2047. doi: 10.1016/S1352-2310(02)00097-3 [19] BARLETTA B, MEINARDI S, ROWLAND F S, et al. Volatile organic compounds in 43 Chinese cities[J]. Atmospheric Environment. 2005, 39(32): 5979-5990. [20] HO K F, LEE S C, GUO H, et al. Seasonal and diurnal variations of volatile organic compounds (VOCs) in the atmosphere of Hong Kong [J]. Science of the Total Environment, 2004, 322(1-3): 155-166. doi: 10.1016/j.scitotenv.2003.10.004 [21] DUFFY B L, NELSON P F. Non-methane exhaust composition in the Sydney Harbour Tunnel: A focus on benzene and 1, 3-butadiene[J]. Atmospheric Environment. 1996, 30(15): 2759-2768. [22] 杨燕萍, 王莉娜, 杨丽丽, 等. 兰州工业区夏季挥发性有机物污染特征研究 [J]. 环境与发展, 2020, 32(4): 163-165. YANG Y P, WANG L N, YANG L L, et al. Summer pollution characteristics of volatile organic compounds in Lanzhou industrial area [J]. Environment and Development, 2020, 32(4): 163-165(in Chinese).