


-
大气细颗粒物是指分散在大气中的固态或颗粒状物质[1],因为具有粒径小、活性强比表面积大等特点而容易富集有毒有害物质进而危害人体健康[2-3],细颗粒物不仅影响人体健康,同时它通过光的散射和吸收等消光效应降低大气能见度[4]。水溶性无机离子是大气细颗粒物的主要组成部分,可以占ρ(PM2. 5)的40%以上[5- 6],灰霾期占比为50%—60%[7]。
SNA ( 为
${\rm{SO}}_4^{2- } $ 、${\rm{NO}}_3^{- } $ 和${\rm{NH}}_4^{+ } $ 的统称) 是大气二次气溶胶的重要组成,主要来源于SO2的直接排放及NOx和NH3的氧化作用,三者占比之和可达到80%以上[8],是造成许多城市大气能见度降低的主要原因。SO2和NO2不仅是形成硫酸盐和硝酸盐的重要前体物[9],也是造成大气酸化的主要物质。硫酸盐的生成主要有两种方式,一种是通过非均相气粒转化,主要是与温度、自由基和太阳辐射的强弱相关;一种是液相氧化,主要与相对湿度和氧化剂有关[10]。硝酸盐的形成主要有气相形成和液相形成两种方式,气相形成是在白天有光照且存在羟基自由基的情况下,NO2与羟基自由基反应形成硝酸,并通过气固分配方式进入颗粒相,最终形成硝酸盐;液相形成是在夜晚无光照条件下、羟基自由基的生成被抑制,从而生成气态硝酸的途径也会被抑制,因此,在夜间NO2倾向于被臭氧氧化成N2O5,进而在颗粒物表面水解形成硝酸盐[11]。但因各地气象条件、能源结构等的不同,其组成结构和浓度水平存在较大差异[12]。利用ρ(${\rm{NO}}_3^{- } $ )/ρ(${\rm{SO}}_4^{2- } $ )可以定性判断移动源和固定源对大气污染的相对贡献[13];通过对PM2.5中水溶性离子的相关性分析和主成分分析,可以探讨水溶性离子的可能来源及其共存方式[14-16]。目前,我国对PM2.5中水溶性离子的研究主要集中在经济较发达地区,如京津冀[17]、珠三角地区[18]、四川盆地[19]等,有研究结果表明大气颗粒物中二次水溶性占主导作用[20],秸秆燃烧对大气颗粒物中的K+质量浓度有很大贡献[21],并且外来气团的传输对本地灰霾天气有很大的影响[22]。 北方城市纬度较高,冬季天气寒冷,在寒冷时期会进行采暖以便人们能够正常地生产生活。采暖期的能源来源一般都为煤燃烧,大量的煤在燃烧过程中所产生的颗粒物会对大气造成污染。葫芦岛市和朝阳市分别位于辽宁省的西南部及西部,辽宁省西南与河北接壤,西北与内蒙古毗连,东北与吉林为邻。地理位置特殊,受周边地区的影响较为严重。冬季实行供暖导致大量的煤烟污染物产生,同时机动车数量和密度也在逐年增长,机动车尾气排放包括了一次颗粒物和气态前体物(NOX、VOCS)也是大气中PM2.5的主要来源。
本文将针对辽宁省西南部典型城市冬季PM2.5中水溶性离子污染特征变化及来源进行研究解析,以期为改善辽宁省的空气质量提供有力依据。
-
采样点位于葫芦岛和朝阳市建成区内(清洁对照点除外),其中葫芦岛有3个采样点(新区、龙港区、化工街),朝阳3个采样点(河畔小区、西梁、农业园),以及清洁对照点龙屯水库(采样点位的具体信息如表1所示)。本研究采用国产武汉天虹TH14—A四通道采样器,采样流量为16.7 L·min−1。其中6个城市采样点的采样时期为2018年12月3日—2019年1月1日,连续采集样品共180个;龙屯水库的采样时间为2018年12月12日—2019年1月1日,共采集21个样品。每日连续采集23 h,采样具体时间为上午10时至次日上午9时。采样滤膜为47 mm石英滤膜,滤膜粗糙面朝向进气口,光滑面靠近出气口。
-
使用电子分析天平将采样前后的滤膜进行称重,再根据采样体积计算出PM2.5的质量浓度。石英显纤维滤膜放在马弗炉内灼烧(500 ℃,2 h),称重前将滤膜放在恒温(20±2.5) ℃恒湿(50%±5%)的条件下放置48 h。称量采样滤膜时所需的天平灵敏度为0.01 mg(十万分之一)。称量一次后放置24 h后进行第二次称重并保证二次称量之差不大于0.4 mg。实验时镊子、剪刀在实验前应用乙醇清洗;每次进样前,滤头应进行更换;实验人员在操作过程中应带一次性手套,以防样品受到污染。
样品前处理:在石英滤膜上取1/8的膜并浸泡在5.00 mL去离子水中,摇匀,置于超声波浴下浸提15 min,静置5 min 后,取上清液用于离子色谱分析。样品测定:浸提液经水系滤膜过滤器(孔径0.22 μm,φ13 mm)2次过滤后进样。阳离子检测使用IonPac CS12A分离柱和IonPacCG12A抑制器,淋洗液为20 mmol·L−1甲磺酸,流速为1.0 mL·min−1。阴离子检测使用IonPacAS14分离柱和IonPac AG14抑制器,淋洗液为3.5 mmol·L−1 Na2CO3+1.0 mmol·L−1 NaHCO3的混合液,流速为1.2 mL·min−1。本研究采用DX-120型离子色谱仪(检出限见表2)对样品中的Na+、Mg2+、Ca2+、K+、
${\rm{NH}}_4^{+ } $ 、${\rm{SO}}_4^{2- } $ 、F−、Cl−和${\rm{NO}}_3^{- } $ 等9种水溶性无机离子进行定量分析。 -
大气颗粒物的酸碱性对降水也有重要的影响,有大量的研究表明,大气颗粒物能够中和酸性降水,也能够酸化降水[23]。其中
${\rm{SO}}_4^{2- } $ 、${\rm{NO}}_3^{- } $ 、Cl−能够使雨水酸化,而Ca2+、K+、${\rm{NH}}_4^{+ } $ 能够碱化雨水,根据阴阳离子平衡我们能够计算出数据的有效性及可靠性,阴、阳离子的电荷当量计算公式如下:根据公式(1)、(2)计算出朝阳市、葫芦岛市及龙屯水库数据中阴阳离子的相关系数公式分别为y=1.342x−0.0808、y=1.188x−0.046、y=1.3406x−0.046,R2分别为0.92、0.95及0.98,阴阳离子相关性较高,说明离子数据具有可靠性和有效性,所分析的离子能够代表水溶性无机离子的主要组分。本研究中葫芦岛市、朝阳市和龙屯水库的CE/AE均大于1,表明颗粒物呈碱性,其中朝阳市和龙屯水库的CE/AE大于葫芦岛市。观测期间没有采集
${\rm{HCO}}_3^{- } $ 等阴离子,也可能是造成大气颗粒物酸度偏低的原因。 -
观测期间,朝阳市和葫芦岛市PM2.5质量浓度分别为(45.38±20.64)、(54.25±26.14) μg·m−3(见图1和表3),相比国内其他城市冬季的数据(表3),朝阳市和葫芦岛市的PM2.5浓度低于北京市、盘锦市和齐齐哈尔等城市,朝阳市和葫芦岛市总水溶性无机离子浓度平均值分别为(22.46±9.06)、(28.60±16.31) μg·m−3,占PM2.5的49.50%和52.72%,与国内其他城市(盘锦29.16%、齐齐哈尔35.02%,北京69%)相比,朝阳市和葫芦岛市的水溶性无机离子浓度水平处较高程度。
朝阳市冬季各水溶性无机离子的质量浓度高低顺序为
${\rm{NO}}_3^{- } $ >${\rm{SO}}_4^{2- } $ >Cl−>${\rm{NH}}_4^{+ } $ >Na+>Ca2+>K+>Mg2+,葫芦岛市冬季各水溶性无机离子的质量浓度高低顺序与朝阳市基本一致。其中朝阳市${\rm{NO}}_3^{- } $ 、${\rm{SO}}_4^{2- } $ 、${\rm{NH}}_4^{+ } $ 的质量浓度分别为(5.51±2.09)、(4.15±1.14)、(3.91±2.28) μg·m−3,分别占总离子质量浓度的24.53%、18.47%、17.41%和PM2.5质量浓度的12.16%、9.14%、8.61%;葫芦岛市${\rm{NO}}_3^{- } $ 、${\rm{SO}}_4^{2- } $ 、${\rm{NH}}_4^{+ } $ 的质量浓度分别为(7.44±6.37)、(7.39±2.90)、(5.55±3.79) μg·m−3,分别占总离子浓度的26.01%、25.84%、19.41%和PM2.5质量浓度的13.71%、13.62%、10.23%。说明这3种二次无机离子是PM2.5的主要组成部分,且${\rm{NO}}_3^{- } $ 浓度略高于${\rm{SO}}_4^{2- } $ 浓度。由图1可以看出,水溶性离子变化趋势与PM2.5质量浓度变化趋势基本一致,在观测期间,无机离子质量浓度随PM2.5质量浓度的变化有明显的上升和下降的趋势,随着PM2.5质量浓度的增加,水溶性无机离子的质量浓度也有不同程度的增加。在污染与非污染情况下,水溶性无机离子的组成及质量浓度也存在差异。
-
为研究不同水平下化学组分的变化特征,根据GB-3095—2012将朝阳市、葫芦岛市和龙屯水库污染水平分为清洁天和污染天(见图2)。其中PM2.5≤75 μg·m−3为清洁天,PM2.5>75 μg·m−3为污染天。
采样期间,朝阳市清洁天和污染天天数分别为27 d、3 d,PM2.5的质量浓度分别为(40.09±15.65)、(90.81±9.11) μg·m−3;葫芦岛市清洁天和污染天为26 d、4 d,PM2.5的质量浓度分别为(47.25±15.54)、(105±31.38) μg·m−3;龙屯水库的清洁天和污染天为18 d、1 d,PM2.5的质量浓度分别为(29.32±10.21)、(113.16) μg·m−3。
图3给出了朝阳市、葫芦岛市和龙屯水库不同污染状况下PM2.5中水溶性离子的化学组成。由图3可见,在不同时期朝阳市、葫芦岛市和龙屯水库的
${\rm{SO}}_4^{2- } $ 、${\rm{NO}}_3^{- } $ 、${\rm{NH}}_4^{+ } $ 和Cl−占比较高。${\rm{SO}}_4^{2- } $ 、${\rm{NO}}_3^{- } $ 、${\rm{NH}}_4^{+ } $ 大部分源于二次反应,这3种离子占比高说明城市的二次污染比较污染比较严重,${\rm{SO}}_4^{2- } $ 离子主要来自燃煤排放及SO2转化,在采暖期与燃煤有较大关系。与清洁天相比较,污染天${\rm{SO}}_4^{2- } $ 的占比有所降低,${\rm{NO}}_3^{- } $ 的占比有所增加。朝阳市与葫芦岛市离子质量浓度变化趋势基本相同,略有不同,主要体现在${\rm{NO}}_3^{- } $ 、Cl−的浓度变化,朝阳市污染天与清洁天相比${\rm{NO}}_3^{- } $ 浓度略有下降,Cl−的浓度略有升高,葫芦岛市污染天与清洁天相比${\rm{NO}}_3^{- } $ 浓度略有升高而Cl−的浓度略有下降,原因可能与葫芦岛市临近海边,Cl−可能来自于海盐。由表4可见,朝阳市的污染天与清洁天相比,污染天中F−、
${\rm{NH}}_4^{+ } $ 、Cl−和K+增长较多,分别为(2.58±0.58) μg·m−3 、 (7.38±2.84) μg·m−3 、(7.11±4.10) μg·m−3和(1.32±0.32) μg·m−3,均为清洁天的2.5倍左右,其次为${\rm{NO}}_3^{- } $ 、${\rm{SO}}_4^{2- } $ ,分别为 (8.18±1.98) μg·m−3、(5.92±3.65) μg·m−3,是清洁天的1.5倍左右,其他离子均有少量增加,没有显著变化。F−、Cl−和K+是生物质燃烧的标志性组分,这3种离子在污染天增长较快且结合朝阳市特殊的地理位置说明朝阳市污染原因主要来自于冬季燃煤。葫芦岛市与朝阳市略有不同,污染天中
${\rm{NH}}_4^{+ } $ 、${\rm{SO}}_4^{2- } $ 和${\rm{NO}}_3^{- } $ 增长较多,分别为(16.73±13.92) μg·m−3、(11.94±4.53) μg·m−3和 (11.93±6.05) μg·m−3,均为清洁天的3倍左右,其次为Cl−和K+,分别为(8.03±2.11) μg·m−3、(1.46±0.40) μg·m−3,是清洁天的2倍左右,其他离子均有少量增加,没有显著变化。${\rm{NH}}_4^{+ } $ 、${\rm{SO}}_4^{2- } $ 和${\rm{NO}}_3^{- } $ 大部分源于二次反应[28]。综上,葫芦岛市污染原因主要为二次颗粒物的转化和累积。清洁天和污染天的CE/AE有所区别。观测期间,朝阳市的清洁天与污染天的CE/AE值分别为1.07和1.24,污染天气是清洁天气的1.15倍;R2分别为0.92和0.77;葫芦岛市的清洁天与污染天的CE/AE值分别为1.06和1.24,R2分别为0.91和0.96,污染天气时是清洁天气的1.16倍;龙屯水库的清洁天与污染天的CE/AE值分别为1.13和1.32,污染天气时是清洁天气的1.17倍。造成污染发生时3个站点大气颗粒物的碱性增大的原因可能是,污染发生时,朝阳市、葫芦岛市和龙屯水库的Ca2+含量在污染天时分别是清洁天的1.34、1.45、1.30倍。
-
通过对PM2.5中水溶性无机离子的相关性分析,可以对PM2.5中无机离子的结合方式进行初步探讨,本文将通过相关性分析及主成分分析结果对以上几种离子来源及共存方式进行分析。
-
${\rm{NH}}_4^{+ } $ 与${\rm{SO}}_4^{2- } $ 、${\rm{NO}}_3^{- } $ 相关性分析见图4.葫芦岛市PM2.5中${\rm{NH}}_4^{+ } $ 和${\rm{NO}}_3^{- } $ 、${\rm{SO}}_4^{2- } $ 及${\rm{NO}}_3^{- } $ +2${\rm{SO}}_4^{2- } $ 的相关性较好,分别为0.75、0.89、0.91;朝阳市PM2.5中${\rm{NH}}_4^{+ } $ 和${\rm{NO}}_3^{- } $ 、${\rm{SO}}_4^{2- } $ 及${\rm{NO}}_3^{- } $ +2${\rm{SO}}_4^{2- } $ 的相关系数分别为0.91、0.67、0.75;龙屯水库PM2.5中${\rm{NH}}_4^{+ } $ 和${\rm{NO}}_3^{- } $ 、${\rm{SO}}_4^{2- } $ 及${\rm{NO}}_3^{- } $ +2${\rm{SO}}_4^{2- } $ 的相关系数分别为0.60、0.99、0.98。两两之间相关性均大于0.6,说明3种离子有较好的同源性,且3种离子均属于老化产物,主要和大气扩散条件相关。朝阳市的Cl−和F−、K+呈现出极强的相关性。相关性系数分别为0.79、0.85。葫芦岛市的Cl−和F−、K+的相关性系数为0.51、0.78。说明三者可能来自相同的污染源,可能是生物质燃烧。F−主要来自燃煤,K+主要来自于生物质燃烧,说明朝阳市的Cl−可能来自燃煤、生物质燃烧,而葫芦岛的则主要来自于生物质燃烧。
朝阳市中Cl−和Na+、Mg2+的相关性系数为0.71、0.62。葫芦岛市Cl−和Na+、Mg2+的相关性系数为0.52、0.48。说明朝阳市的Na+、Mg2+主要以盐酸盐的形式存在。由于葫芦岛特殊的地理环境,葫芦岛市的Cl−和Na+可能来源于海盐源。
-
为进一步了解各种污染源对PM2.5的贡献,本研究利用spss软件对辽宁省观测期间标准化后的水溶性无机离子数据进行主成分分析。
(1)朝阳市主成分分析
表5的3个因子共解释了82.56%的来源。因子1解释了39%的离子来源,Na+、F−、Cl−和K+的载荷较高,且Cl−和K+、F−的相关系数分别为0.85和0.79。Cl−和F−可能来自于燃煤,K+是生物质燃烧的表示组分,因此,因子1可判断为燃煤和生物质燃烧。因子2解释了28%的离子来源,
${\rm{NH}}_4^{+ } $ 、${\rm{NO}}_3^{- } $ 的作用显著,此外,因子3解释15%的离子来源,Ca2+的载荷较大,主要为地壳元素,可判断为建筑尘或土壤尘。此外,$ {\rm{NH}}_4^{+}$ 和${\rm{NO}}_3^{-} $ 的相关系数达到 0.92,说明除燃煤外,机动车尾气也是${\rm{NH}}_4^{+} $ 和${\rm{NO}}_3^{-} $ 的来源之一。因子 3 解释 15%的离子来源,Ca2+的载荷较大,主要为地壳元素,可判断为建筑尘或土壤尘。(2)葫芦岛市主成分分析
表6的三个因子共解释了84.28%的来源。因子1解释了32%的离子来源,
${\rm{NH}}_4^{+ } $ 与${\rm{NO}}_3^{- } $ 、${\rm{SO}}_4^{2- } $ 的载荷较高,离子间相关性较高,通过上述分析可判断为二次污染源;因子2解释了27%的离子来源,K+和Cl−作用显著,且二者的相关性较高,说明K+和Cl−具有同源性,因此可判断因子2的污染源为生物质燃烧。因子3中Ca2+、Mg2+的载荷较大,主要为地壳元素,可判断为建筑尘或土壤尘,该因子的贡献率为25%。(3)龙屯水库主成分分析
表7是背景点龙屯水库的主成分分析。因子1解释了55%的离子来源,主要为二次污染源。因子2 解释19%的离子来源,主要是Ca2+、Mg2+的载荷较高可判断为建筑尘或土壤尘。因子3解释18%的离子来源,主要以 Cl−和Na+为主由于龙屯水库特殊的地理位置可判断为海盐源。
-
由于
${\rm{SO}}_4^{2- } $ 、${\rm{NO}}_3^{- } $ 多存在于粒径≤2.5 μm的颗粒中,所以用SOR和NOR来表征PM2.5中${\rm{SO}}_4^{2- } $ 、${\rm{NO}}_3^{- } $ 的转化情况。当SOR和NOR的值都大于0.1时说明有二次转化发生[29],当二者都小于0.1时,说明一次污染源占主要地位。朝阳市、葫芦岛市和龙屯水库的SOR和NOR计算值见表8。SOR和NOR的值越大时,说明二次转化率越高[30]。计算公式如下(公式中离子均为摩尔浓度):朝阳市清洁天和污染天的SOR值分别为0.17和0.13,NOR值分别为0.15和0.17;葫芦岛市清洁天和污染天的SOR值分别为为0.12和0.18,NOR值分别为0.12和0.23。在不同的污染状况下,朝阳市和葫芦岛市的SOR、NOR值均大于0.1,说明朝阳市和葫芦岛市污染均由二次转化做主导地位,且污染天中NOR值的增幅显著高于SOR,说明NOx在污染天下转化更快。
朝阳市的污染天SOR值低于朝阳市的清洁天,原因可能12月太阳辐射强度低和气温低,不利于SO2的光化学反应及转化[31]。
本研究中,大气颗粒物中的硫酸盐离子主要是由SO2发生液相氧化形成,在细颗粒物中,硝酸盐是由NOx发生均相反应形成HNO3,HNO3与NH3反应生成硝酸铵离子。NH3NO3在高温低湿的条件下不稳定,容易分解成气态的硝酸和氨;
${\rm{NH}}_4^{+ } $ 由NH3在酸性颗粒物表面反应或凝结而成,是PM2.5中主要的阳离子,通常以(NH4)2SO4、NH4HSO4、NH4NO3等形式存在。SNA(${\rm{NH}}_4^{+ } $ 、${\rm{SO}}_4^{2- } $ 和${\rm{NO}}_3^{- } $ )是水溶性离子的重要组分,本研究使用3种离子的物质的量浓度绘制${\rm{SO}}_4^{2- } $ -${\rm{NO}}_3^{- } $ -${\rm{NH}}_4^{+ } $ 三角图[32],结果如图5。朝阳市和葫芦岛市
${\rm{NH}}_4^{+ } $ 平均百分比含量分别为26.33%、27.34%,${\rm{SO}}_4^{2- } $ 平均百分比含量为40.15%、36.14%,${\rm{NO}}_3^{- } $ 平均百分比为33.51%、36.52%。 采样期间,朝阳市和葫芦岛市颗粒物中${\rm{SO}}_4^{2- } $ 占比较高,${\rm{NO}}_3^{- } $ 与${\rm{SO}}_4^{2- } $ 占比相当,由于${\rm{SO}}_4^{2- } $ 与${\rm{NO}}_3^{- } $ 争夺与NH3结合的机会,NH3更倾向于与${\rm{SO}}_4^{2- } $ 结合,所以朝阳市和葫芦岛市颗粒物主要以(NH4)2SO4形式存在。龙屯水库
${\rm{NH}}_4^{+ } $ 平均百分比含量为24.43%,${\rm{SO}}_4^{2- } $ 平均百分比含量为33.11%,${\rm{NO}}_3^{- } $ 平均百分比为42.46%。${\rm{NO}}_3^{- } $ 为主要的阴离子,主要以NH4NO3的形式存在。大气颗粒物中的
${\rm{NO}}_3^{- } $ /${\rm{SO}}_4^{2- } $ 比值可以对移动源和固定源对大气中氮、硫贡献率的大小进行比较[33]。若比值大于1,说明移动源的排放贡献要高于固定源,若比值小于1,则固定源为主[34]。朝阳市、葫芦岛市和龙屯水库的${\rm{NO}}_3^{- } $ 与${\rm{SO}}_4^{2- } $ 比值分别为0.80、0.94和1.11。由此说明,葫芦岛和朝阳市主要以固定源排放为主,主要原因是辽宁省属于北方城市,冬季需要大量燃煤取暖。龙屯水库主要受移动源的影响。 -
PM2.5及水溶性离子变化特征不仅受本地污染源的影响,也会受外来气团输送的影响[35]。仅仅从本地污染源排放的角度不能完全解释PM2.5及其水溶性无机离子的变化特征,外来气流的输送会加重大气污染[36]。利用Trajstat[37]软件计算观测站点的气流后向轨迹,该软件对气团轨迹的计算是利用王亚强等开发的meteoinfo模式进行计算,模拟出朝阳市和葫芦岛市观测期间气团的后向轨迹。
表9为朝阳市和葫芦岛市观测期间48 h气团后向轨迹,模拟高度为500 m,计算频率:每隔24 小时,计算一次。图6为朝阳市及葫芦岛市不同气团传输下颗粒物的化学组成差异。气象数据来自美国气象环境预报中心(NCEP)计算时间节点为23点。对2018年12月3日至2019年1月1日期间传输至朝阳市、葫芦岛市的气团进行聚类分析。该方法根据气团的来源方向及传输速度对大量轨迹进行聚类分析,通过结合传输至朝阳市和葫芦岛市的气团类型、风速及大气颗粒物化学特征分析,掌握气团的大致来源和差异。
表9、图6中显示出2018年12月3日至2019年1月1日期间传输至朝阳市、葫芦岛市的气团特征、不同气团传输下颗粒物的化学组成及风速差异。图中气团主要分为以下四类:
第一类:始于蒙古国方向途经内蒙古传输至朝阳市,该气团下PM2.5的平均浓度为(46.69±19.85) μg·m−3,轨迹占比41.38%,;气团轨迹较长,说明移动速度快,对应地面风速较大,不利于二次转化。与第四类气团及葫芦岛市第一类气团的来源方向、离子浓度基本一致。离子浓度处于中等水平,气团相对较清洁。
第二类:由蒙古国经内蒙古、河北省最终到达朝阳市和葫芦岛市,轨迹最短,该气团经过区域大气中所含PM2.5及前体物的浓度较高,对朝阳市和葫芦岛市的PM2.5质量浓度贡献较高,造成PM2.5质量浓度较高的原因可能是气团移动过程中遇到的气象条件不利于污染物扩散导致污染物累积,风速与其他气团相比较处于较低状态,在PM2.5中
${\rm{NO}}_3^{- } $ 、${\rm{SO}}_4^{2- } $ 、${\rm{NH}}_4^{+ } $ 等可溶性离子浓度较其他气团处于最高状态。第三类:始于俄罗斯,途经蒙古国、内蒙古传输至朝阳市和葫芦岛市,传输轨迹较长,对应地面风速较大,轨迹占比分别为37.93%和24.14%,对应的PM2.5的平均浓度分别为(36.08±18.96)μg·m−3和(40.81±14.12)μg·m−3。在PM2.5中
${\rm{NO}}_3^{- } $ 、${\rm{SO}}_4^{2- } $ 、${\rm{NH}}_4^{+ } $ 等可溶性离子浓度相较于其他气团处于最低水平,气团较清洁。 -
(1) 朝阳市清洁天和污染天天数分别为24 d、6 d,PM2.5的质量浓度分别为(40.09±15.65)、(90.81±9.11) μg·m−3;葫芦岛市清洁天和污染天为25 d、5 d,PM2.5的质量浓度分别为(47.25±15.54)、(132.69±23.86) μg·m−3。
(2) 在污染状况下,朝阳市和葫芦岛市的SNA占比分别为60.15%和74.72%;朝阳市和葫芦岛市的SOR、NOR大于0.1,说明两个城市污染均由二次转化做主导地位,且污染天NOR的增幅大于SOR,说明NOx转化更快。
(3) 根据离子的相关性分析、主成分分析和三角图解得出F−和Cl−主要来源是生物质燃烧和燃煤,还有一部分Cl−来自海盐源;朝阳市的污染主要是燃煤及生物质燃烧,葫芦岛市和龙屯水库的污染主要来自于二次污染;朝阳市和葫芦岛市
${\rm{NH}}_4^{+ } $ 、${\rm{NO}}_3^{- } $ 、${\rm{SO}}_4^{2- } $ 离子主要的结合方式为(NH4)2SO4;龙屯水库${\rm{NH}}_4^{+ } $ 、${\rm{NO}}_3^{- } $ 、${\rm{SO}}_4^{2- } $ 离子主要的结合方式主要结合方式为NH4NO3。(4) 根据主成分分析及离子相关性等结果建议辽宁省可以适当加强机动车管控,增加电动车的使用;加大对秸秆焚烧巡查监管力度;减少化肥农药使用量,减少氮排放,提高畜禽粪污综合利用率,减少氨挥发排放。
辽宁西南典型城市冬季大气细颗粒物水溶性无机离子污染特征及来源解析
Characteristics and source analysis of water-soluble inorganic ion pollution of fine atmospheric particles in winter in typical cities of southwest Liaoning Province
-
摘要: 本研究于2018年12月3日—2019年1月1日在辽宁省西南典型城市葫芦岛市和朝阳市分别布设3个城区采样点,在区域传输点龙屯水库布设1个采样点,采集大气细颗粒物PM2.5样品(n=201)。使用离子色谱检测样品中的Na+、Mg2+、Ca2+、K+、
${{\rm{NH}}_4^{+ }} $ 、${{\rm{SO}}_4^{2- }} $ 、F−、Cl−和${{\rm{NO}}_3^{- }} $ 的质量浓度。观测期间PM2.5的平均浓度为葫芦岛市(54.25±26.14)μg·m−3>朝阳市(45.38±20.64)μg·m−3>区域背景点龙屯水库(33.73±21.64)μg·m−3。水溶性无机离子是PM2.5中的主要成分,朝阳市、葫芦岛市和龙屯水库中的水溶性离子分别占PM2.5质量浓度的49%,52%和49%。其中${{\rm{NH}}_4^{+ } } $ 、${{\rm{NO}}_3^{- } }$ 、${{\rm{SO}}_4^{2-} } $ 是PM2.5中最主要的水溶性离子.葫芦岛市和朝阳市的SOR(硫氧化率)、NOR(氮氧化率)值均大于0.1,说明两个城市存在明显的气溶胶二次转化过程。在不同污染状况下,朝阳市污染天中F−、${{\rm{NH}}_4^{+ }} $ 、Cl−和K+均为清洁天的2.5倍左右,葫芦岛市污染天中${{\rm{NH}}_4^{+ }} $ 、${{\rm{SO}}_4^{2- }} $ 和${{\rm{NO}}_3^{- } } $ 均为清洁天的3倍左右。朝阳市和葫芦岛市污染天SOR分别为0.13和0.18,分别为清洁天的0.76倍和1.5倍;NOR值分别为0.17和0.23,分别是清洁天的1.13倍和1.91倍,除朝阳市SOR外,污染天的SOR和NOR均大于清洁天,表明污染天中SO2和NO2向${{\rm{SO}}_4^{2- }} $ 和${{\rm{NO}}_3^{- }} $ 的二次转化增强。主成分分析结果表明,葫芦岛市和朝阳市PM2.5 的主要污染源来自于二次转化和燃煤、生物质燃烧;龙屯水库的主要污染源来自于二次转化。后向轨迹说明气团主要由内蒙古、俄罗斯及蒙古国传输至辽宁省。Abstract: In this study, three urban sampling sites were set up in Huludao and Chaoyang of typical cities in southwestern Liaoning Province, of China. And one regional transportation site was at Longtun reservoir. A total of 201 samples of atmospheric fine particulate (PM2.5) were collected at these sampling sites from December 3, 2018 to January 1, 2019. The mass concentrations of Na+, Mg2+, Ca2+, K+,${\rm{NH}}_4^{+ } $ ,${\rm{SO}}_4^{2- } $ , F−, Cl− and${\rm{NO}}_3^{- } $ in the samples were detected by ion chromatography. During the sampling period, the average mass concentration of PM2.5 showed as Huludao City (54.25±26.14) μg·m−3) > Chaoyang City (45.38±20.64 )μg·m−3) > Longtun Reservoir (33.73±21.64 )μg·m−3).Water-soluble inorganic ions are the main components of PM2.5 accounting for 49%, 52% and 49% of PM2.5 mass concentrations in Chaoyang City, Huludao City and Longtun reservoir, respectively.${\rm{NH}}_4^{+ } $ ,${\rm{NO}}_3^{- } $ and${\rm{SO}}_4^{2- } $ were the major components of the water-soluble ions in PM2.5; The sulfur oxidation rate (SOR) and nitrogen oxidation rate (NOR) were both greater than 0.1 in Huludao City and Chaoyang City, indicating that there was an obvious secondary aerosol transformation process in the two cities. The concentrations of F−,${\rm{NH}}_4^{+ } $ , Cl−and K+ in PM2.5 during polluted periods in Chaoyang city are about 2.5 times higher than clean periods;${\rm{NH}}_4^{+ } $ ,${\rm{SO}}_4^{2- } $ and${\rm{NO}}_3^{- } $ in pollution periods in Huludao City are about three times than clean periods. The values of SOR were 0.13 and 0.18 during pollution periods in Chaoyang City and Huludao city, which were 0.76 and 1.13 times than those values during clean periods. NOR values during polluted periods were 0.17 and 0.23, respectively, which were 1.5 and 1.91 times than that of clean days. Except SOR in Chaoyang city, SOR and NOR in the polluted days were both larger than those in the clean days, indicating that the secondary transformation of SO2 and NO2 to${\rm{SO}}_4^{2- } $ and${\rm{NO}}_3^{- } $ in the polluted day was enhanced; The results of principal analysis showed that the main sources of PM2.5 in Huludao City and Chaoyang City were secondary transformation, coal combustion and biomass burning, while the main pollution source in Longtun reservoir was secondary transformation. The backward trajectories showed that the air masses are mainly originated from Inner Mongolia and Russia to Liaoning Province.-
Key words:
- water-soluble ion /
- SNA /
- SOR /
- NOR /
- backward trajectory /
- PM2.5 /
- Liaoning /
- winter atmospheric
-

-
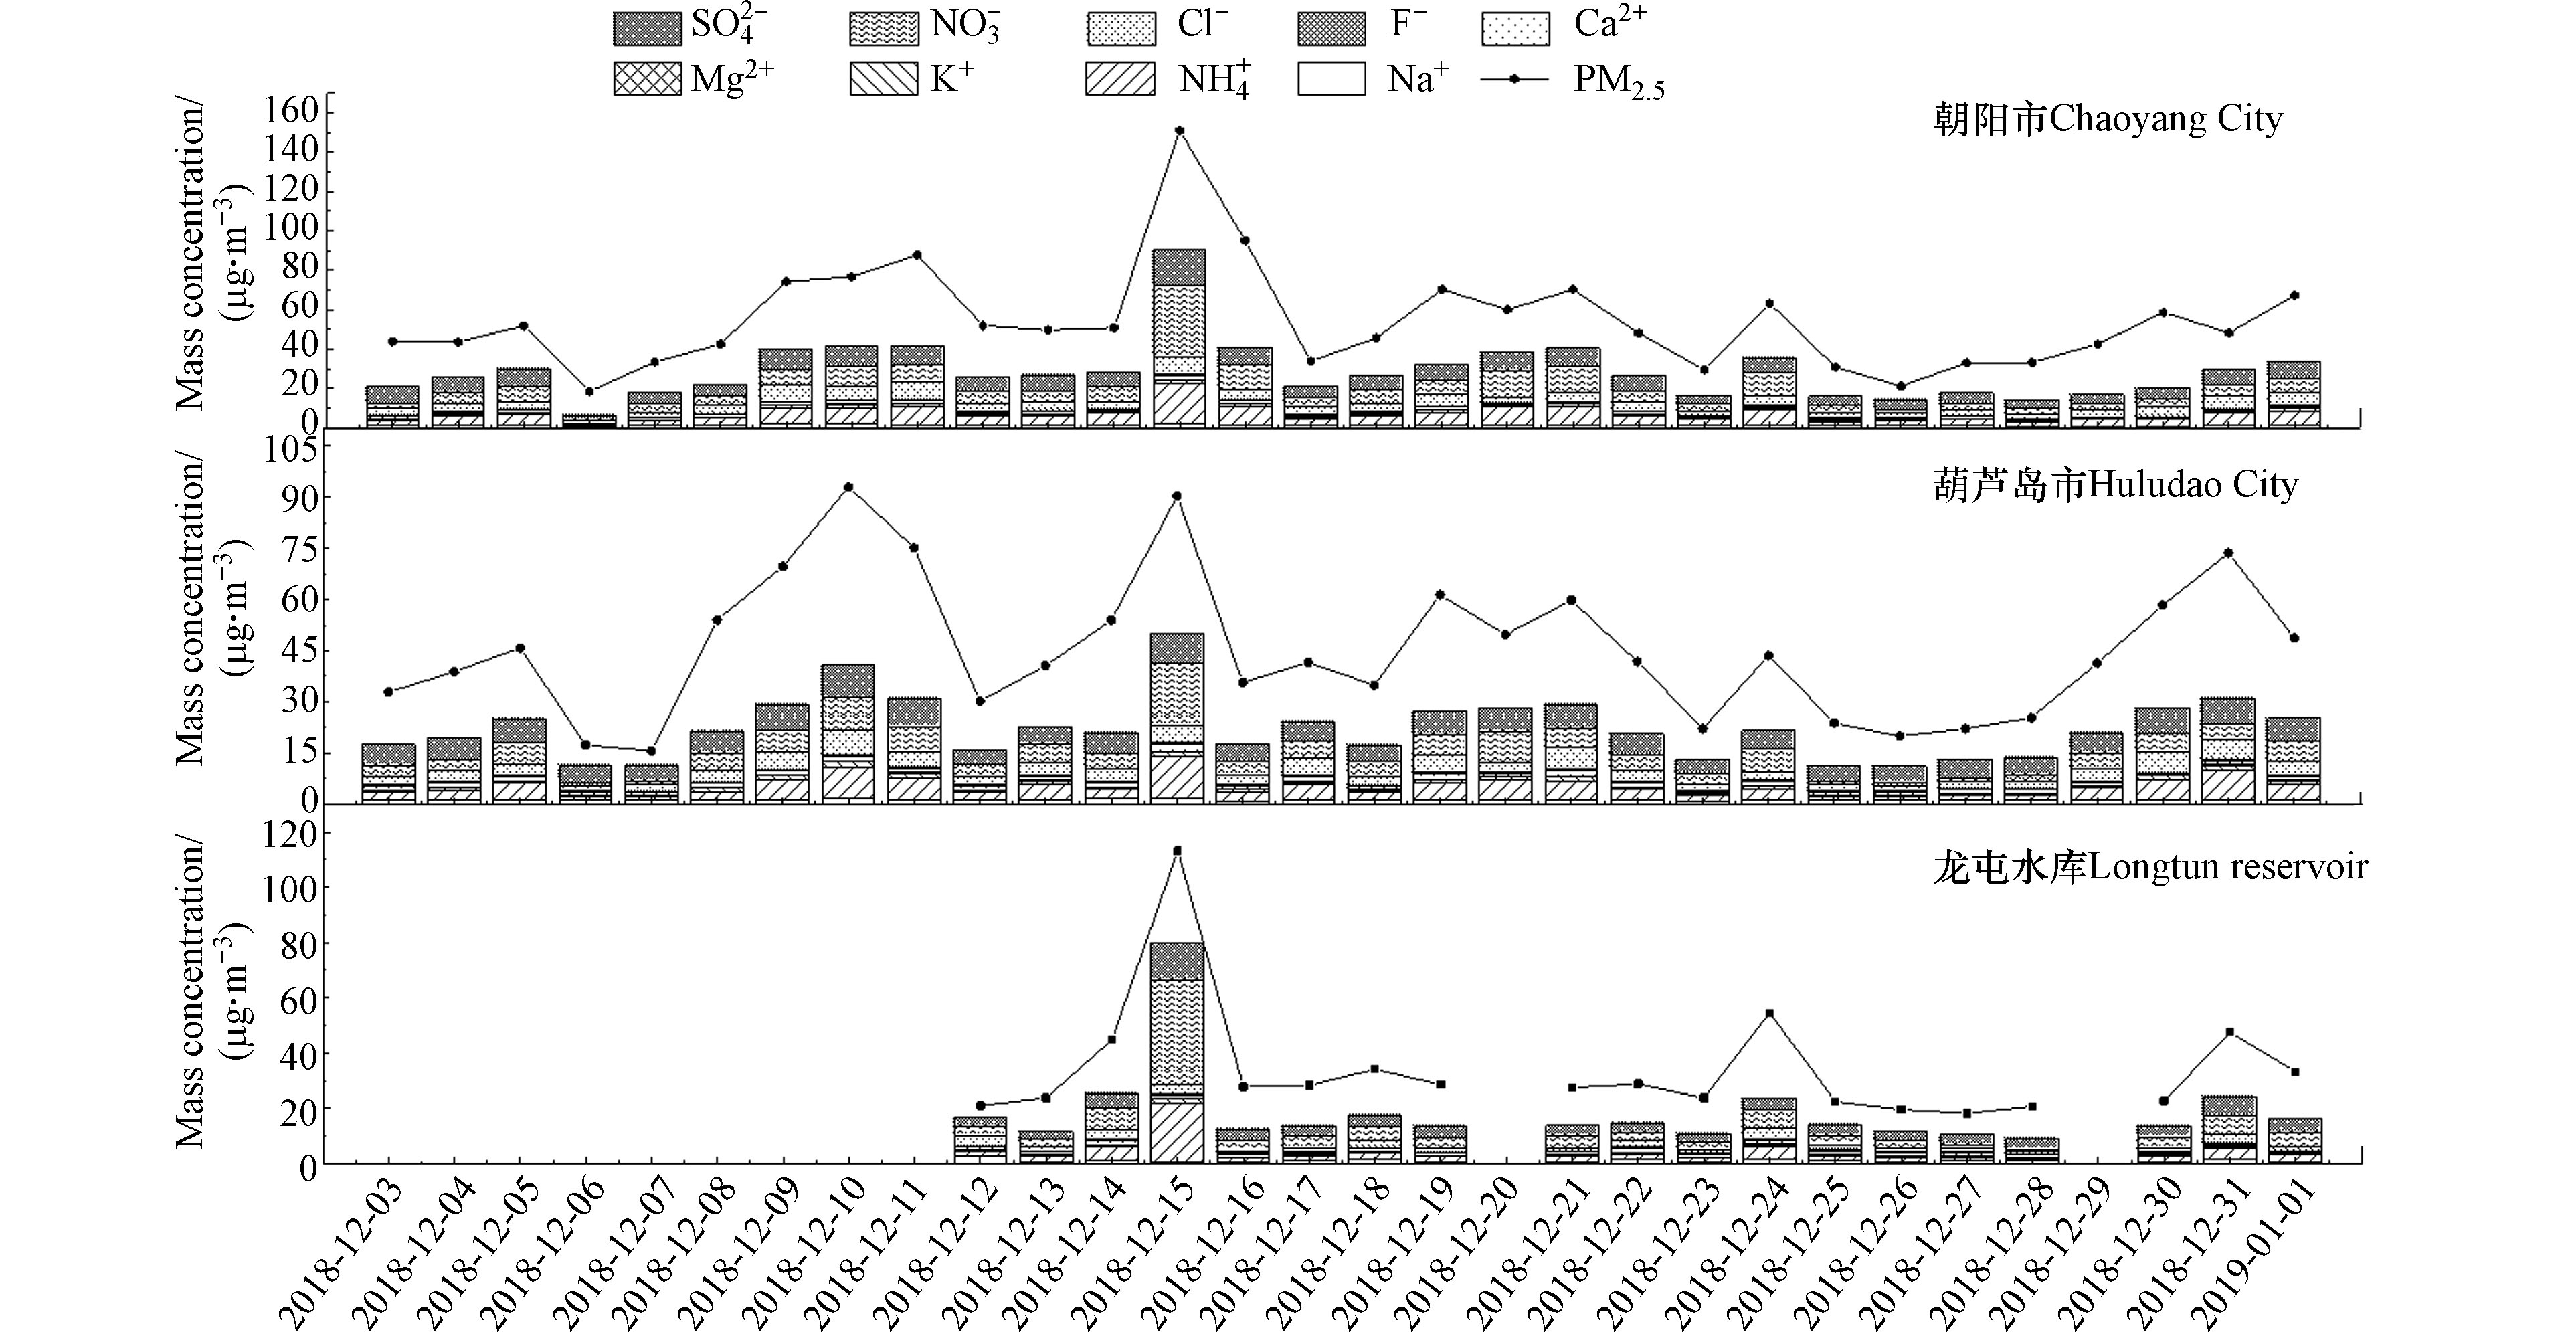
图 1 监测点位PM2.5及各离子变化特征
Figure 1. Monitoring point PM2.5 and the change characteristics of each ion
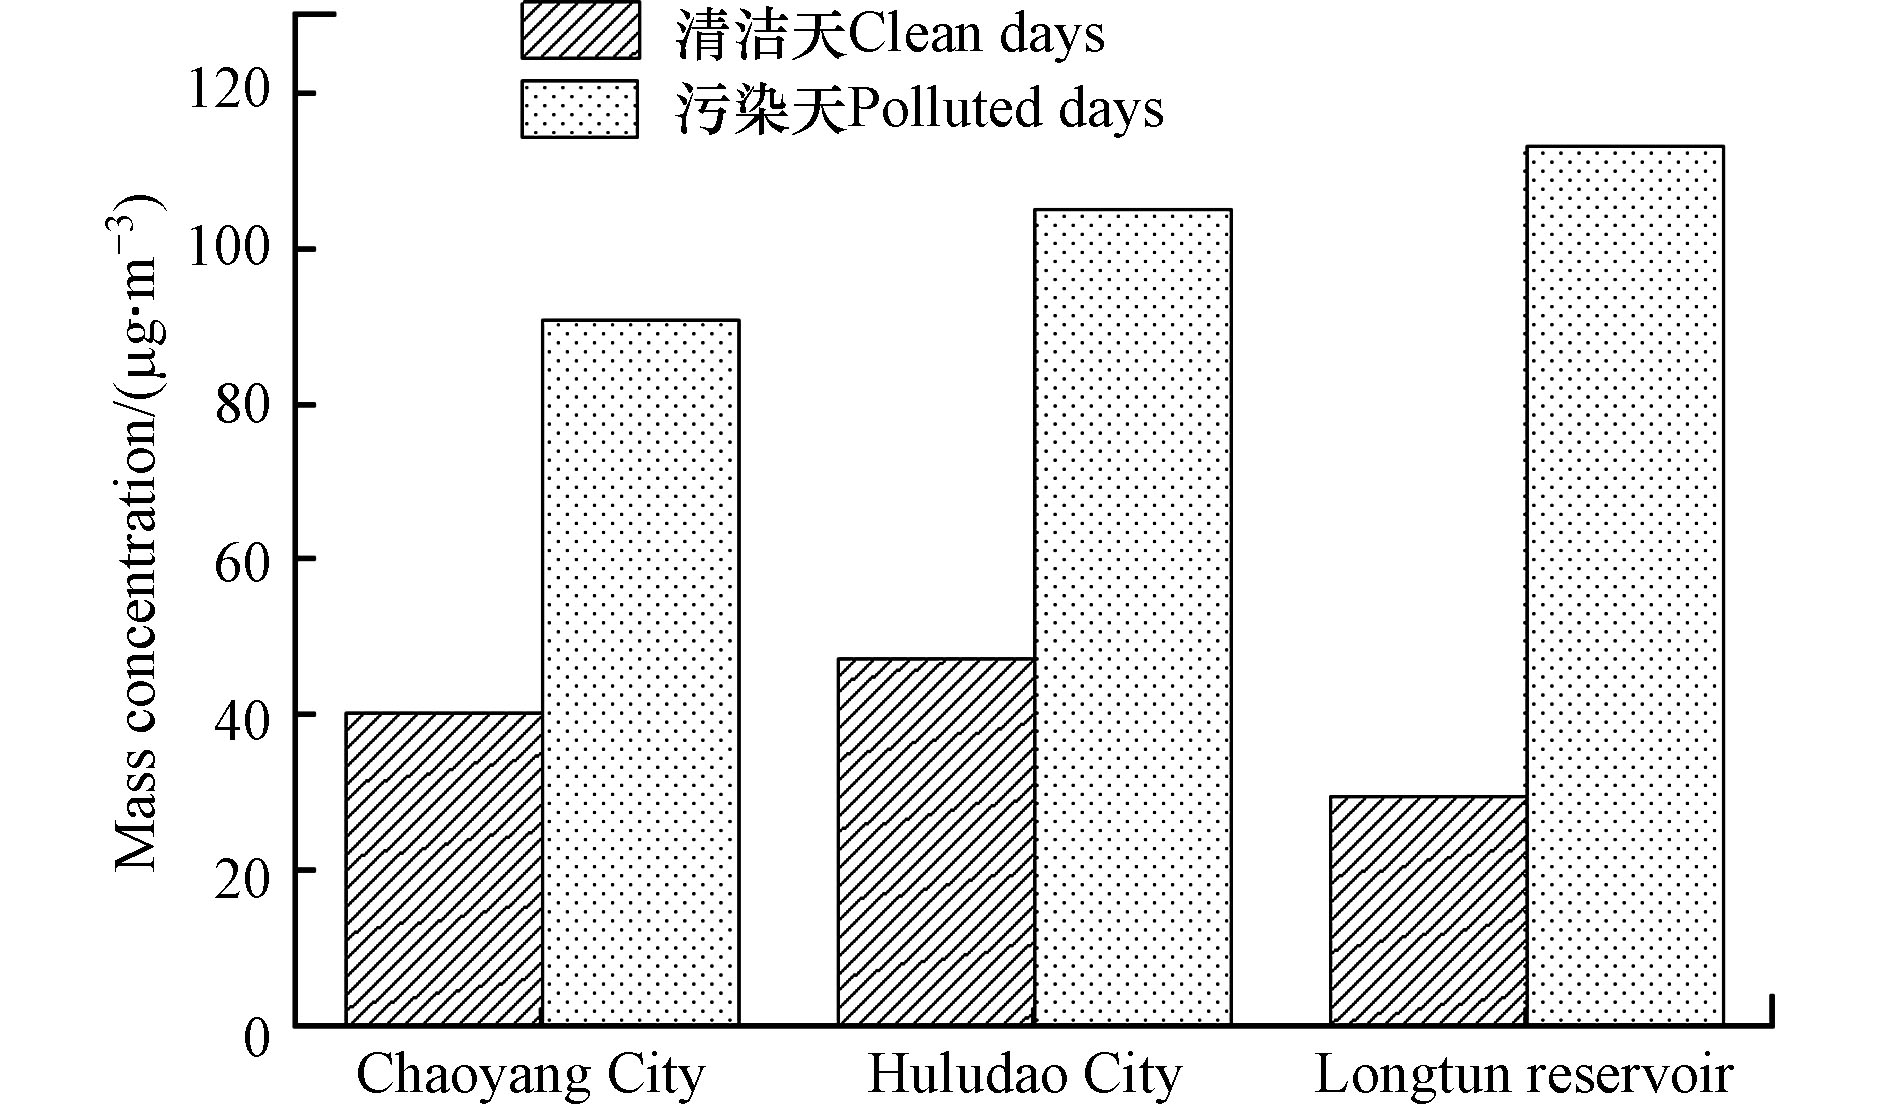
图 2 监测点位清洁天和污染天的PM2.5浓度
Figure 2. Monitoring PM2.5 concentration on clean days and polluted days
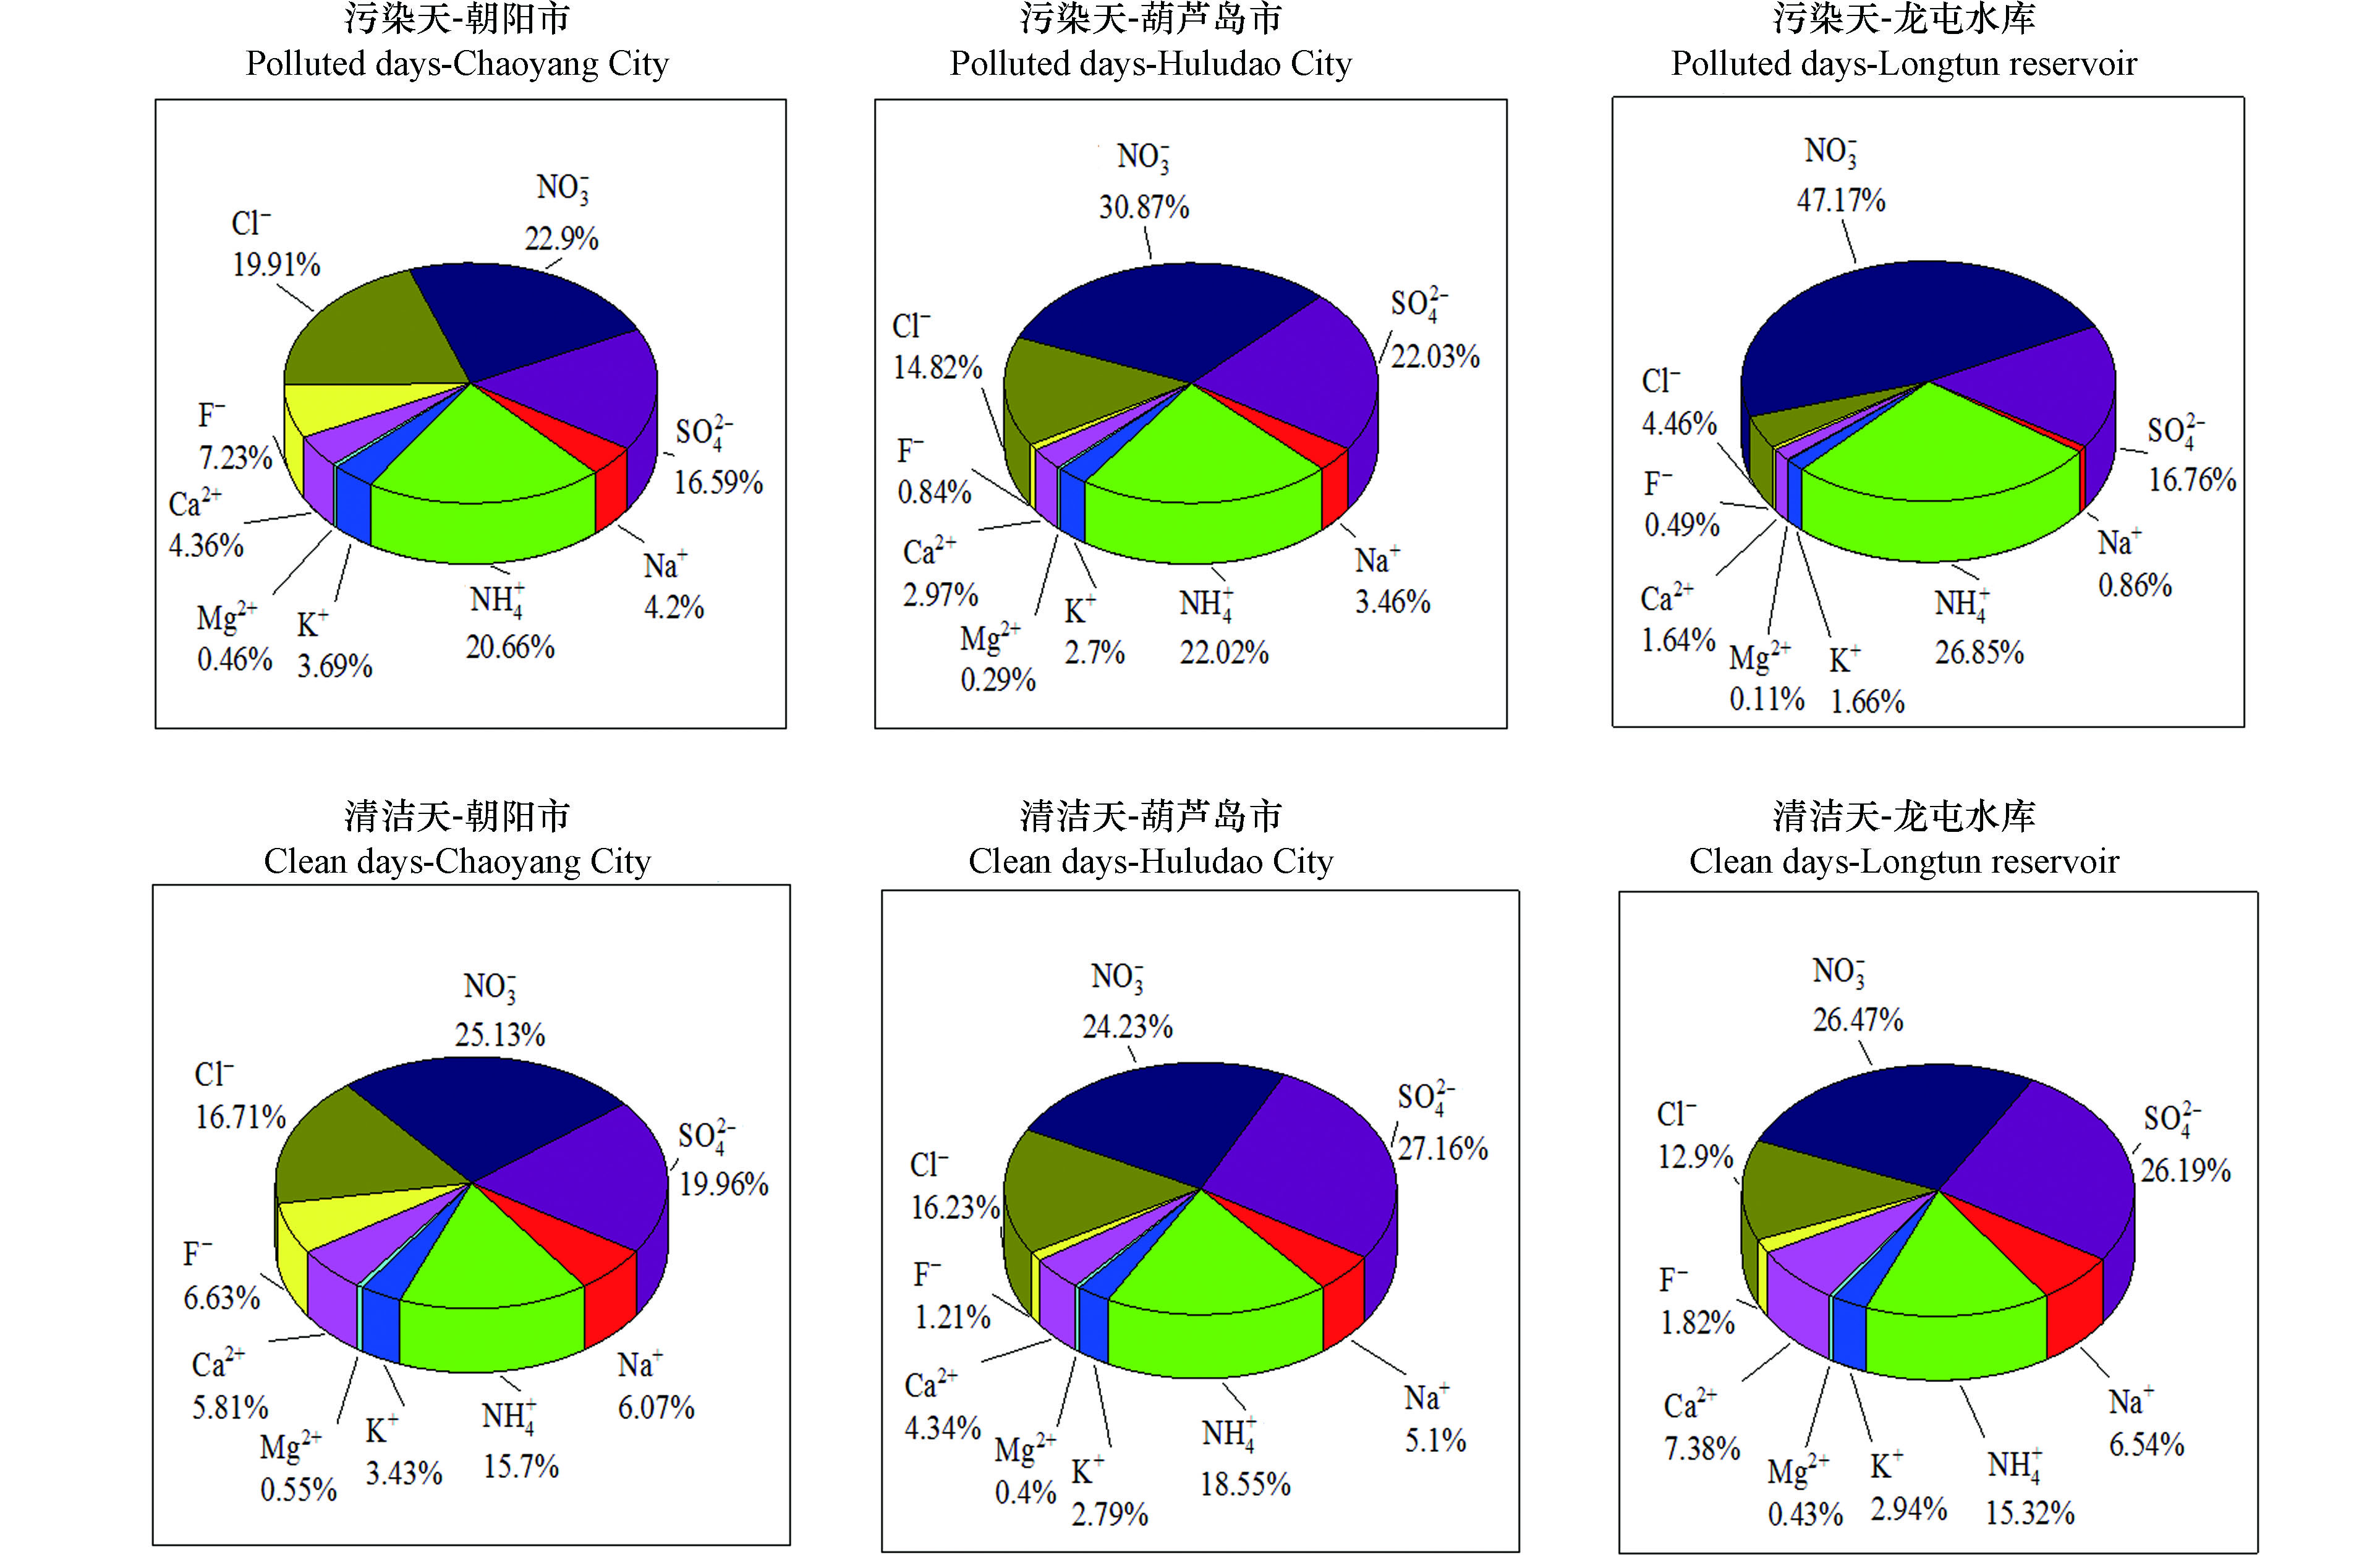
图 3 监测点位污染天与清洁天对比
Figure 3. Comparison of pollution days and clean days at monitoring points
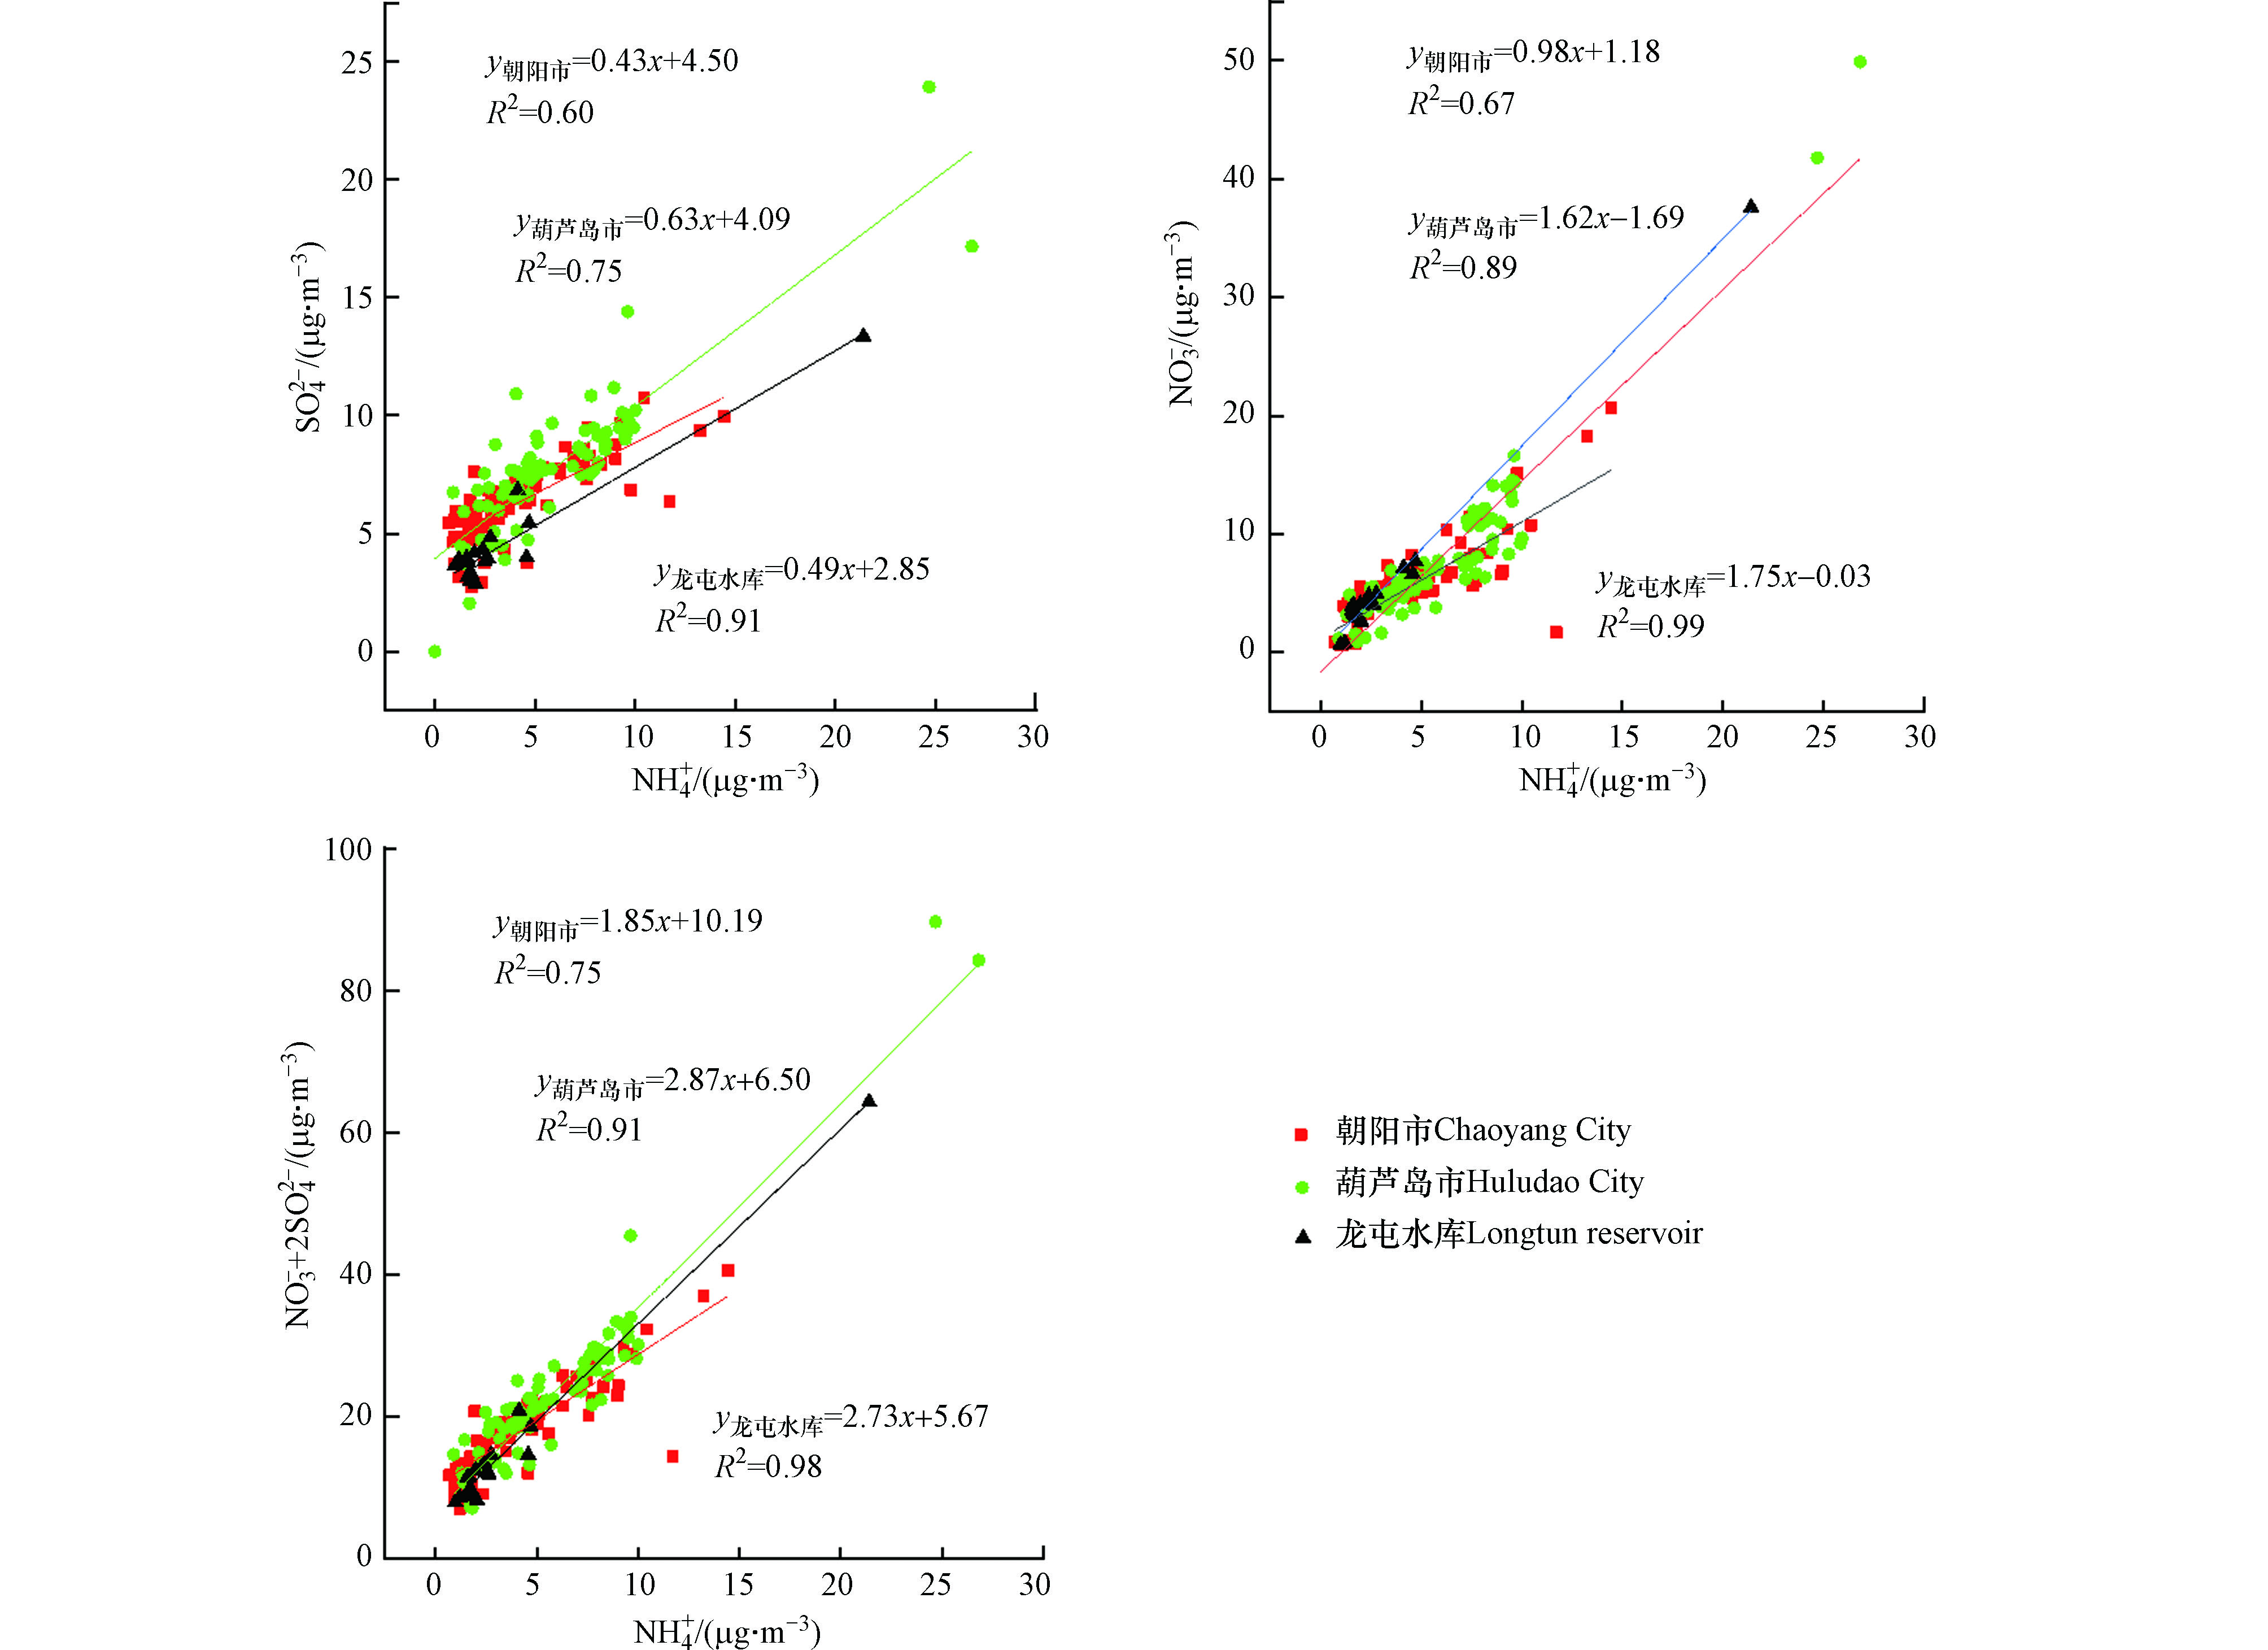
图 4 监测点位
${\rm{NH}}_4^{+ } $ 与${\rm{SO}}_4^{2- } $ 、${\rm{NO}}_3^{- } $ 相关性Figure 4. Correlation between
${\rm{NH}}_4^{+ } $ and${\rm{SO}}_4^{2- } $ 、${\rm{NO}}_3^{- } $ at monitoring points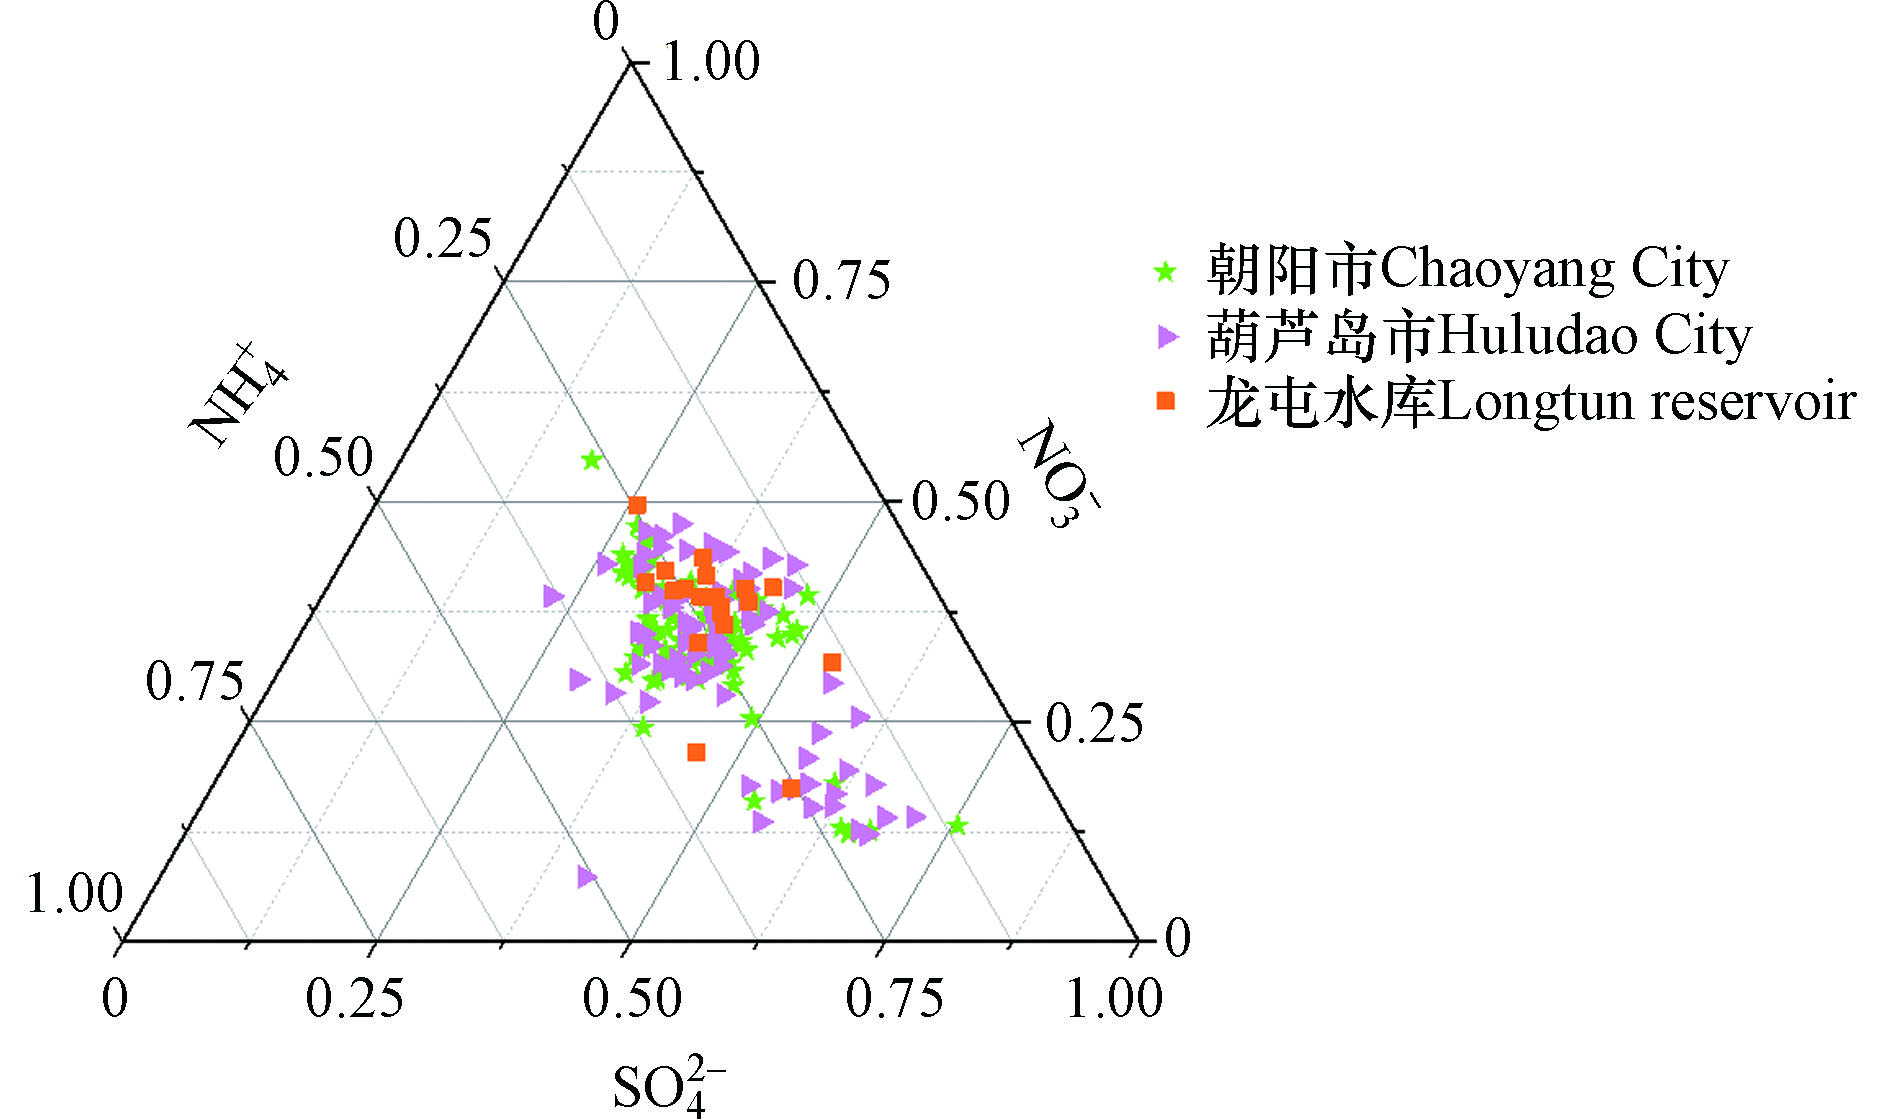
图 5 各监测点位
${\rm{SO}}_4^{2- } $ -${\rm{NO}}_3^{- } $ -${\rm{NH}}_4^{+ } $ 三角图Figure 5. Three monitoring points
${\rm{SO}}_4^{2- } $ -${\rm{NO}}_3^{- } $ -${\rm{NH}}_4^{+ } $ triangle diagram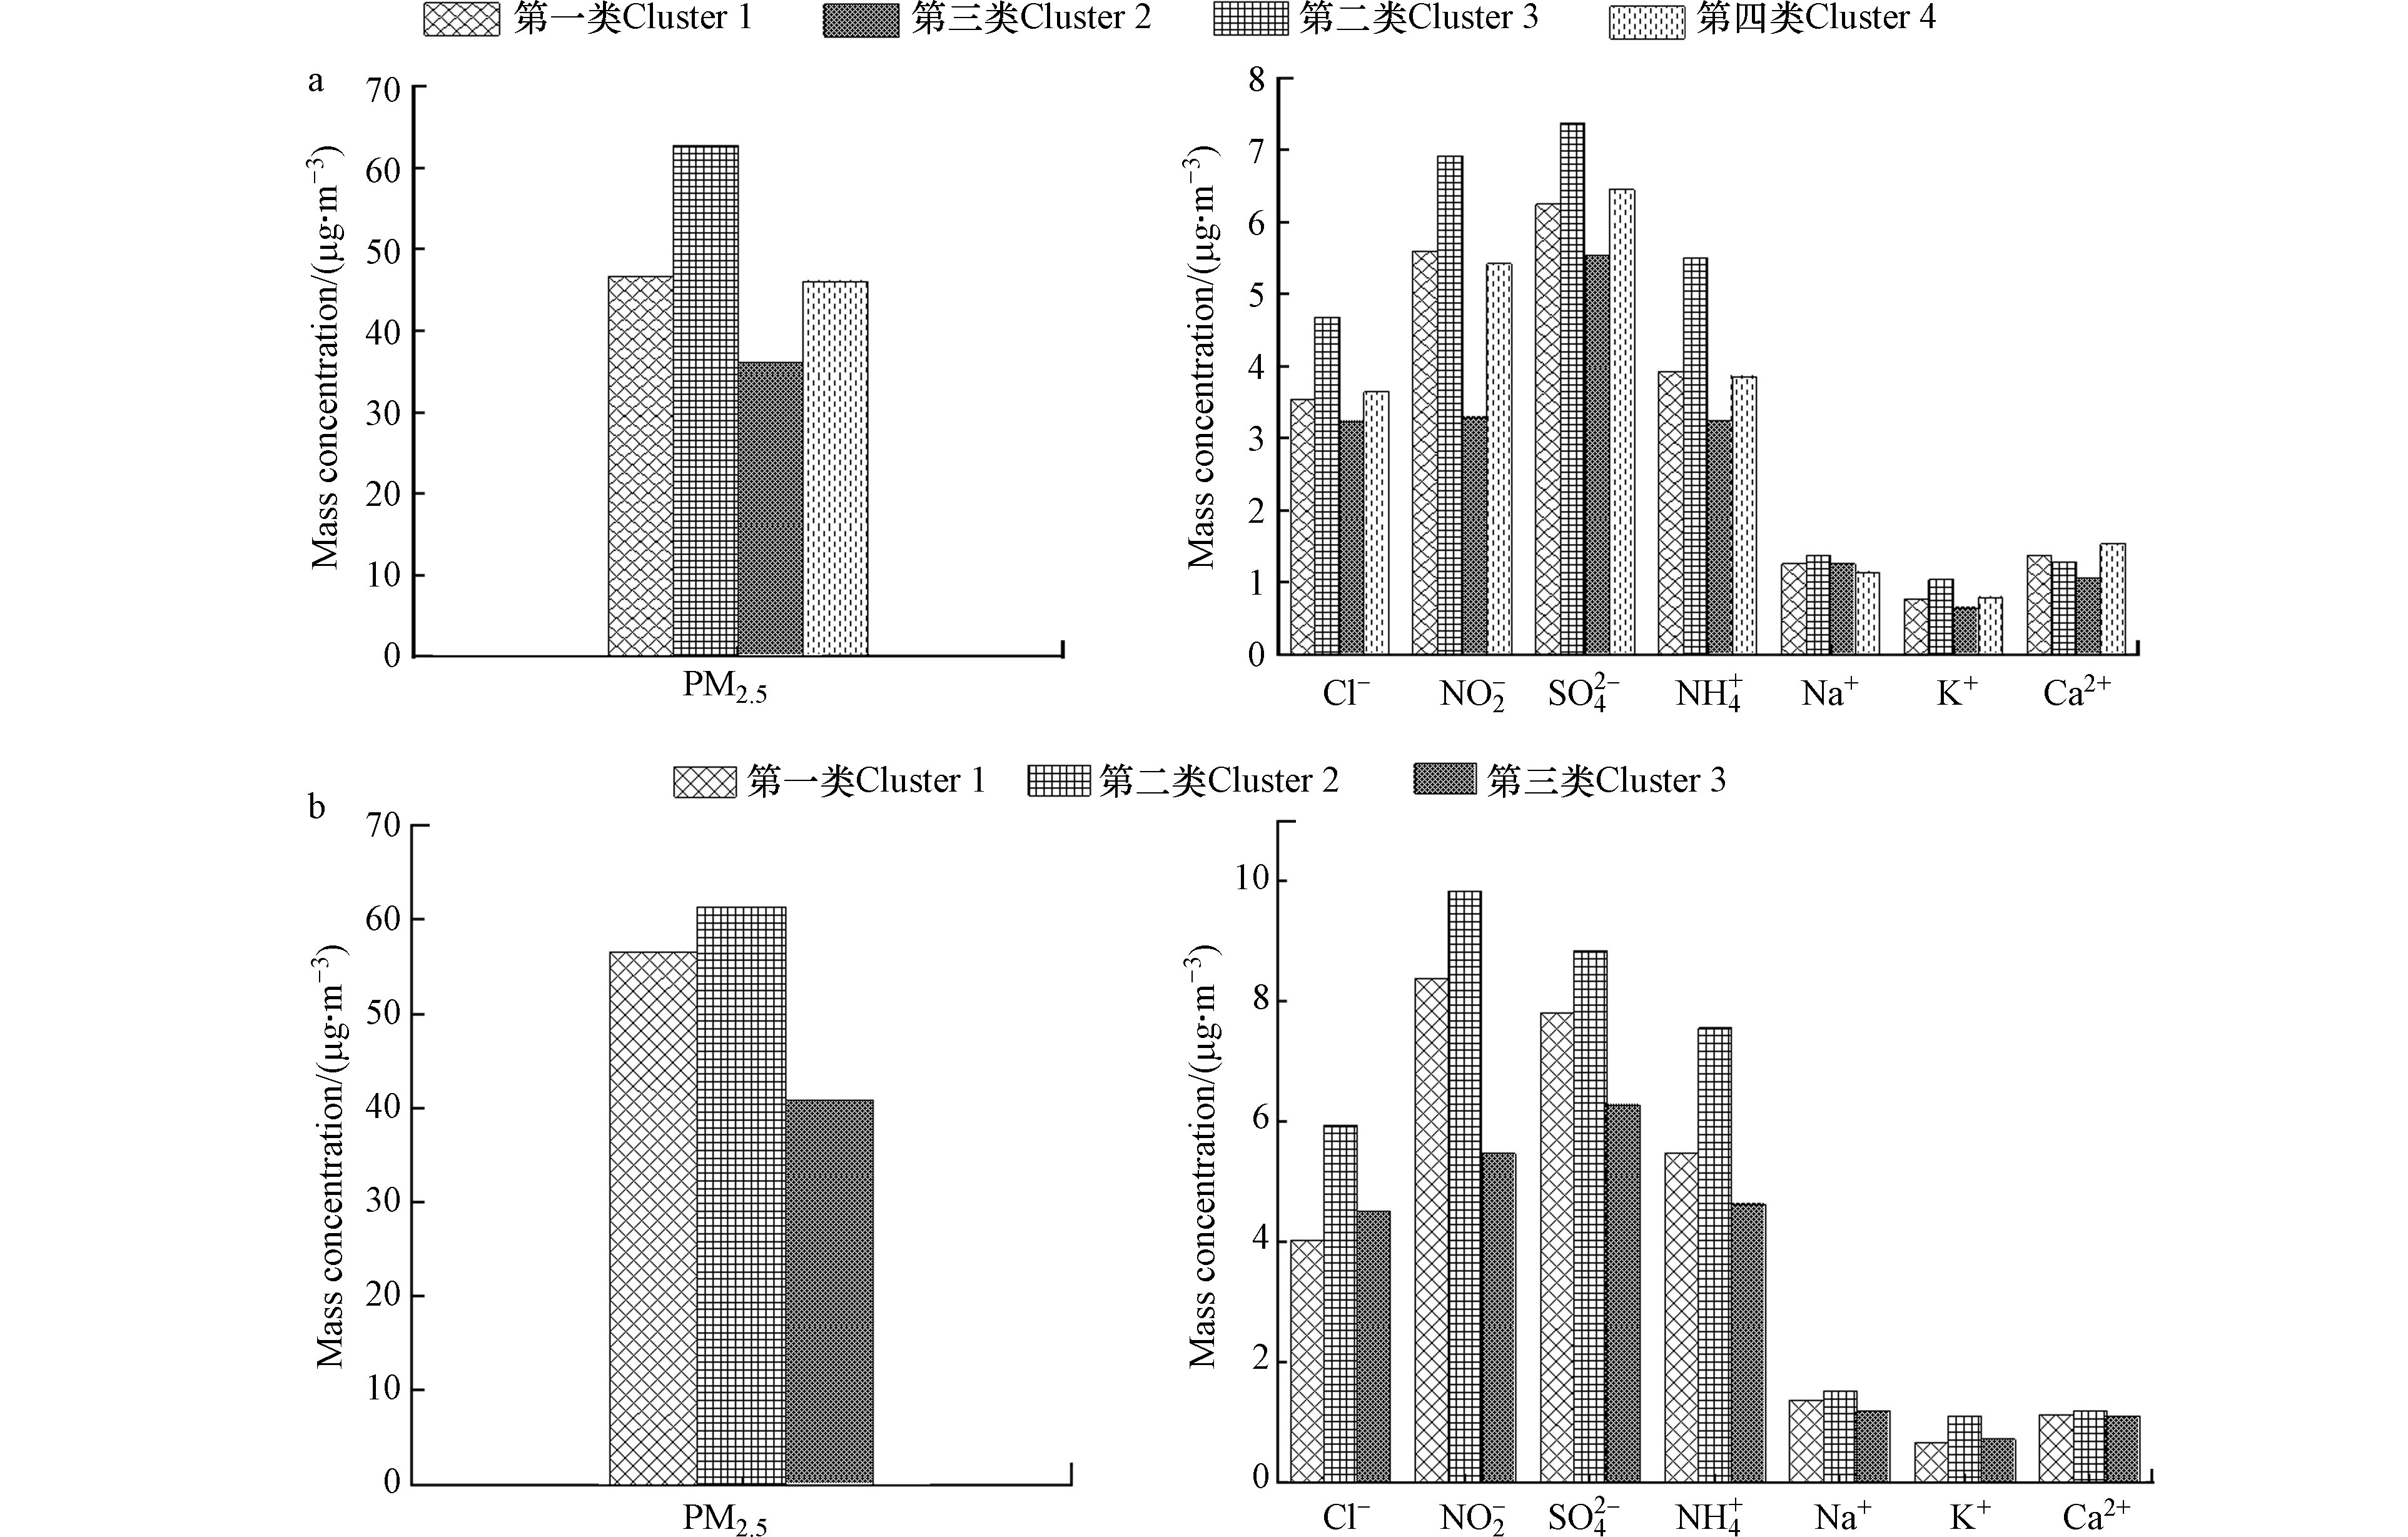
图 6 朝阳市(a)和葫芦岛市(b)不同气团下的化学组成特征
Figure 6. Chemical composition distribution under different air masses in Chaoyang City(a) and Huludao City(b)
表 1 采样点位分布
Table 1. Distribution of sampling points
城市City 采样点Point 经度Longitude 纬度Latitude 周边污染源Pollution sources
葫芦岛市新区 E120°50′1.27″ N40°42′28.26″ 房地 产、交通、生活 龙港区 E120°54′43.4″ N40°42′28.26″ 工业园区 化工街 E120°50′17.7″ N40°42′28.26″ 生活
朝阳市河畔小区 E120°27′9.22″ N40°42′28.26″ 生活 西梁 E120°25′52.6″ N40°42′28.26″ 交通、生活 农业园 E120°22′44.3″ N41°33′28.26″ 景区 葫芦岛市 龙屯水库 E120°05′56.4″ N40°21′54.91″ 无明显污染源  下载: 导出CSV
表 2 DX-120离子色谱的准确度和检出限
Table 2. Accuracy and detection limit of DX-120 ion chromatography
Na+ ${\rm{NH}}_4^{+ } $ K+ Mg2+ Ca2+ Cl− ${\rm{NO}}_4^{- } $ ${\rm{SO}}_4^{2- } $ 检出限/(µmol·L−1) 12.45 1.95 3.15 2.625 4.95 7.2 38.5 69.6 相对偏差/% 0.245 0.09 0.09 0.47 0.49 0.18 2.37 0.71
下载: 导出CSV
表 3 辽宁省与其他城市大气PM2.5及离子质量浓度水平对比(μg·m−3 )
Table 3. Comparison of atmospheric PM2.5 and ion mass concentration levels between Liaoning Province and other cities
日期Date PM2.5 Na+ ${\rm{NH}}_4^{+ } $ K+ Mg2 Ca2+ Cl− ${\rm{NO}}_3^{- } $ ${\rm{SO}}_4^{2- } $ 盘锦[24] 2017 91.0 0.37 6.10 1.13 0.30 0.40 3.47 7.07 7.70 沈阳[25] 2018 0.40 5.5 1.2 0.3 1.9 4.0 6.4 8.8 齐齐哈尔[26] 2014 62.34 0.4 1.3 1.6 0.1 0.4 1.0 1.5 3.5 北京[27] 2018 94.28 3.12 4.56 3.13 2.78 10.97 4.38 21.57 15.11 朝阳(本研究) 2018 45.38 1.24 3.91 0.78 0.12 1.24 4.06 5.51 4.15 葫芦岛 (本研究) 2018 54.25 1.38 5.82 0.82 0.1 1.18 4.73 7.78 7.69
下载: 导出CSV
表 4 不同时期PM2.5及水溶性无机离子的质量浓度
Table 4. Mass concentrations of PM2.5 and water-soluble inorganic ions in different periods
朝阳市(Chaoyang City) 葫芦岛市(Huludao City) 龙屯水库(Longtun reservoir) 污染天Polluted days 清洁天Clean days 污染天Polluted days 清洁天Clean days 污染天Polluted days 清洁天Clean days PM2.5 90.81±9.11 40.09±15.65 105.25±31.38 47.25±15.54 113.17 29.32±10.21 ${\rm{SO}}_4^{2- } $ 5.92±3.65 3.89±2.54 11.94±4.53 6.65±2.04 13.35 4.00±0.95 ${\rm{NO}}_3^{- } $ 8.18±1.98 4.90±2.53 16.73±13.92 5.94±3.34 37.59 4.00±1.88 ${\rm{NH}}_4^{+ } $ 7.38±2.84 3.06±1.96 11.93±6.05 4.54±2.40 21.40 2.31±1.10 Cl− 7.11±4.10 3.26±2.08 8.03±2.11 3.98±1.76 3.55 1.94±1.00 Na+ 1.50±0.15 1.18±0.18 1.87±0.52 1.24±0.42 0.69 0.98±0.63 K+ 1.32±0.32 0.66±0.35 1.46±0.40 0.68±0.33 1.32 0.44±0.18 Mg2+ 0.16±0.03 0.10±0.03 0.16±0.07 0.09±0.07 0.09 0.07±0.02 Ca2+ 1.56±0.33 1.13±0.26 1.61±0.62 1.06±0.34 1.31 1.12±0.35 F− 2.58±0.58 1.29±0.78 0.46±0.16 0.29±0.07 0.39 0.28±0.02
下载: 导出CSV
表 5 朝阳市PM2.5中水溶性离子组分的正交旋转因子荷载矩阵
Table 5. Load matrix of orthogonal rotation factor of water-soluble ion components in PM2.5 of Chaoyang City
因子1(Factor 1) 因子2(Factor 2) 因子3(Factor 3) Na+ 0.759 0.020 0.521 ${\rm{NH}}_4^{+ } $ 0.531 0.770 0.178 K+ 0.722 0.562 0.066 Mg2+ 0.675 0.330 0.108 Ca2+ 0.209 0.249 0.919 F− 0.786 0.401 0.181 Cl− 0.773 0.320 0.285 ${\rm{NO}}_3^{- } $ 0.205 0.914 0.211 ${\rm{SO}}_4^{2- } $ 0.635 0.593 0.194 累积贡献率/% 39% 67% 82%
下载: 导出CSV
表 6 葫芦岛市PM2.5中水溶性离子组分的正交旋转因子荷载矩阵
Table 6. Load matrix of orthogonal rotation factor of water-soluble ion components in PM2.5 of Huludao City
因子1(Factor 1) 因子2(Factor 2) 因子3(Factor 3) Na+ 0.361 0.506 0.474 ${\rm{NH}}_4^{+ } $ 0.823 0.499 0.158 K+ 0.370 0.820 0.275 Mg2+ -0.014 0.296 0.811 Ca2+ 0.547 0.087 0.713 F− 0.480 0.453 0.659 Cl− 0.304 0.829 0.278 ${\rm{NO}}_3^{- } $ 0.909 0.288 0.137 ${\rm{SO}}_4^{2- } $ 0.704 0.445 0.476 累积贡献率/% 32% 59% 84%
下载: 导出CSV
表 7 龙屯水库PM2.5中水溶性离子组分的正交旋转因子荷载矩阵
Table 7. Orthogonal rotation factor load matrix of water-soluble ion components in PM2.5 of Longtun reservoir
因子1(Factor 1) 因子2(Factor 2) 因子3(Factor 3) Na+ −0.057 0.336 0.926 ${\rm{NH}}_4^{+ } $ 0.976 0.161 0.043 K+ 0.852 0.384 0.210 Mg2+ 0.260 0.893 0.260 Ca2+ 0.097 0.911 0.291 F− 0.434 0.745 0.291 Cl− 0.463 0.391 0.772 ${\rm{NO}}_3^{- } $ 0.974 0.109 0.039 ${\rm{SO}}_4^{2- } $ 0.914 0.300 0.132 累积贡献率/% 55% 74% 92%
下载: 导出CSV
表 8 监测点位不同污染状况下SOR和NOR
Table 8. SOR and NOR under different pollution conditions
朝阳市Chaoyang City 葫芦岛市Huludao City 龙屯水库Longtun reservoir 清洁天
Clean days污染天
Polluted days清洁天
Clean days污染天
Polluted days清洁天
Clean days污染天
Polluted daysSOR 0.17 0.13 0.12 0.18 0.29 NOR 0.15 0.17 0.12 0.23 0.21
下载: 导出CSV
表 9 朝阳市和葫芦岛市48h后向轨迹聚类分析
Table 9. Cluster Analysis of 48 hour backward trajectory in Chaoyang City and Huludao City
城市
City类型
Type途径区域
Route area轨迹占比/%
Proportion of tracks
朝阳市1 蒙古国→内蒙古 48.28 2 蒙古国→内蒙古→河北省 17.24 3 俄罗斯→蒙古国→内蒙古 31.03 4 哈萨克斯坦→新疆→蒙古国→内蒙古 3.45
葫芦岛市1 蒙古国→内蒙古 41.38 2 蒙古国→内蒙古→河北省 34.14 3 俄罗斯→蒙古国→内蒙古 24.14
下载: 导出CSV
-
[1] 胡敏. 北京大气细粒子和超细粒子理化特征、来源及形成机制 [M]. 北京: 科学出版社, 2009. HU M. Physical and chemical characteristics, origin and formation mechanism of atmospheric fine and ultra-fine particles in Beijing [M]. Beijing: Science Press, 2009(in Chinese).
[2] CHEN R, CHU C, TAN J, et al. Ambient air pollution and hospital admission in Shanghai, China [J]. Journal of Hazardous Materials, 2010, 181 (1 /3): 234-240. [3] GARCIA-CHEVESICH P A, ALVARADO S, NEARY D G, et al. Respiratory disease andparticulate air pollution in Santiago Chile: Contribution of erosion particles from fine sediments [J]. Environmental Pollution, 2014, 187: 202-205. doi: 10.1016/j.envpol.2013.12.028 [4] 刘庆阳, 刘艳菊, 杨峥, 等. 北京城郊冬季一次大气重污染过程颗粒物的污染特征 [J]. 环境科学学报, 2014, 34(1): 12-18. LIU QY, LIU YJ, YANG Z, et al. Particulate pollution characteristics of a heavy atmospheric pollution process in the suburbs of Beijing in winter [J]. Journal of Environmental Science, 2014, 34(1): 12-18(in Chinese).
[5] KHAN M F, SHIRASUNA Y, HIRANO K, et al. Characterization of PM2.5, PM2.5-10 and PM>10 in ambient air, Yokohama, Japan [J]. Atmospheric Research, 2010, 96(1): 159-172. doi: 10.1016/j.atmosres.2009.12.009 [6] YIN L Q, NIU Z C, CHEN X Q, et al. Characteristics of water-soluble inorganic ions in PM2.5 and PM2.5-10 in the coastal urban agglomeration along the western Taiwan Strait Region, China [J]. Environmental Science and Pollution Research, 2014, 21(7): 5141-5156. doi: 10.1007/s11356-013-2134-7 [7] SHEN Z X, CAO J J, ARIMOTO R, et al. Ionic composition of TSP and PM2.5 during dust storms and air pollution episodes at Xi'an, China [J]. Atmospheric Environment, 2009, 43(18): 2911-2918. doi: 10.1016/j.atmosenv.2009.03.005 [8] ZHANG J Q, WANG S L, LUO D T, et al. Characterization and source analysis of PM2.5 and water-soluble ions during winter in Liaocheng City [J]. Research of Environmental Sciences, 2018, 31(10): 1712-1718. [9] WANG Y, ZHUANG G S, TANG A H, et al. The ionchemistry and the source of PM2.5 aerosol in Beijing [J]. Atmospheric Environment, 2005, 39(21): 3771-3784. doi: 10.1016/j.atmosenv.2005.03.013 [10] 郑敬茹, 翟厚淑, 付山, 等. 黄石市大气PM2.5中水溶性离子浓度特征及来源分析 [J]. 环境科学研究, 2019, 32(7): 1170-1177. ZHENG J R, ZHAI H S, FU S, et al. Concentration characteristics and source analysis of water-soluble ions in atmospheric PM2.5 in Huangshi City [J]. Environmental Science Research, 2019, 32(7): 1170-1177(in Chinese).
[11] 陈程, 张丽, 姚瑶, 等. 连云港春季PM2.5中主要水溶性无机离子污染特征及来源解析 [J]. 环境监测与预警, 2019, 11(6): 41-46. CHEN C, ZHANG L, YAO Y, et al. Pollution characteristics and source analysis of main water-soluble inorganic ions in spring PM2.5 of Lianyungang [J]. Environmental Monitoring and Early Warning, 2019, 11 (6): 41-46(in Chinese).
[12] YANG D Y, LIU B X, ZHANG D W, et al. Correlation, seasonal and temporal variation of water-soluble ions of PM2.5 in Beijing during 2012-2013 [J]. Environmental Science, 2015, 36(3): 768-773. [13] 杜青清, 吴丽萍, 赵雪艳, 等. 临沂市冬季环境空气 PM2.5 中水溶性离子污染特征及来源分析 [J]. 环境科学研究, 2019 , 32 (8): 1348 - 1357 . DU Qingqing, WU Liping, ZHAO Xueyan, et al. Characteristics and sources analysis of water-soluble inorganic ions of ambient air PM2.5 in winter in Linyi City [J]. Research of Environmental Sciences, 2019, 32(8): 1348-1357.
[14] HONG Y, LI C, LI X, et al. Analysis of compositional variation and source characteristics of water-soluble ions in PM2.5 during several winter-haze pollution episodes in Shenyang, China [J]. Atmosphere, 2018, 9(7): 280. doi: 10.3390/atmos9070280 [15] CALVO A I, ALVES C, CASTRO A, et al. Research on aerosol sources and chemical composition: Past current and emerging issues [J]. Atmospheric Research, 2013, 120-121(5): 1-28. [16] SEKINE Y, TAKAHASHI N, OHKOSHI Y, et al. Measurement of PM2.5 and water-soluble ions at central Tokyo, Japan and source apportionment [J]. The Global Environmental Engineers, 2015, 2(2): 71-78. [17] ZHAO P S, DONG F, HE D, et al. Characteristics of concentrations and chemical compositions for PM2.5 in the region of Beijing, Tianjin, and Hebei, China [J]. Atmospheric Chemistry& Physics, 2013, 13(1): 4631-4644. [18] TAO J, CHENG T T, ZHANG R J. Chemical composition of summertime PM and its relationship to aerosol optical properties in Guangzhou, China [J]. Atmospheric& Oceanic Science Letters, 2015, 5(2): 88-94. [19] TAO J, GAO J, ZHANG L, et al. PM2.5 pollution in a megacity of southwest China: source apportionment and implication [J]. Atmospheric Chemistry& Physics, 2014, 14(4): 8679-8699. [20] 刀谞, 张霖琳, 王超, 等. 京津冀冬季与夏季PM2.5 /PM10及其水溶性离子组分区域性污染特征分析 [J]. 环境化学, 2015, 34(1): 60-69. doi: 10.7524/j.issn.0254-6108.2015.01.2014032603 DAO K, ZHANG LL, WANG C, et al. Analysis of regional pollution characteristics of PM2.5/PM10 and its water-soluble ion groups in Beijing, Tianjin and Hebei in winter and summer [J]. Environmental Chemistry, 2015, 34(1): 60-69(in Chinese). doi: 10.7524/j.issn.0254-6108.2015.01.2014032603
[21] 唐喜斌, 黄成, 楼晟荣, 等. 长三角地区秸秆燃烧排放因子与颗粒物成分谱研究 [J]. 环境科学, 2014, 35(5): 1623-1632. TANG X B, HUANG C, LOU S R, et al. Study on emission factors and particulate matter composition spectrum of straw combustion in Yangtze River Delta [J]. Environmental Science, 2014, 35(5): 1623-1632(in Chinese).
[22] 张礁石, 陆亦怀, 桂华侨, 等. APEC会议前后北京地区PM2. 5污染特征及气象影响因素 [J]. 环境科学研究, 2016, 29(5): 646-653. ZHANG J S, LU Y H, GUI H Q, et al. Beijing area PM2.5 before and after APEC meeting pollution characteristics and meteorological influencing factors [J]. Environmental Science Research, 2016, June 29 (5): 646-653(in Chinese).
[23] 李英红. 兰州市大气细颗粒物( PM2. 5)化学成分污染特征及来源分析 [D]. 兰州: 兰州大学, 2015. LI Y H. Pollution characteristics and sources of atmospheric fine particles (PM2.5) in Lanzhou [D]. Lanzhou: Lanzhou University, 2015(in Chinese).
[24] 张 蕾, 姬亚芹, 王士宝, 等. 盘锦市冬季PM2.5水溶性离子特征及来源分析 [J]. 环境科学, 2018, 39(6): 2527-2527. ZHANG L, JI Y Q, WANG S B, et al. Analysis on the characteristics and sources of water-soluble ions of PM2.5 in winter in Panjin [J]. Environmental Science, 2018, 39(6): 2527-2527(in Chinese).
[25] 张永运, 王宏青, 肖浩. 等. 东北亚冬季PM2.5水溶性离子空间分布特征及来源 [J]. 中国环境科学, 2019, 39(6): 2291-2298. doi: 10.3969/j.issn.1000-6923.2019.06.007 ZHANG Y Y, WANG H Q, XIAO H,et al. Wait. Spatial distribution characteristics and sources of water-soluble ions of PM2.5 in Northeast Asia in winter [J]. China Environmental Science, 2019, 39(6): 2291-2298(in Chinese). doi: 10.3969/j.issn.1000-6923.2019.06.007
[26] 田景芝, 吕健, 郑永杰, 等. 齐齐哈尔市PM2.5 中水溶性离子的测定及来源分析 [J]. 科技通报, 2016, 32(8): 221-226. doi: 10.3969/j.issn.1001-7119.2016.08.050 TIAN J Z, LU J, ZHENG Y J, et al. Determination and source analysis of water-soluble ions in PM2.5 in Qiqihar [J]. Science and Technology Bulletin, 2016, 32(8): 221-226(in Chinese). doi: 10.3969/j.issn.1001-7119.2016.08.050
[27] 施云云, 杨欧, 杨巧文, 等. 北京市典型城区冬季PM2.5水溶性离子特征 [J]. 矿业科学学报, 2020, 5(2): 219-231. SHI Y Y, YANG O, YANG Q W, et al. Characteristics of water-soluble ions of PM2.5 in typical urban areas of Beijing in winter [J]. Journal of Mining Science, 2020, 5(2): 219-231(in Chinese).
[28] 贺克斌, 杨复沫, 段凤魁, 等. 大气颗粒物与区域复合污染 [M]. 北京: 科学出版社, 2011: 234-235. HE K B, YANG F M, DUAN F K, et al. Atmospheric particulate matter and regional compound pollution [M]. Beijing: Science Press, 2011 234-235(in Chinese).
[29] 马金珠, 刘永春, 马庆鑫, 等. 大气非均相反应及其环境效应 [J]. 环境化学, 2011, 30(1): 97-119. MA J Z, LIU Y C, MA Q X, et al. Atmospheric heterogeneous reaction and its environmental effects [J]. Environmental Chemistry, 2011 Jol 30 (1): 97-119(in Chinese).
[30] 张棕巍, 胡恭任, 于瑞莲, 等. 厦门市大气PM2. 5中水溶性离子污染特征及来源解析 [J]. 中国环境科学, 2016, 36(7): 1947-1 954. ZhANG Z W, HU G R, YU R L, et al. Pollution characteristics and source analysis of water-soluble ions in atmospheric PM2.5 in Xiamen [J]. China Environmental Science, 2016. 36 (7): 1947-1954(in Chinese).
[31] 张立盛, 石广玉. 相对湿度对气溶胶辐射特性和辐射强迫的影响 [J]. 气象学报. ZhANG LS, SHI G Y. Effect of relative humidity on radiative characteristics and radiative forcing of aerosols [J]. Journal of Meteorology(in Chinese).
[32] HUANG X J, LIU Z R, ZHANG J K, et al. Seasonal variation and secondary formation of size-segregated aerosol water-soluble inorganic ions during pollution episodes in Beijing [J]. Atmospheric Research, 2016, 168: 70-79. doi: 10.1016/j.atmosres.2015.08.021 [33] WATSON J G, CHOW J C, LURMANN F W, et al. Ammonium nitrate, nitric acid, and ammoniaequilibrium in wintertime phoenix, Arizona [J]. Journal of the Air & Waste Management Association, 1994, 44(4): 405-412. [34] SHON Z, KIM K, SONG S, et al. Relationship between water-soluble ions in PM2.5 and their precursor gases in seoul megacity [J]. Atmospheric Environment, 2012, 59: 540-550. doi: 10.1016/j.atmosenv.2012.04.033 [35] 李华, 范淑霞, 张勇, 等. 南京市区和郊区PM10和PM2.1中多环芳烃的特征及影响因素 [J]. 中国环境科学, 2017, (1): 60 - 68. Li H, Fan S X, Zhang Y, et al. Characteristics and influence factors of PAHs in PM10 and PM2. 1 in urban and suburban Nanjing, China [J]. China Environmental Science, 2017, 37(1) : 60-68.
[36] ZHAO K L, LIU X C, LU H, et al. Characteristics and sources of water-soluble ions of PM2.5 in winter in Urumqi [J]. Journal of Desert Research, 2015, 35(3): 707-714. [37] WANGY Q, ZHANG X Y, DRAXLER R. TrajStat: GIS-based software that uses various trajectory statistical analysis methods to identify potential sources from long-term air pollution measurement data [J]. Environmental Modelling and Software, 2009, 24(8): 938-939. doi: 10.1016/j.envsoft.2009.01.004 -
 点击查看大图
计量
- 文章访问数: 3476
- HTML全文浏览数: 3476
- PDF下载数: 101
- 施引文献: 0


