-
人工合成的有机化学品(如杀虫剂、药物和各种工业化学品)在促进社会发展、改善人类生活质量方面发挥了重要作用。Wang等[1]近期统计,目前全球市场上使用的化学品数量已达35万种。这些化学品在其整个生命周期中,都可能被释放到环境中,威胁生态系统和人类健康[1-2]。具有持久性(persistence)、生物累积性(bioaccumulation)、毒性(toxicity)的化学品,已经成为影响人体与生态健康的重要风险源[3-4]。我国《新化学物质环境管理登记指南》中明确规定应当重点管控具有PBT属性的化学物质[5]。其中,生物累积是指生物从环境和膳食(含吞食低营养级生物)中积累化学物质,使其体内该化学物质的浓度超过周围环境中浓度的现象[6]。生物富集作为生物累积的类型之一,是指生物从周围环境中摄取某种化学物质,使其体内浓度超过周围环境中浓度的现象[6]。生物富集常用生物富集因子(BCF)来表征,BCF为化学物质在生物体内的浓度与其在环境介质中平衡浓度之比[7]。欧盟化学品注册、评估、许可和限制(REACH)法规规定,BCF是筛查生物累积性物质的重要指标之一[8]。
鱼类是水生态系统的关键物种,其体内污染物的积累程度对其他生物、甚至人类健康具有重要影响[9]。传统上,鱼体BCF的测定,可遵循经济合作与发展组织(OECD)发布的“流水式鱼类生物富集测试指南(OECD指南305)”[10]。通过该方法,虽可测得一些化学品的BCF数据,但存在测试周期长、费用高、动物实验伦理等问题,无法满足对大量商用化学品进行风险管理的现实需求[9]。因此,需要发展快速高效的替代方法来获取BCF数据。
定量构效关系(QSAR)模型,作为计算毒理学技术的核心内容,可以快速高通量地获取化学品环境暴露与危害性的相关信息[11]。QSAR通过函数或映射关系将分子结构描述符(描述分子结构特征的参数)和预测终点联系起来[11]。早期BCF的QSAR预测模型,主要基于分子的理化参数、碎片参数、溶剂化参数等物理意义明确的描述符而构建,多为线性模型[12-14]。近年来,各种机器学习算法被用于QSAR模型的构建[15-18]。2019年,Miller等[19]建立并比较了24种可用于预测BCF的线性模型(如最小二乘回归、偏最小二乘回归和岭回归)和非线性模型(如随机森林、支持向量机和多层感知机),发现大多数非线性模型对BCF的预测效果比线性模型好。
随着机器学习算法不断发展,集成模型出现并得到应用。集成模型通过投票法、平均法或学习法将多个单独模型的信息整合在一起,有望产生更准确、更稳健的预测结果[20-22]。Valsecchi等[20]发现,相对于单一模型,集成模型具有减少预测不确定性、拓宽模型应用域等优点;Li等[21]发现集成模型能够增加模型多样性并减少过拟合。集成模型在预测化学品毒性方面已有应用,如鱼类半数致死浓度(LC50)和无观测效应浓度(NOEC)的集成模型等[22]。然而,关于BCF的集成模型研究还不多见。
本研究搜集整理鱼体BCF数据并构建了数据库,计算了4000多种分子描述符,选择5种机器学习算法建立了预测BCF的单一模型,进而构建了集成模型。依据OECD关于QSAR模型构建和验证的导则[23],评价了模型的稳健性和预测能力,并进行了应用域表征。
基于集成学习算法构建有机化学品鱼体生物富集因子的QSAR预测模型
Using ensemble learning algorithms to develop QSAR models on bioconcentration factors of organic chemicals in multispecies fish
-
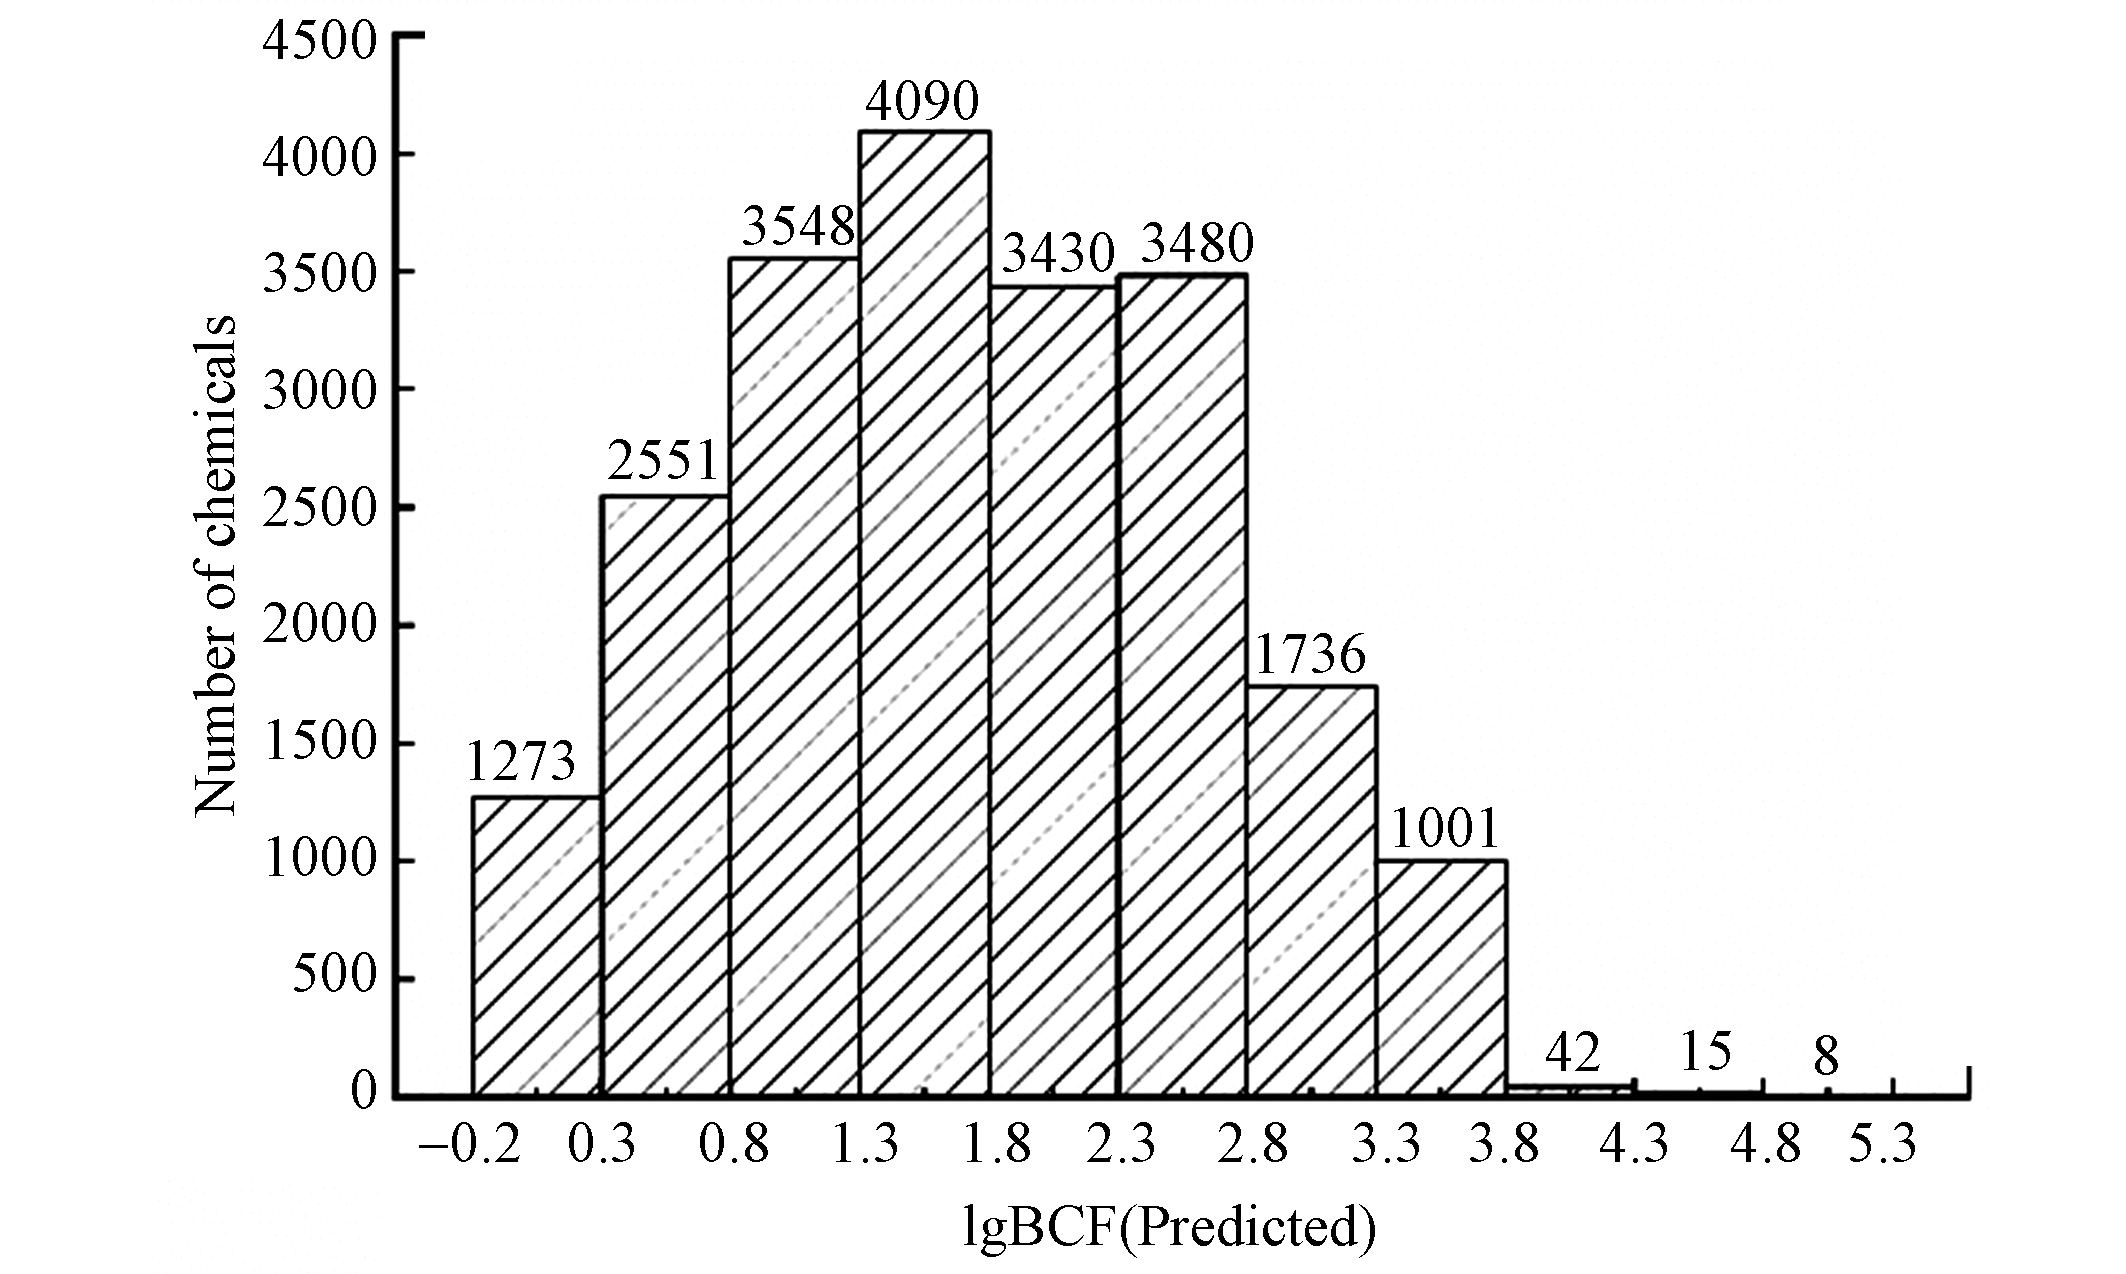
摘要: 生物富集因子(BCF)是评价化学品生物累积能力的重要参数。目前全球市场上使用的化学品数量已超过了35万种,但是只有一千多种化学品具有BCF值。定量构效关系(QSAR)模型被认为是一种有效填补数据空缺的方法。目前大多数预测BCF的QSAR模型为单一模型,而集成模型可能会对BCF的预测效果有所改进。本研究建立了一个全面的鱼类BCF数据库,涵盖1300多种有机化学品的BCF实测值。基于此数据库,依据QSAR模型构建和验证导则,使用多种机器学习算法建立了预测鱼类BCF的5种单一模型和11种集成模型。结果表明,与单一模型相比,集成模型具有更好的拟合能力、稳健性、预测准确性以及更广泛的应用域。进一步使用最优集成模型对《中国现有化学物质清单》(IECSC)中化学物质的BCF进行了预测,结果表明该清单中有1066种化学物质具有生物累积性,86种化学物质具有强生物累积性。本研究所构建的模型可为化学品生物累积能力评估提供必要数据,支持化学品风险评价与管理工作。Abstract: Bioconcentration factor (BCF) is a key parameter characterizing bioaccumulation of chemicals in organisms. Nevertheless, only around one thousand chemicals have BCF values, in contrast to over 350 000 chemicals that have been registered for production and application in the global market. Quantitative structure-activity relationship (QSAR) models are regarded as an efficient method to fill the data gap. However, majority of QSAR models on BCF are individual models, while ensemble models may have improved capabilities on BCF prediction. In this study, a comprehensive fish BCF database was constructed, covering empirical BCF values of more than 1300 organic chemicals. Based on the database, 5 individual QSAR models and 11 ensemble models were developed on BCF of organic compounds in fish using machine learning algorithms, following the guidelines on development and validation of QSARs proposed by the OECD. Results show the ensemble models have better goodness-of-fit, robustness, predictability and wider application domain than the individual models. The optimum ensemble model was further employed to predict BCF for chemicals in the inventory of existing chemical substances of China (IECSC), showing that 1066 chemicals in the inventory are bioaccumulative, and 86 chemicals are very bioaccumulative. The models can provide necessary data for evaluating the bioaccumulation capacity of chemicals and support sound chemicals management.
-
表 1 分子描述符的类型及含义
Table 1. Type and description of the molecular descriptors
编号
IndexOLS模型中对应系数
Coefficient in OLS model描述符名称
Descriptor name类型及含义
Type and descriptionD1 −0.933 BLTF96 与正辛醇/水分配系数相关的基本描述符 D2 −0.438 SpPosA_Dz(m) 相对分子质量加权的2D矩阵描述符 D3 0.342 Cl-089 与C(sp2)相连的Cl原子中心碎片描述符 D4 −0.325 SpMax1_Bh(s) 与分子中原子连接相关的2D矩阵描述符 D5 0.217 B07[C-C] 表示拓扑距离7处是否存在C—C结构的2D原子对描述符 D6 0.317 F02[C-O] 描述拓扑距离2处C—O结构出现频率的2D原子对描述符 D7 −0.130 B04[O-Cl] 表示拓扑距离4处是否存在O—Cl结构的2D原子对描述符 D8 −0.216 ATSC7m 相对分子质量加权的2D自相关描述符 表 2 单一模型相关统计参数汇总
Table 2. Summary of statistical parameters of individual models
Model $R^2_{{\rm{adj}}{\text{-}}{\rm{train}}} $ $R^2_{{\rm{adj}}{\text{-}}{\rm{test}}} $ $Q^2_{10{\text{-}}{\rm{fold}}} $ RMSEtrain RMSEtest OLS 0.596 0.615 0.573 0.916 0.933 SVM 0.732 0.758 0.684 0.746 0.741 RF 0.839 0.751 0.700 0.579 0.751 GBDT 0.845 0.732 0.694 0.568 0.779 XGBoost 0.859 0.754 0.697 0.541 0.747 表 3 集成模型相关统计参数汇总
Table 3. Summary of statistical parameters of ensemble models
Model Base-learner $R^2_{{\rm{adj}}{\text{-}}{\rm{train}}} $ $R^2_{{\rm{adj}}{\text{-}}{\rm{test}}} $ $Q^2_{10{\text{-}}{\rm{fold}}} $ RMSEtrain RMSEtest Stack-1 SVM, RF 0.800 0.766 0.706 0.644 0.728 Stack-2 SVM, XGBoost 0.808 0.769 0.707 0.632 0.723 Stack-3 SVM, GBDT 0.801 0.764 0.707 0.642 0.730 Stack-4 RF, XGBoost 0.855 0.756 0.703 0.548 0.744 Stack-5 RF, GBDT 0.849 0.745 0.702 0.559 0.760 Stack-6 XGBoost, GBDT 0.859 0.752 0.699 0.541 0.750 Stack-7 SVM, RF, XGBoost 0.821 0.770 0.708 0.610 0.723 Stack-8 SVM, RF, GBDT 0.815 0.764 0.708 0.620 0.731 Stack-9 RF, XGBoost,GBDT 0.856 0.755 0.703 0.547 0.745 Stack-10 SVM, XGBoost, GBDT 0.823 0.762 0.708 0.606 0.734 Stack-11 SVM, RF, XGBoost,GBDT 0.830 0.767 0.708 0.595 0.726 表 4 验证集预测误差的评价指标
Table 4. Evaluation indices of prediction errors from testing set
Data set AE AAE MPE MNE nPE nNE Testing set −0.010 0.551 0.575 −0.531 130 147 表 5 Stack-7模型离群点及域外化合物
Table 5. Outliers and out-of-domain compounds in Stack-7 model
CAS 中文名称
Chinese name标准残差
Standardized residual分子结构
Molecular structure81-88-9 9-(2-羧基苯基)-3,6-双(二乙氨基)占吨翁氯化物 −3.300 4901−51-3 2,3,4,5-四氯苯酚 −3.118 117-80-6 2,3-二氯-1,4-萘醌 3.305 14233−37-5 1,4-二(1-异丙胺基)蒽醌 3.493 112-27-6 三甘醇 4.027 13560−89-9 双(六氯环戊二烯)环辛烷 −3.228 36065−30-2 2,4,6-三溴苯基(2,3-二溴-2-甲基丙基)醚 3.501 2008-58-4 2,6-二氯苯甲酰胺 3.734 表 6 本研究与其他集成模型的比较
Table 6. Comparison of the current model with previous ensemble models
-
[1] WANG Z, WALKER G W, MUIRD C G, et al. Toward a global understanding of chemical pollution: A first comprehensive analysis of national and regional chemical inventories [J]. Environmental Science & Technology, 2020, 54(5): 2575-2584. [2] Global Chemicals Outlook II: From legacies to innovative solutions: Implementing the 2030 agenda for sustainable development-Synthesis report[M]. Nairobi: United Nations Environment Programme, 2019: 1-88. [3] KEITA-QUANE F. UNEP Chemicals' work: breaking the barriers to information access [J]. Toxicology, 2003, 190(1-2): 135-139. doi: 10.1016/S0300-483X(03)00203-8 [4] 罗孝俊, 麦碧娴. 新型持久性有机污染物的生物富集[M]. 北京: 科学出版社, 2017: 1-356. LUO X J, MAI B X. Bioaccumulation of emergying persistent organic pollutants[M]. Beijing: Science Press, 2017: 1-356(in Chinese).
[5] 中华人民共和国生态环境部, 新化学物质环境管理登记指南[R]. 北京, 2020: 1-81. Ministry of Ecology and Environment of the People's Republic of China, Guidelines for environmental management registration of new chemical substances[R]. Beijing, 2020: 1-81(in Chinese).
[6] 陈景文, 全燮. 环境化学[M]. 大连: 大连理工大学出版社, 2009: 1-387. CHEN J W, QUAN X. Environmental chemistry[M]. Dalian: Dalian University of Technology Press, 2009: 1-387(in Chinese).
[7] GOBAS F A, WOLF W D, BURKHARD L P, et al. Revisiting bioaccumulation criteria for POPs and PBT assessments [J]. Integrated Environmental Assessment and Management: An International Journal, 2010, 5(4): 624-637. [8] EU. Regulation(EC) No. 1907/2006 of the European parliament and of the council of 18 December 2006 concerning the registration, evaluation, authorization, and restriction of chemicals(REACH)[S]. Brussels: Official Journal of the EU, 2006. [9] WOLF W D, COMBER M, DOUBENP, et al. Animal use replacement, reduction, and refinement: Development of an integrated testing strategy for bioconcentration of chemicals in fish [J]. Integrated Environmenta lAssessment and Management, 2007, 3(1): 3-17. doi: 10.1002/ieam.5630030102 [10] OECD. OECD guideline for testing of chemicals 305: Bioconcentration: Flow-through fish test[R]. Paris, 1996: 1-23. [11] 陈景文, 王中钰, 傅志强. 环境计算化学与毒理学[M]. 北京: 科学出版社, 2018: 1-274. CHEN J W, WANG Z Y, FU Z Q. Environmental computational chemistry and toxicology[M]. Beijing: Science Press, 2018: 1-274(in Chinese).
[12] VEITH G D, DEFOE D L, BERGSTEDT B V. Measuring and estimating the bioconcentration factor of chemicals in fish [J]. Journal of the Fisheries Board of Canada, 1979, 36(9): 1040-1048. doi: 10.1139/f79-146 [13] MEYLAN W M, HOWARD P H, BOETHLING R S, et al. Improved method for estimating bioconcentration/bioaccumulation factor from octanol/water partition coefficient [J]. Environmental Toxicology and Chemistry, 1999, 18(4): 664-672. doi: 10.1002/etc.5620180412 [14] PAVAN M, NETZEVA T I, WORTH A P. Review of literature-based quantitative structure–activity relationship models for bioconcentration [J]. QSAR & Combinatorial Science, 2008, 27: 21-31. [15] DEARDEN J C, HEWITT M. QSAR modelling of bioconcentration factor using hydrophobicity, hydrogen bonding and topological descriptors [J]. SAR and QSAR in Environmental Research, 2010, 21(7/8): 671-680. [16] STREMPEL S, NENDZA M, SCHERINGER M, et al. Using conditional inference trees and random forests to predict the bioaccumulation potential of organic chemicals [J]. Environmental Toxicology and Chemistry, 2013, 32(5): 1187-1195. doi: 10.1002/etc.2150 [17] YUAN J, XIE C, ZHANG T, et al. Linear and nonlinear models for predicting fish bioconcentration factors for pesticides [J]. Chemosphere, 2016, 156: 334-340. doi: 10.1016/j.chemosphere.2016.05.002 [18] AI H X, WU X W, ZHANG L, et al. QSAR modelling study of the bioconcentration factor and toxicity of organic compounds to aquatic organisms using machine learning and ensemble methods [J]. Ecotoxicology and Environmental Safety, 2019, 179: 71-78. doi: 10.1016/j.ecoenv.2019.04.035 [19] MILLER T H, GALLIDABINO M D, MACRAE J I, et al. Prediction of bioconcentration factors in fish and invertebrates using machine learning [J]. Science of the Total Environment, 2019, 648: 80-89. doi: 10.1016/j.scitotenv.2018.08.122 [20] VALSECCHI C, GRISONI F, CONSONNI V, et al. Consensus versus individual QSARs in classification: Comparison on a large-scale case study [J]. Journal of Chemical Information and Modeling, 2020, 60(3): 1215-1223. doi: 10.1021/acs.jcim.9b01057 [21] LI X, KLEINSTREUER N C, FOURCHES D. Hierarchical quantitative structure–activity relationship modeling approach for integrating binary, multiclass and regression models of acute oral systemic toxicity [J]. Chemical Research in Toxicology, 2020, 33(2): 353-366. doi: 10.1021/acs.chemrestox.9b00259 [22] SHEFFIELD T Y, JUDSON R S. Ensemble QSAR modeling to predict multispecies fish toxicity lethal concentrations and points of departure [J]. Environmental Science & Technology, 2019, 53(21): 12793-12802. [23] OECD. Guideline document on the validation of (quantitative) structure-activity relationships [(Q)SAR] models. Environment Health and Safety Publications Series on Testing and Assessment No. 69[R]. Paris: OECD, 2007: 1-154. [24] ARNOT J A, GOBAS F A. A review of bioconcentration factor (BCF) and bioaccumulation factor (BAF) assessments for organic chemicals in aquatic organisms [J]. Environmental Reviews, 2006, 14(4): 257-297. doi: 10.1139/a06-005 [25] LUNGHINI F, MARCOU G, AZAM P, et al. QSPR models for bioconcentration factor (BCF): Are they able to predict data of industrial interest? [J]. SAR and QSAR in Environmental Research, 2019, 30(7): 507-524. doi: 10.1080/1062936X.2019.1626278 [26] NITE (Japanese National Institute of Technology and Evaluation). Data from: Biodegradation and bioconcentration data under CSCL National Institute of Technology and Evaluation [DB/OL]. [2020-01-12]. https://www.nite.go.jp/en/index.html. [27] CEFIC LRI (European Chemical Industry Council Long Range Initiative). Data from: Bioconcentration factor database, European Chemical Industry Council Long range research initiative [DB/OL]. [2020-01-12]. http://cefic-lri.org/. [28] DSL (Canadian Domestic Substance List). Data from: Canadian domestic substances list (DSL), Environment and Climate Change Canada [DB/OL]. [2020-01-12]. https://www.canada.ca/en/environment-climate-change/services/canadian-environmental-protection-act-registry/substances-list.html#toc0. [29] ECOTOX EPA (ECOTOXicology knowledgebase of the US Environmental Protection Agency). Data from: ECOTOX Knowledgebase, US Environmental Protection Agency [DB/OL]. [2020-01-12]. https://cfpub.epa.gov/ecotox/. [30] QSAR Toolbox v 4.1. OASIS Laboratory of mathematical chemistry, Burgas, BG [DB/OL]. [2020-01-12]. http://oasis-lmc.org/products/software/toolbox.aspx. [31] OECD (Organisation for Economic Co-Operation and Development). Data from: EChemPortal: Global portal to information on chemical substances, Organisation for Economic Co-operation Development [DB/OL]. [2020-01-12]. https://www.echemportal.org/echemportal/. [32] ISO16269-7-2001, Statistical interpretation of data. Part 7: Median; Estimation and confidence intervals[S]. Geneva: International Organization for Standardization, 2001. [33] DRAGON(SoftwareforMolecularDescriptorCalculation), Version 6.0[CP], 2012. http://www.talete.mi.it/. [34] SINGH B K, VERMA K, THOKE A S. Investigations on impact of feature normalization techniques on classifier's performance in breast tumor classification [J]. International Journal of Computer Applications, 2015, 116(19): 11-15. doi: 10.5120/20443-2793 [35] 郑玉婷. 有机化学品鱼类生物富集因子QSAR模型的构建[D]. 大连: 大连理工大学, 2014: 1-60. ZHENG Y T. Development of QSAR models on bioconcentration factors of chemicals in fish[D]. Dalian: Dalian University of Technology, 2014: 1-60(in Chinese).
[36] NATHANS L L, OSWALDF L, NIMON K. Interpreting multiple linear regression: A guidebook of variable importance [J]. Practical Assessment, Research, and Evaluation, 2012, 17(1): 1-19. [37] CORTES C, VAPNIK V. Support-vector networks [J]. Machine Learning, 1995(20): 273-297. [38] BREIMAN L. Random forests [J]. Machine Learning, 2001(45): 5-32. [39] ATHEY S, TIBSHIRANI J, WAGER S. Generalized random forests [J]. Annals of Statistics, 2019, 47(2): 1148-1178. [40] FRIEDMAN J H. Greedy function approximation: A gradient boosting machine [J]. Annals of Statistics, 2001, 29(5): 1189-1232. doi: 10.1214/aos/1013203450 [41] CHEN T Q, GUESTRIN C. Xgboost: A scalable tree boosting system//Assoc Comp Machinery. Proceedings of the 22nd ACM SIGKDD international conference on knowledge discovery and data mining[C]. 2016: 785-794. [42] VANDERPLAS J. Python data science handbook[M]. Sevastopol: O'Reilly Media Inc, 2018: 1-500. [43] WOLPERT D H. Stacked generalization [J]. Neural Networks, 1992, 5(2): 241-259. doi: 10.1016/S0893-6080(05)80023-1 [44] BREIMAN L. Stacked regressions [J]. Machine Learning, 1996, 24(1): 49-64. [45] ZENKO B, DZEROSKI S. Stacking with an extended set of meta-level attributes and MLR[A]. In: Elomaa T, Mannila H, et al. 13th European Conference on Machine Learning[C]. Springer, Berlin, Heidelberg, 2002: 493-504. [46] SHARMA A, RANI R. Drug sensitivity prediction framework using ensemble and multi-task learning [J]. International Journal of Machine Learning and Cybernetics, 2020, 11(3): 1-10. [47] GRAMATICA P. Principles of QSAR models validation: internal and external [J]. QSAR & Combinatorial Science, 2007, 26(5): 694-701. [48] 覃礼堂, 刘树深, 肖乾芬, 等. QSAR模型内部和外部验证方法综述 [J]. 环境化学, 2013, 32(7): 1205-1211. doi: 10.7524/j.issn.0254-6108.2013.07.012 QIN L T, LIU S S, XIAO Q F, et al. Internal and external validations of QSAR model: Review [J]. Environmental Chemistry, 2013, 32(7): 1205-1211(in Chinese). doi: 10.7524/j.issn.0254-6108.2013.07.012
[49] Python, Version 3.7. 0[CP]. https://www.python.org/downloads/release/python-370/. [50] ROY K, DAS R N, AMBURE P, et al. Be aware of error measures. Further studies on validation of predictive QSAR models [J]. Chemometrics and Intelligent Laboratory Systems, 2016, 152: 18-33. doi: 10.1016/j.chemolab.2016.01.008 [51] LARSEN R J, MARX M L. An introduction to mathematical statistics and its applications[M]. Upper Saddle River: Prentice-Hall Inc, 1981: 1-920. [52] ROY K, AMBURE P, AHER R B. How important is to detect systematic error in predictions and understand statistical applicability domain of QSAR models? [J]. Chemometrics & Intelligent Laboratory Systems, 2017, 162: 44-54. [53] 闻洋. 有机污染物生物富集与鱼体内临界浓度关系的研究[D]. 长春: 东北师范大学, 2015: 1-126. WEN Y. Relationship between bioconcentration and critical body residues of organic pollutants[D]. Changchun: Northeast Normal University, 2015, 1-126(in Chinese).
[54] TICE C M. Selecting the right compounds for screening: does Lipinski's Rule of 5 for pharmaceuticals apply to agrochemicals? [J]. Pest Management Science: formerly Pesticide Science, 2001, 57(1): 3-16. doi: 10.1002/1526-4998(200101)57:1<3::AID-PS269>3.0.CO;2-6 [55] 李超. 有机污染物与·OH气相反应动力学和机制的计算模拟预测[D]. 大连: 大连理工大学, 2015: 1-211. LI C. Computational simulation to predict gaseous reaction kinetics and mechanism of organic pollutants with·OH[D]. Dalian: Dalian University of Technology, 2015: 1-211(in Chinese).
[56] WEN Y, HE J, LIU X, et al. Linear and non-linear relationships between bioconcentration and hydrophobicity: Theoretical consideration [J]. Environmental Toxicology and Pharmacology, 2012, 34(2): 200-208. doi: 10.1016/j.etap.2012.04.001 [57] MCHEDLOV-PETROSSYAN N O, VODOLAZKAYA N A, DOROSHENKO A O. Ionic equilibria of fluorophores in organized solutions: The influence of micellar microenvironment on protolytic and photophysical properties of rhodamine B [J]. Journal of Fluorescence, 2003, 13(3): 235-248. doi: 10.1023/A:1025089916356 [58] BRINKMANN M, ALHARBI H, FUCHYLO U, et al. Mechanisms of pH dependent uptake of ionizable organic chemicals by fish from oil sands process-affected water (OSPW) [J]. Environmental Science & Technology, 2020, 54(15): 9547-9555. [59] 邰红巍, 闻洋, 苏丽敏, 等. 有机污染物在鱼体内临界浓度研究进展 [J]. 科学通报, 2015(19): 1789-1795. TAI H W, WEN Y, SU L M, et al. Critical body residue to fish of organic pollutants [J]. Chinese Science Bulletin, 2015(19): 1789-1795(in Chinese).
[60] 席越, 杨先海, 张红雨, 等. 基于形态修正的描述符构建可电离化合物对大型溞急性毒性的QSAR模型 [J]. 生态毒理学报, 2019, 14(4): 183-191. XI Y, YANG X H, ZHANG H Y, et al. Development of acute toxicity of daphnia magna QSAR models for ionogenic organic chemicals based on chemical from adjusted descriptors [J]. Asian Journal of Ecotoxicology, 2019, 14(4): 183-191(in Chinese).
[61] LIN S Y, YANG X H, LIU H H. Development of liposome/water partition coefficients predictive models for neutral and ionogenic organic chemicals [J]. Ecotoxicology and Environmental Safety, 2019, 179: 40-49. doi: 10.1016/j.ecoenv.2019.04.036 [62] BOLTON J L, DUNLAP T L. Formation and biological targets of quinones: Cytotoxic versus cytoprotective effects [J]. Chemical Research in Toxicology, 2017, 30(1): 13-37. doi: 10.1021/acs.chemrestox.6b00256 [63] TERRENCE J M, DOUGLAS C J. The metabolism and toxicity of quinones, quinonimines, quinonemethides and quinone-thioethers [J]. Current Drug Metabolism, 2002, 3(4): 425-438. doi: 10.2174/1389200023337388 [64] CHRASTINA A, WELSH J, RONDEAU G, et al. Plumbagin-serum albumin interaction: spectral, electrochemical, structure-binding analysis, antiproliferative and cell signaling aspects with implications for anticancer therapy [J]. ChemMedChem, 2020, 14(15): 1338-1347. [65] ZHAO C, BORIANI E, CHANA A, et al. A new hybrid system of QSAR models for predicting bioconcentration factors (BCF) [J]. Chemosphere, 2008, 73(11): 1701-1707. doi: 10.1016/j.chemosphere.2008.09.033 [66] GISSI A, NICOLOTTI O, CAROTTI A, et al. Integration of QSAR models for bioconcentration suitable for REACH [J]. Science of the Total Environment, 2013, 456: 325-332. [67] ZHANG X M, SUN X F, JIANG R F, et al. Screening new persistent and bioaccumulative organics in China's inventory of industrial chemicals [J]. Environmental Science & Technology, 2020, 54: 7398-7408. [68] GB/T24782-2009. 持久性、生物累积性和毒性物质及高持久性和高生物累积性物质的判定方法[S]. 北京: 中华人民共和国国家质量监督检验检疫总局和中国国家标准化管理委员会, 2009. GB/T24782-2009. Determination methods for persistent, bioaccumulative and toxic substances and highly persistent and highly bioaccumulative substances[S]. Beijing: General Administration of Quality Supervision, Inspection and Quarantine of the People’s Republic of China, Standardization Administration of China, 2009(in Chinese).