-
CO2、CH4和N2O作为主要的温室气体,对全球温室效应的贡献率达80%以上[1-2],内陆湖泊是其重要的来源之一[3-6]. 入湖河流输入的营养物质促进湖泊温室气体的产生和排放,同时也将水中溶存的温室气体输入到湖泊,进而影响湖泊中温室气体的溶存浓度[6-7]. 已有研究多关注自然水文状态下湖泊水体温室气体溶存浓度、源汇效应的时间变化特征及其影响因子[3-8],关于调水影响的研究主要关注引水对藻型湖泊N2O排放通量的影响[9],而对调水工程中的调蓄湖库在调水期温室气体的分布特征及影响因素的研究还未见报道. 调水工程调水期多处于枯水期,调水期湖泊水位、水质、水流流向和换水周期均较非调水期有较大变化,而水位和水质变化均会对水体温室气体产生和排放产生影响,同时水位的变化也会降低枯水期入湖河流对湖泊的影响.
南四湖是南水北调东线工程山东段最大的调蓄湖库,对区域环境和气候以及受水区水质安全影响显著. 调水不仅改变了南四湖湖水自北向南的自然流向,也对入湖区的水质造成一定的影响,进而影响温室气体的溶存和分布. 近年来有关南四湖水环境的研究主要集中于污染评价以及调水和区域发展对水环境的影响等方面[10-15],而对南四湖水体温室气体的研究较少,且仅有研究中采样点位较少[16-17]难以有效阐明其空间变化特征和影响因子. 本研究阐明了调水期南四湖及部分入湖河口表层水中温室气体浓度、饱和度和排放通量的空间变化特征,分析了各湖区以及河口区间温室气体的差异,并结合水质指标探讨了调水期南四湖表层水中温室气体溶存的影响因素,研究结果为深入理解调水期调蓄湖库表层水中温室气体的空间变化特征及其影响因子提供基础数据支撑.
-
南四湖由4个相连湖区(南阳湖、独山湖、昭阳湖、微山湖)组成,最大湖面积为1266 km2,兴利库容为63.7×10⁸ m3,其中微山湖面积最大. 南四湖中部的二级坝将其分为上、下两级,上级湖为南阳湖、独山湖、昭阳湖,下级湖则为微山湖. 南四湖正常蓄水位下平均水深1.5 m,湖内分布有大量的水生植物,属典型的浅水草藻型湖泊. 2013年东线工程通水前南四湖富营养化严重,通水后富营养化程度有明显降低[18]. 东线工程一般在非汛期进行调水,2020—2021年度调水期为2020年12月底至2021年5月底,共调水入山东6.74×10⁸ m3,由南四湖对其进行调蓄分配.
-
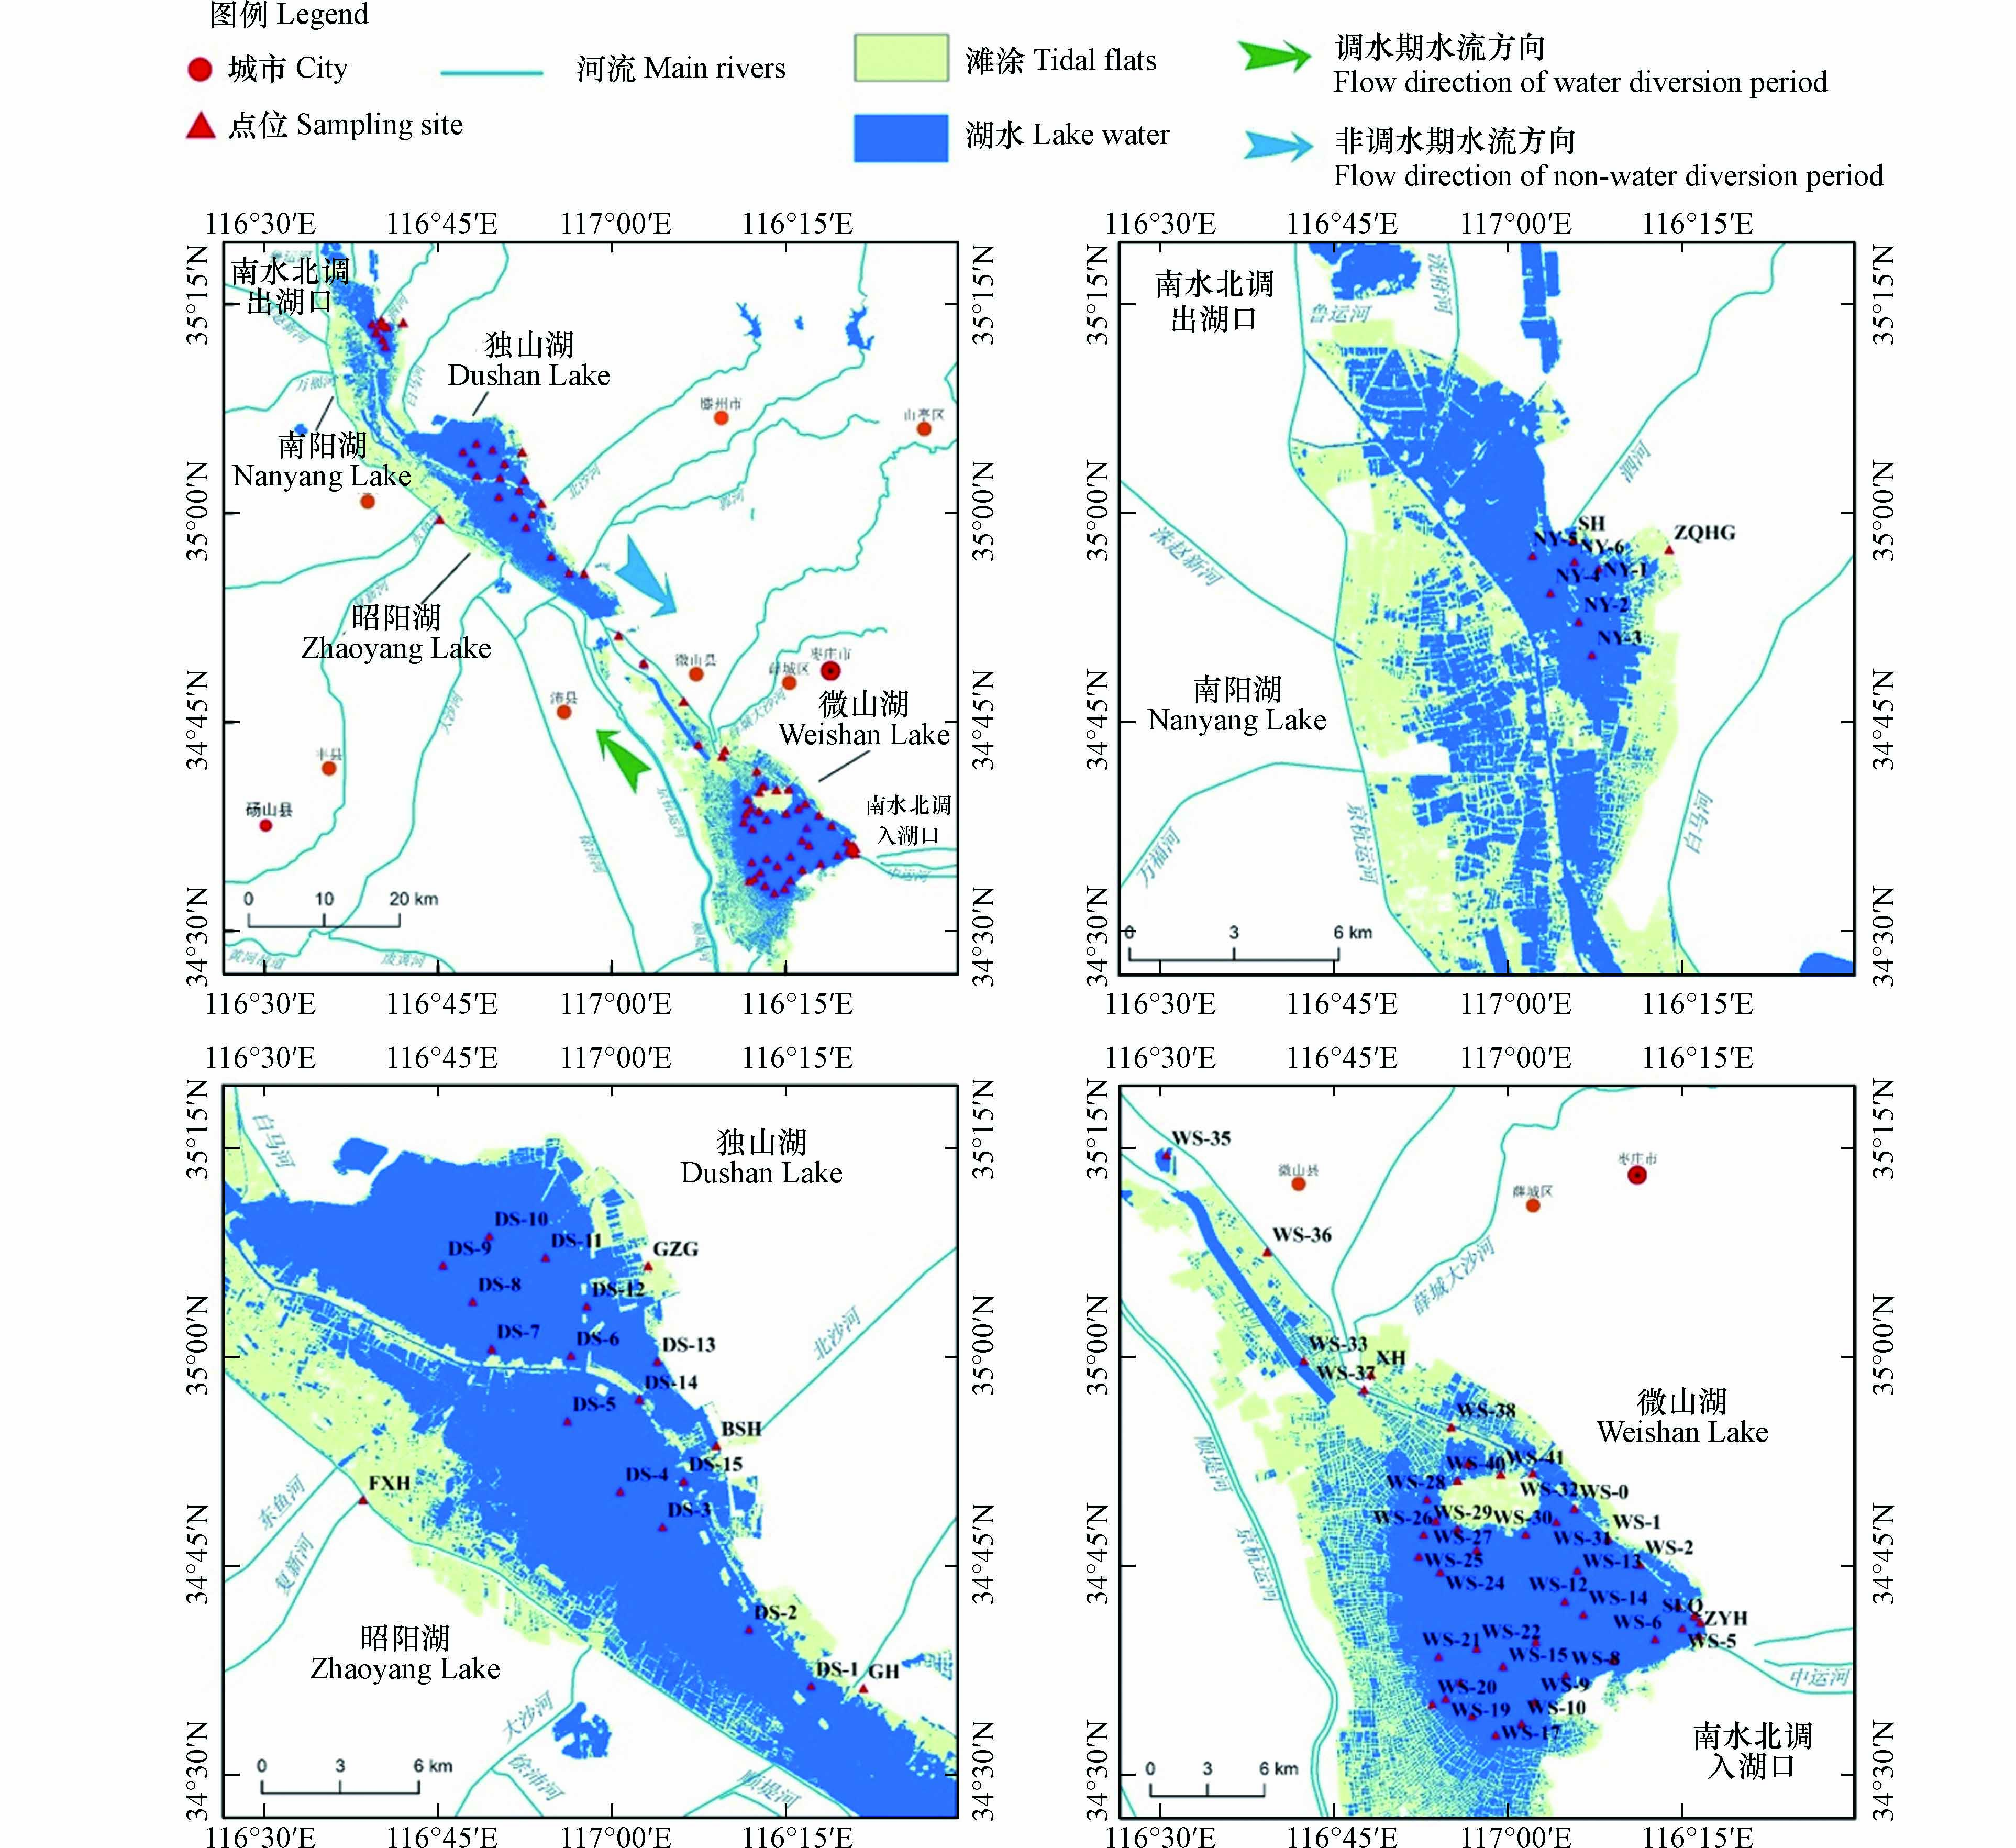
在南四湖布设63个采样点,其中微山湖(WS)42个,南阳湖(NY)6个,因独山湖与昭阳湖无明显分界线,故将两湖合并记作DS,共15个采样点;在9条主要入湖河流的河口布设采样点,分别为复新河(FXH)、北沙河(BSH)、胜利渠(SLQ)、泗河(SH)、薛河(XH)、郭河(GH)、中运河(ZYH)、仲浅横沟(ZQHG)和耿庄沟(GZG);各采样点具体分布见图1. 考虑水体的稳定性和均匀性并避开冰封期,于2021年3月11日—13日在各采样点采集水面下20 cm的表层水,现场采用顶空平衡法 [19]提取溶解气体,即将水样注入两头具有硅胶密封垫和密封螺帽的100 mL有机玻璃管内,并使其溢出一定体积的水后密封,从顶端用注射器注入50 mL高纯氮气,同时从底端通过针头排出同体积的水样,振荡10 min后静置1 h抽取顶空气体,储存于气体采样袋(大连海得)内;每个采样点采集3个平行,每次采样均重新采集表层水,同时使用气体采样袋直接采集现场1.0 m高度的空气样品;气体采样袋使用前经高纯N2多次清洗并抽真空;另取水样用于理化指标分析. 使用HI9145型DO仪(意大利HANNA公司)、pH400型pH计(美国SPECTRUM公司)、自制水深测量装置和塞氏盘现场测定水温(WT)、溶解氧(DO)、pH、水深(WD)和透明度(SD).
回实验室后,使用美国Agilent公司7890A型气相色谱仪测定气体中N2O、CO2和CH4的浓度,采用国家标准分析方法测定水中叶绿素a(Chl-a)、硝态氮(NO3−)、亚硝态氮(NO2−)、氨氮(NH3)、可溶性正磷酸盐(DIP)、高锰酸盐指数(CODMn)、总氮(TN)和总磷(TP)等[20],溶解性有机碳(DOC)采用德国Elementar公司的总TOC分析仪测定.
-
水中温室气体溶存浓度(CW, μmol·L−1)的计算公式为[21]:
式中,
$ {C}_{\mathrm{A}1} $ 为有机玻璃管中水—气交换平衡时顶空气体中温室气体浓度(μmol·L−1);$ {V}_{\mathrm{A}1} $ 为管中顶空空气体积(L);$ {V}_{\mathrm{w}} $ 为管中水样的体积(L);α为布氏系数(mol·L−1·atm−1).温室气体水—气界面的排放通量(F)采用薄边界层扩散模型法计算,计算公式为[22-23]:
式中,
$ \Delta C $ 为水—气界面温室气体浓度的差值,$ \Delta C={C}_{\mathrm{w}}-{C}_{\mathrm{A}2} $ ,$ {C}_{\mathrm{A}2} $ 为采样点大气中温室气体浓度(μmol·L−1);k为扩散系数[22]. F为正值代表气体自水向空气扩散.采用SPSS 25.0中Pearson相关模型探讨了影响温室气体浓度的主要因子;采样图和温室气体浓度和排放通量的空间分布图采用ArcGIS10.6绘制;采用Origin 2015拟合并绘制一元线性回归图.
-
如表1所示,调水期南四湖表层水中pH、DO、NH3、CODMn和NO3−平均含量均能达到其功能区域水质标准要求,且除CODMn外(仅微山湖有2个点位超标),pH、DO、NH3和NO3−达标率均为100%.
TP平均含量除独山湖+昭阳湖中略低于Ⅲ类水标准限值外,其余各湖区和河口区均超标,表现为河口区>南阳湖>微山湖,分别约为标准限值的2.2倍、1.9倍和1.5倍,河口区显著高于微山湖(P < 0.05),全湖TP超标率为80.6%. 各湖区和河口区TN平均含量均超标,超标率为97.2%,微山湖和独山湖+昭阳湖TN平均含量均显著高于南阳湖(P < 0.05). 河口区WD较大,且TN、NO3−、NO2−、TP、DIP和Chl-a量较高,反映了入湖河流营养物质输入作用的影响;而微山湖WD和SD均较低,DO含量显著高于其他湖区(P < 0.05),但作为下级湖,水中TN、NO3−、DIP含量亦较高. 各湖区和河口区pH、NH3、DOC和CODMn含量无显著性差异(P > 0.05).
-
如表2所示,南四湖表层水中N2O、CH4和CO2浓度分别为(23.0±6.13)nmol·L−1、(0.15±0.10)μmol·L−1和(52.4±11.4)μmol·L−1,饱和度分别为154%±44.6%、3878%±2668%和186%±46.2%,排放通量分别为(0.22±0.18)μmol·m−2·h−1、(3.95±2.73)μmol·m−2·h−1和(658±336)μmol·m−2·h−1. N2O、CH4和CO2均处于高度过饱和状态,表现为大气的“源”. 各湖区间表层水中CH4和CO2平均浓度不存在显著差异(P > 0.05);微山湖N2O平均浓度、饱和度和排放通量均显著低于河口区(P < 0.05),CO2平均饱和度和排放通量亦显著低于其他3个湖区(P < 0.05).
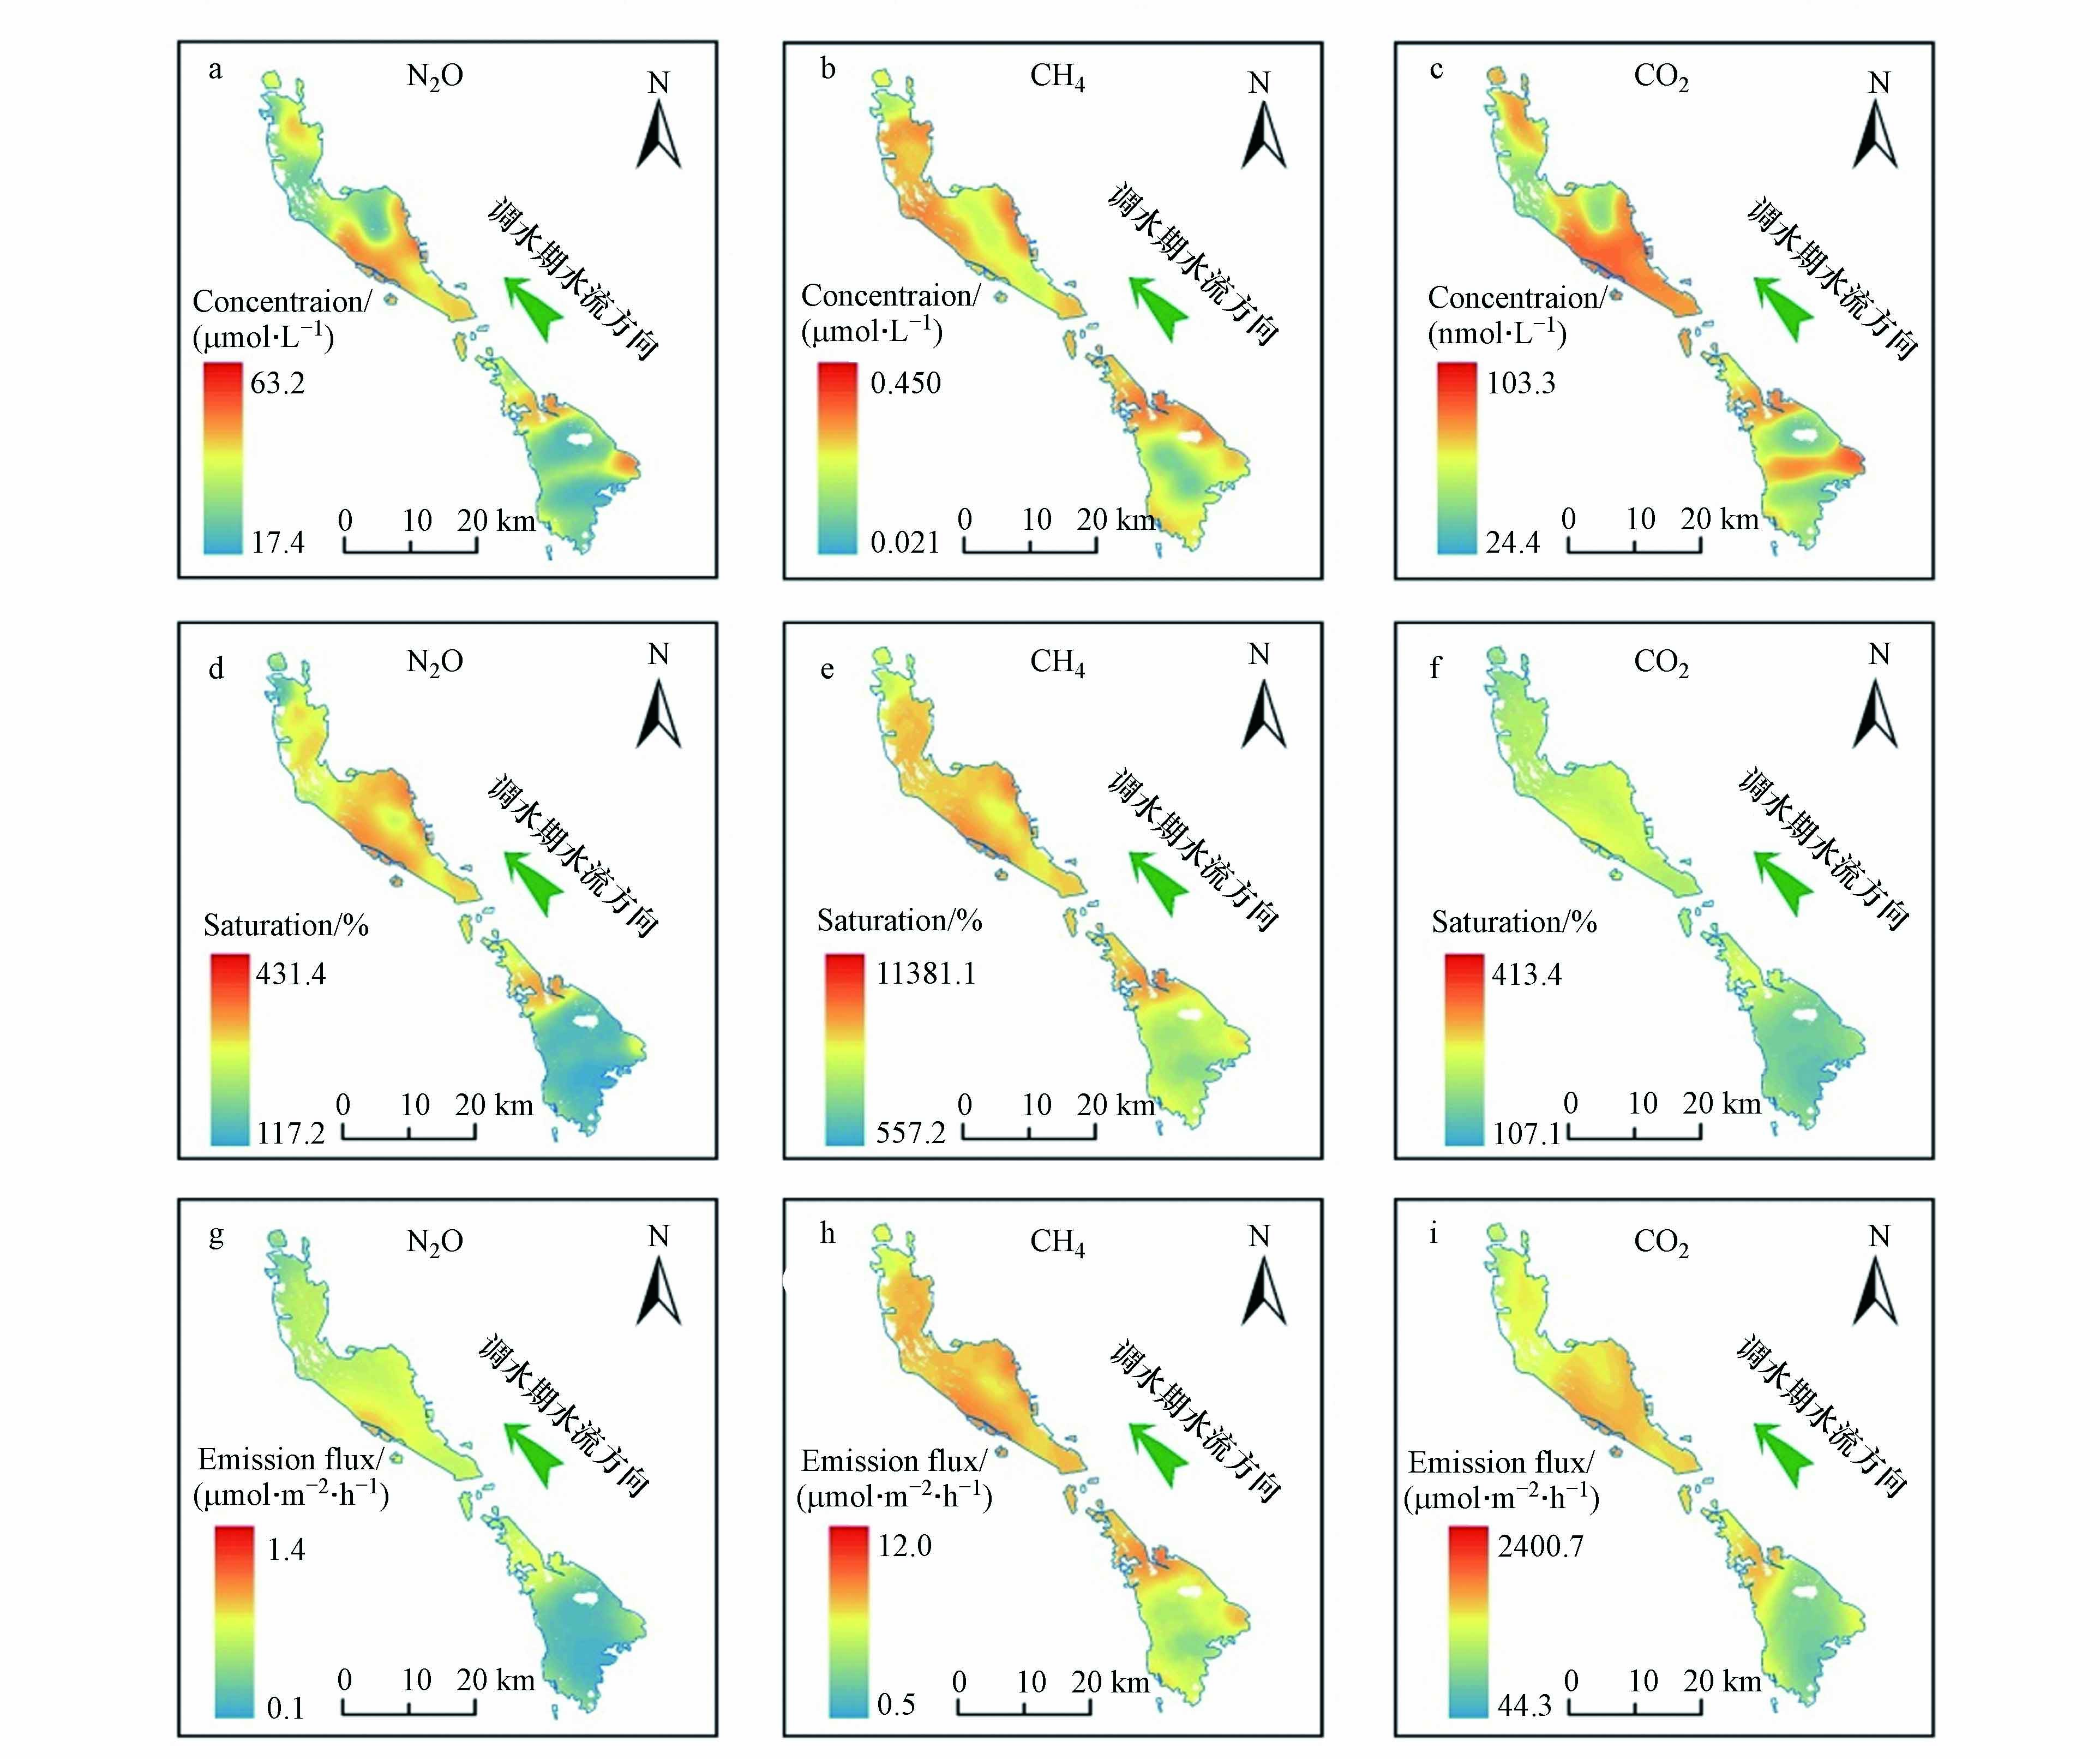
如图2所示,各温室气体溶存浓度、饱和度和排放通量均呈现自上级湖向下级湖降低的趋势,与南水北调水流方向相反,体现了调水对湖水中温室气体的稀释作用;且温室气体浓度在多个河口区和二级坝附近水域出现高值区,但在南水北调工程出水口(NY-6)附近区域,尽管受到泗河等入湖河流的影响但温室气体浓度并不高. 此外,N2O和CO2在微山湖湖心区出现带状高浓度区,而CH4则无此相对高值区且湖心区浓度相对较低. 入湖河口、二级坝上下及岸边区温室气体浓度较高可能是由于浅水湖泊中河流营养物质的输送及沉积的边缘效应所导致的[23],而微山湖湖心区N2O和CO2带状高浓度区的成因则需进一步探讨.
将南四湖温室气体溶存浓度和排放通量与冬季我国部分水体进行了对比分析,如表3所示. 南四湖表层水中N2O浓度与巢湖相当,但明显低于平原河网,而高于北京城市内湖;CH4浓度亦明显低于平原河网,但显著高于西北口水库,而较北京城市内湖低.
南四湖N2O饱和度明显低于平原河网,但CH4饱和度远高于平原河网. 南四湖N2O排放通量与巢湖和东平湖基本相当,高于梅梁湾和鄱阳湖,但显著低于平原河网;CH4排放通量与鄱阳湖相当,高于微山湖、梅梁湾和西北口水库,而显著低于平原河网以及部分城市内湖;与冬季梅梁湾表现为CO2的汇不同,南四湖表现为CO2的排放源,通量高于微山湖和鄱阳湖,但处于城市内湖的变化范围内.
-
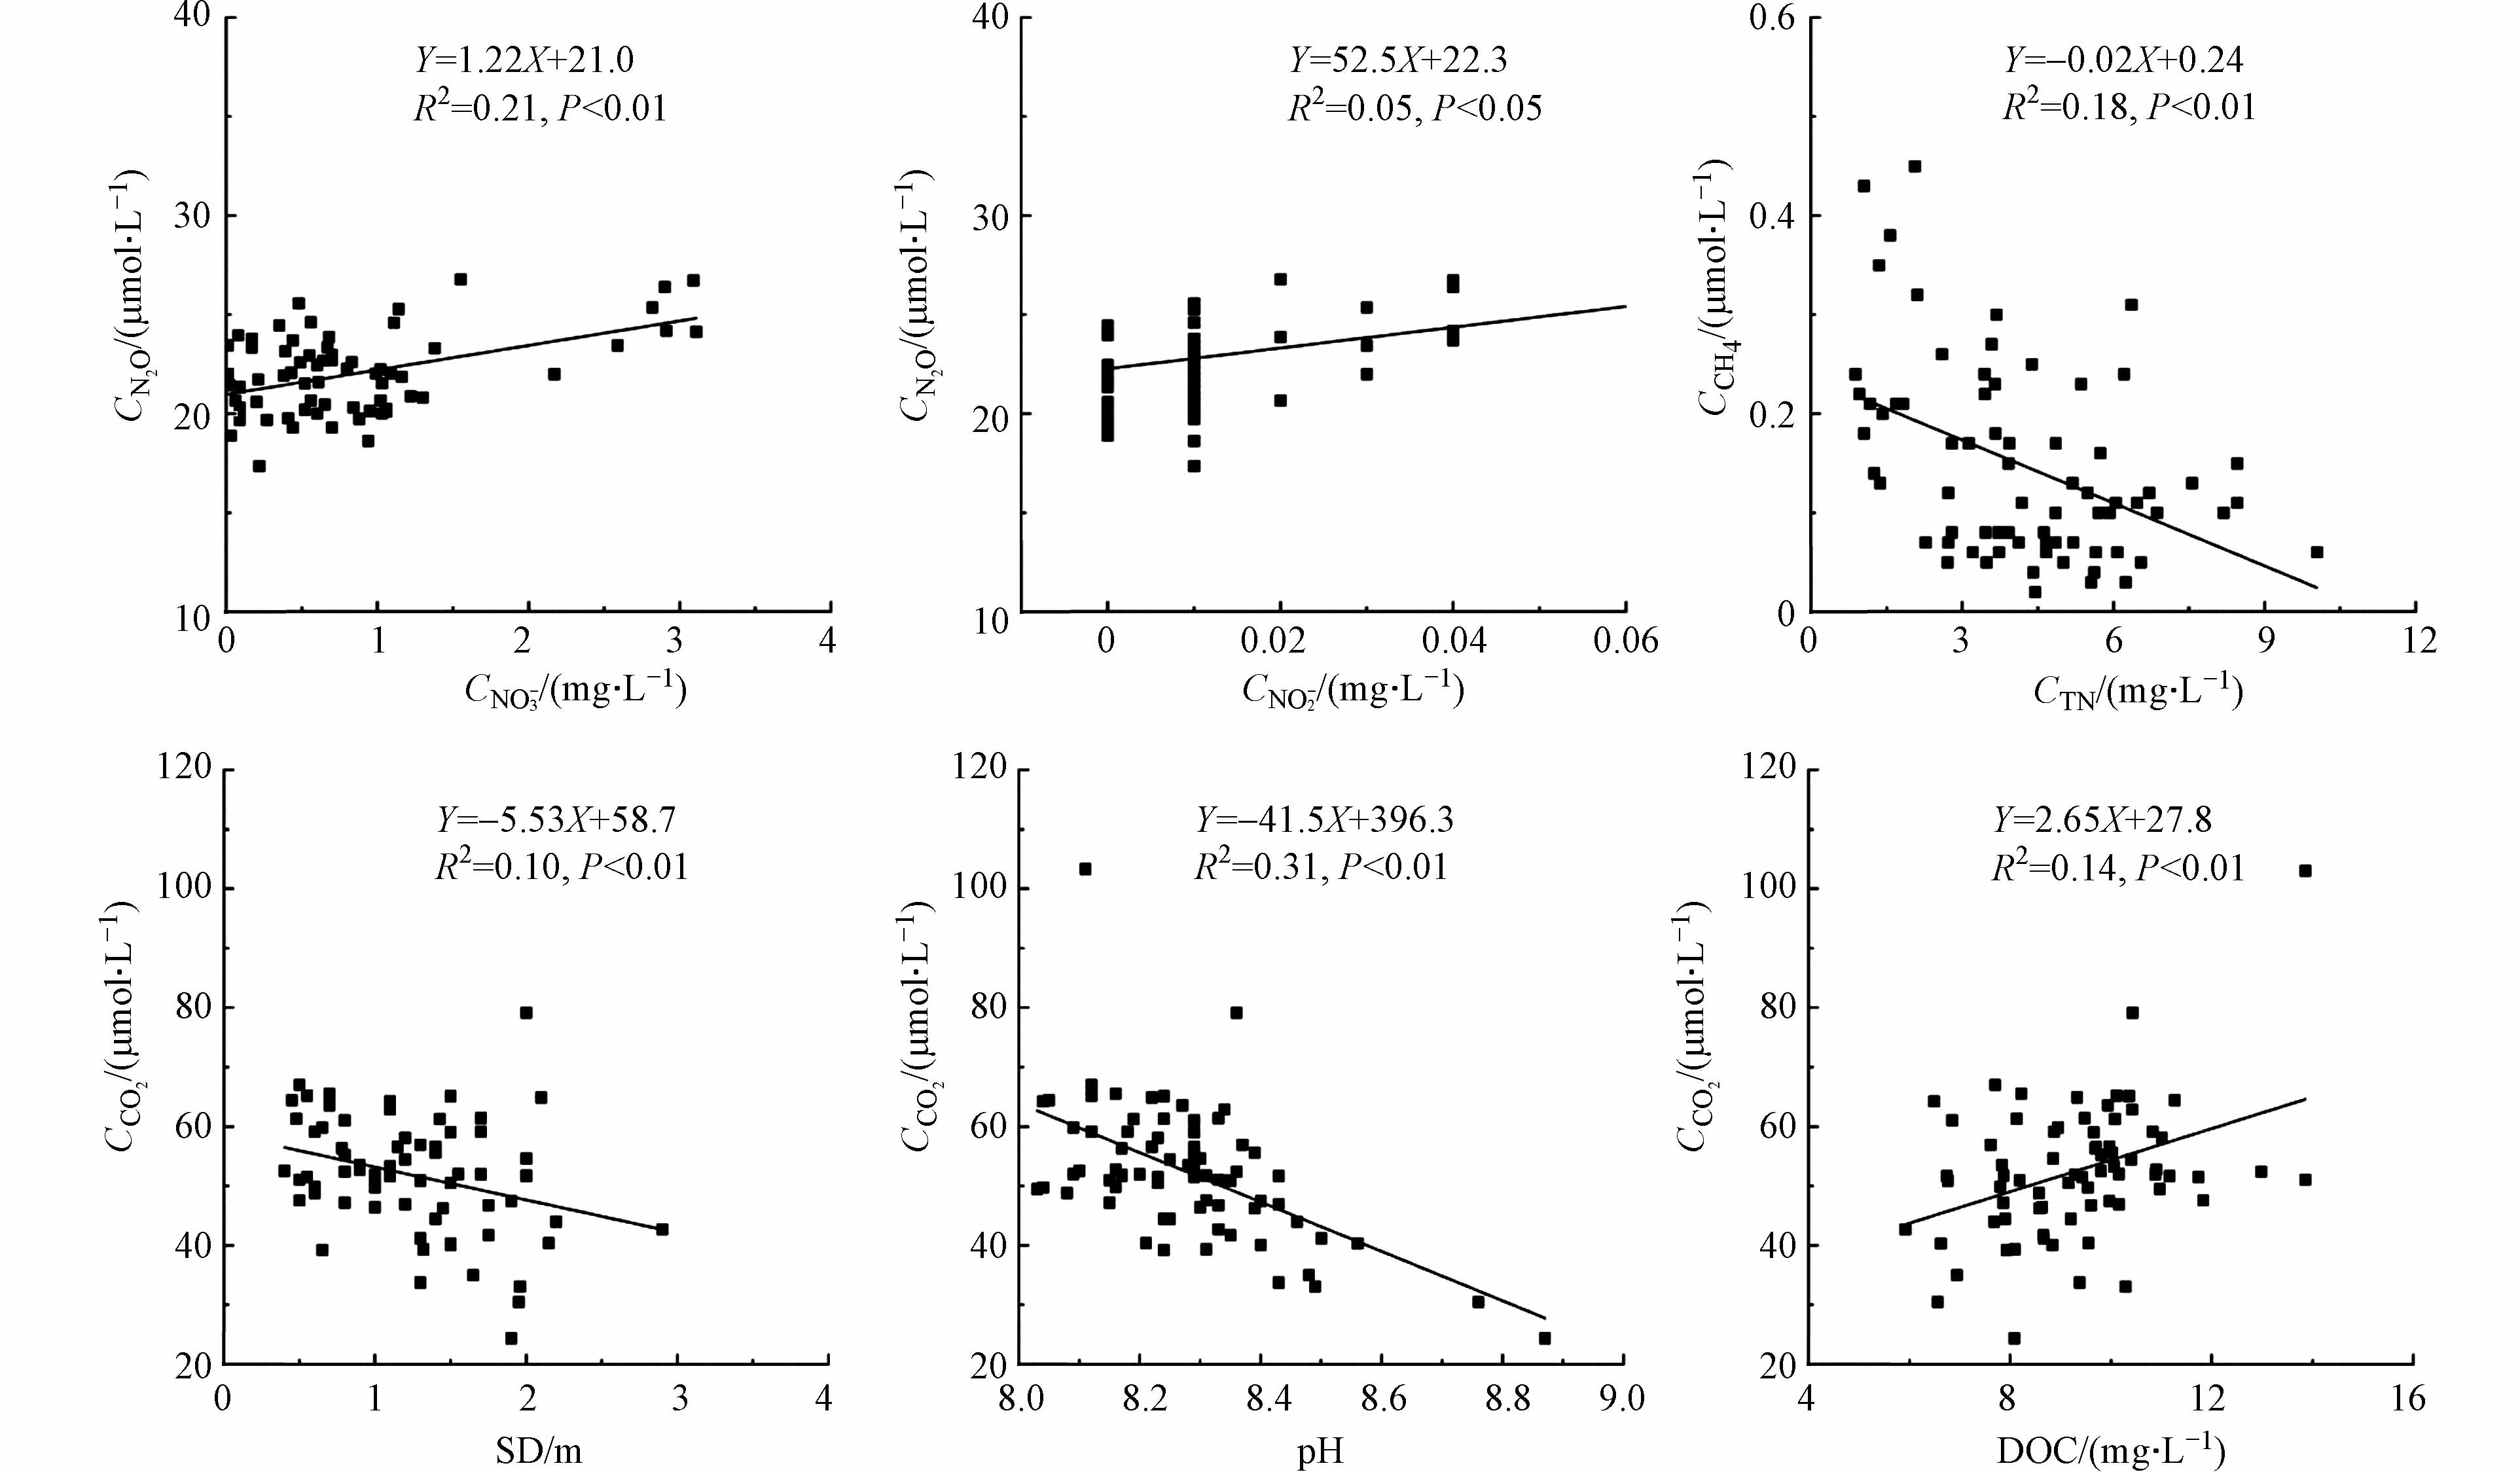
如图3和表4所示,南四湖表层水中各温室气体溶存浓度分别与不同的水质指标呈显著相关关系,且在微山湖湖区和河口区表层水中N2O溶存浓度的影响因子不同. 水体中N2O主要产生于硝化和反硝化过程中[6, 34],NO3−和NH3分别为反硝化作用和硝化作用的底物,NO2−是微生物氮转化过程的中间产物. 南四湖表层水中N2O浓度与NO3−、NO2−浓度呈显著正相关关系(图3),且NO3−和NO2−间呈显著正相关关系(R=0.417,P < 0.01)说明表层水中N2O可能主要来源于沉积物的反硝化过程. 在河口区由于河流带来较为丰富的NH3(表1),且河口区表层中NO2−与NH3呈显著正相关关系(R=0.556,P < 0.01),说明水中硝化作用强烈,推断该区域水体溶存的N2O主要产生于硝化过程;而在微山湖,N2O则主要来源于反硝化过程,水深增加导致水中DO降低有利于增强表层沉积物的反硝化作用,促进了水中N2O浓度增加,使二者呈显著正相关关系(表4);3月份南四湖水体中优势沉水植物-菹草正处于返青生长期,SD的增加会增强其光合作用,提高水中DO含量,抑制表层沉积物的反硝化作用,故二者呈显著负相关关系(表4);而在河口区中,SD的上升可通过影响菹草光合作用,增加水中DO含量,促进底层水和表层沉积物的硝化作用和N2O的产生,使二者呈正相关关系(表4).
水体中CH4浓度是由CH4产生和氧化的相对平衡决定[35]. 作为典型的草藻型湖泊,南四湖水生植物丰富,植物衰亡后残体沉积在底泥中,为产甲烷菌提供了丰富的底物[36],促进了水体深层和底泥中CH4的产生,并扩散进入上覆水,导致表层水中浓度较高[2];而TN的抑制作用则有可能与无机氮对产甲烷细菌的毒害作用有关[37],同时硝酸盐是更有利的末端电子受体[38],硝酸盐浓度亦影响CH4的产生.
水中CO2浓度主要受到水体碳酸平衡、光合作用以及呼吸作用等作用的影响. 3月份南四湖浮游藻类较少,SD大有利于菹草的生长,菹草的光合作用导致水中CO2浓度降低,使二者呈显著负相关关系(图3). DOC作为CO2产生的底物,含量增加会促进CO2的产生,故二者呈显著正相关关系(图3). 南四湖湖水最小pH为8.03,全湖水体为偏碱性,水中CO2易发生电离,使其浓度降低,两者呈显著负相关关系(图3),这与其他研究结果相一致[39-40].
-
(1)调水期南四湖表层水除TP和TN外,pH、DO、NH3和CODMn平均含量均可达到《地表水环境水质标准》Ⅲ类水标准,河流输入导致入湖河口区和下级湖微山湖营养盐含量较高.
(2)调水期南四湖各温室气体呈现过饱和状态,表现为大气的排放源,南水北调对湖水中温室气体具有一定的稀释作用,河口区和二级坝附近水域温室气体浓度较高,此外,微山湖湖心区N2O和CO2浓度较高,且呈带状分布.
(3)调水期南四湖表层水中温室气体浓度与氮浓度、pH、SD、DOC等水质指标间具有一定的显著相关性,各湖区N2O浓度与水中NO3−、NO2−浓度显著正相关,表明其可能主要受到反硝化作用的影响,而河口区N2O浓度与NH3显著正相关,可能主要受硝化作用的影响.
冬季调水期南四湖水体温室气体溶存浓度及其影响因素
Dissolved greenhouse gas concentrations and the influencing factors in Nansi Lake during winter water diversion period
-
摘要: 为了解冬季调水期南四湖表层水中温室气体的溶存浓度及其排放通量,采集南四湖各湖区和主要入湖河流的河口区表层水及气体样品,分析了水体的理化指标以及CO2、CH4和N2O的溶存浓度,采用薄边界层扩散模型法估算了水—气界面排放通量,并探讨了影响调水期南四湖温室气体溶存浓度的主要因子. 结果表明,调水期南四湖表层水中N2O、CH4和CO2浓度分别为(23.0±6.13) nmol·L−1、(0.15±0.10) μmol·L−1和(52.4±11.4) μmol·L−1,均处于高度过饱和状态,排放通量分别为(0.22±0.18) μmol·m−2·h−1、(3.95±2.73) μmol·m−2·h−1和(658±336) μmol·m−2·h−1;浓度和排放通量多与冬季其他湖泊相当,但低于平原河网. 各温室气体浓度、饱和度和排放通量整体呈现自上级湖向下级湖降低的趋势,且在河口区和二级坝附近水域浓度较高,同时N2O和CO2浓度在微山湖湖心区出现带状高值区,而CH4相对较低. 各温室气体浓度与水质参数间具有一定的相关性,其中,N2O浓度与NO3−、NO2−浓度呈显著正相关,CH4与TN呈显著负相关,CO2与pH、SD呈显著负相关,与DOC呈显著正相关,反映了水质对温室气体溶存浓度的影响. 研究结果为评估调蓄湖泊在调水期对大气温室气体的影响提供了基础数据支撑.Abstract: In order to understand the dissolved concentrations and emission fluxes of greenhouse gases (GHGs) in the surface water of Nansi Lake during the water diversion period, gas samples and surface water samples were collected at 63 sampling sites distributed in the four sub-lakes and the inlet area of the main rivers. Concentrations of carbon dioxide (CO2), methane (CH4) and nitrous oxide (N2O) and the physicochemical properties of surface water were analyzed, and the emission fluxes at the surface water-air interface were calculated by using the thin boundary layer equation (TBL). The influencing factors on the dissolved concentrations of GHGs were discussed by using the correlation analysis and linear regression analysis between the GHG concentrations and the water physicochemical properties. The average concentrations of CO2, CH4 and N2O were (23.0±6.13) nmol·L−1, (0.15±0.10) μmol·L−1 and (52.4±11.4) μmol·L−1, respectively. The GHGs were highly saturated, and the average emission fluxes were (0.22±0.18) μmol·m−2·h−1 for CO2, (3.95±2.73) μmol·m−2·h−1 for CH4 and (658±336) μmol·m−2·h−1 for N2O, respectively, indicating that Nansi Lake mainly acted as the source of GHGs during the water diversion period; moreover, the concentrations and fluxes were similar to those of other lakes, but lower than those of the plain river network in winter. In general, the concentrations, saturations and fluxes of the three GHGs showed a decreasing trend from the north (the Nanyang Lake) to the south (the Weishan Lake). Higher GHG concentrations were in the inlet area of the rivers and in the area near the second level dam, in addition, there were belt-shaped high concentrations of N2O and CO2 but lower CH4 concentrations in the center of Weishan Lake. The concentrations of GHGs had some significant correlations with the water quality parameters (P < 0.05) indicating that the water quality should have some impact on the dissolved concentrations of the GHGs. Specifically, N2O was positively correlated with NO3− and NO2−, and CH4 was negatively correlated with TN; while CO2 had negative correlations with pH and SD but positive correlation with DOC. The results provide basic data support for the assessment of the influence of the lake on atmospheric greenhouse gases during the water diversion period.
-

-
表 1 南四湖各湖区和部分河口水环境参数
Table 1. The water environment parameters of Nansi Lake
区域
Region理化指标
Physical
and
chemical
indexesWD/
mSD/
mWT/
℃pH DO/
(mg·L−1)TN/
(mg·L−1)NO3--N/
(mg·L−1)NO2--N/
(mg·L−1)NH3-N/
(mg·L−1)TP/
(mg·L−1)DIP/
(mg·L−1)DOC/
(mg·L−1)CODMn/
(mg·L−1)Chl-a/
(μg·L−1)微山湖(n=42)
WS平均值 2.02b 1.13b 5.26b 8.27a 11.34a 4.48a 1.02ac 0.010b 0.43a 0.075b 0.029a 8.98a 3.52a 2.10b 标准偏差. 0.87 0.58 0.47 0.18 1.16 1.71 0.78 0.010 0.14 0.031 0.025 1.83 1.13 2.51 独山湖+昭阳湖(n=15)
DS+ZY平均值 2.74a 1.54a 6.39a 8.31a 10.51b 4.80a 0.31b 0.008b 0.55a 0.046c 0.014b 9.67a 3.87a 1.42b 标准偏差 0.56 0.35 0.88 0.07 0.19 1.56 0.22 0.008 0.20 0.026 0.015 0.66 0.50 1.14 南阳湖(n=6)
NY平均值 2.21ab 1.37ab 5.18b 8.32a 10.65b 1.25b 0.37bc 0.008b 0.44a 0.097ab 0.010b 9.30a 3.76a 2.01b 标准偏差 0.24 0.34 0.40 0.11 0.14 0.32 0.42 0.003 0.19 0.040 0.006 1.41 0.65 0.47 河口(n=9)
Estuary平均值 4.83a 1.20ab 6.52a 8.21a 11.13ab 3.91ab 2.77a 0.046a 0.44a 0.111a 0.028a 10.08a 3.78a 4.46a 标准偏差 4.73 0.60 1.32 0.08 1.40 3.19 2.99 0.064 0.20 0.050 0.017 1.68 0.59 2.98 全湖
(含河口,n=72)
The whole lake平均值 2.51 1.25 5.65 8.28 11.08 4.21 1.03 0.014 0.46 0.075 0.024 9.29 3.64 2.21 标准偏差 1.90 0.54 0.90 0.15 1.06 2.04 1.38 0.026 0.17 0.038 0.022 1.63 0.94 2.36 最小值 0.70 0.40 4.80 8.03 10.20 0.88 0.005 0.002 0.12 0.009 0.001 5.92 0.56 0.013 最大值 15.00 2.90 9.30 8.87 14.90 10.04 8.65 0.213 0.92 0.190 0.103 13.86 6.62 11.18 GB3838-2002
Ⅲ类水标准— — — 6—9 ≥5 ≤1.0 ≤10* — ≤1.0 ≤0.05 — — ≤6 — 注:* NO3−-N标准为GB 3838—2002集中式生活饮用水地表水源地补充项目标准限值. 同列不同小写字母表示具有显著差异(P < 0.05). 下文同.
Notes: * NO3−-N standard value is the standard limit of GB 3838—2002 supplementary items of centralized drinking water surface water source. Different lowercase letters in the same column have significant difference (P < 0.05) The same below.表 2 南四湖表层水中N2O、CH4和CO2溶存浓度、饱和度和排放通量的参数统计
Table 2. The parametric statistics of concentrations, saturation and emission fluxes of N2O, CH4 and CO2 in surface water of Nansi Lake
参数
ParameterN2O CH4 CO2 浓度
Concentration饱和度
Saturation排放通量
Emission
flux浓度
Concentration饱和度
Saturation排放通量
Emission
flux浓度
Concentration饱和度
Saturation排放通量
Emission
flux微山湖
WS平均值 21.5b 140b 0.16b 0.14a 3595a 3.63a 50.3a 170b 551.7b 最小值 17.4 117 0.07 0.02 557 0.46 24.4 107 44.3 最大值 26.7 170 0.27 0.45 11206 12.0 67.0 241 1035.3 标准偏差 2.08 14.5 0.06 0.10 2688 2.72 10.1 36.8 262.0 独山湖+
昭阳湖
DS+ZY平均值 22.3ab 156a 0.22a 0.12a 3148a 3.23a 54.2a 199a 757.2a 最小值 19.7 142 0.18 0.05 1457 1.35 41.7 171 497.9 最大值 24.6 174 0.26 0.24 6327 6.69 65.1 235 1005.1 标准偏差 1.35 10.1 0.03 0.06 1647 1.77 7.34 19.2 157.3 南阳湖
NY平均值 23.3ab 153ab 0.21ab 0.22a 5655a 5.82a 56.4a 207a 782.7a 最小值 20.7 136 0.14 0.13 3322 3.37 41.2 142 330.8 最大值 25.6 171 0.28 0.43 11381 11.7 79.1 301 1425.6 标准偏差 2.02 12.6 0.05 0.11 2953 3.06 12.9 56.8 383.5 河口
Estuary平均值 30.8a 217a 0.46a 0.19a 5235a 5.42a 56.6a 224a 902a 最小值 20.7 140 0.16 0.06 1498 1.47 39.2 151 356 最大值 63.2 431 1.34 0.38 10444 10.5 103.3 413 2411 标准偏差 15.0 104 0.42 0.11 3179 3.23 19.1 75.9 601 全湖
(含河口)
The whole
lake平均值 23.0 154 0.22 0.15 3878 3.95 52.4 186 658 最小值 17.4 117 0.07 0.02 557 0.46 24.4 107 44.3 最大值 63.2 431 1.34 0.45 11381 12.0 103.3 413 2411 标准偏差 6.13 44.6 0.18 0.10 2668 2.73 11.4 46.2 336 注:CO2和CH4浓度单位为μmol·L−1,N2O为nmol·L−1;饱和度单位是%;排放通量单位是μmol·m−2·h−1. 下文同.
Notes: The unit for CO2 and CH4 is μmol·L−1, N2O: nmol·L−1; Saturation: %; Emission flux: μmol·m−2·h−1. The same below.表 3 南四湖表层水中温室气体平均溶存浓度、饱和度和排放通量与其他水体的比较
Table 3. The comparison of average concentrations, saturation and emission fluxes of greenhouse gases in surface water of Nansi Lake with those in other water bodies
N2O CH4 CO2 浓度
Concentration饱和度
Saturation排放通量
Emission
flux浓度
Concentration饱和度
Saturation排放通量
Emission
flux浓度
Concentration饱和度
Saturation排放通量
Emission
flux南四湖(本研究) 23.0③ 154② 0.22④ 0.15③ 3878① 3.95⑤ 52.4 186 658④ 巢湖[6] 23.4② 0.26③ 微山湖[16−17] 2.13⑦ 628.2⑤ 平原河网[24] 86.8① 448① 2.28① 0.86② 758② 24.1② 西北口水库[25] 0.079④ 0.44—1.44⑧ 东平湖[26] 0.33② 梅梁湾[27] −0.05⑦ 2.5⑥ −41.1⑧ 鄱阳湖[28] 0.05⑤ 4.38④ 165.5⑥ 北京内湖[29] 17.1④ 0.023⑥ 北京内湖[30] 1.1① 29.2① −8.3⑦ 五里湖[31] 1041.7③ 荷兰人工湖[32] 3409.1① 东湖[33] 17.5③ 1336.4② 注:CO2和CH4浓度单位为μmol·L−1,N2O为nmol·L−1;饱和度%;排放通量μmol·m−2·h−1. 平均值后带圈数字表示同列数据的大小排序. 北京内湖数据均为年平均数据.
Notes: The unit for CO2 and CH4 is μmol·L−1, N2O: nmol·L−1; Saturation: %; Emission flux: μmol·m−2·h−1. The circled number after the average indicates the order of the data in the same column. The data of inner lakes in Beijing are annual average data.表 4 微山湖与河口区表层水中N2O浓度与水质参数间的Pearson相关系数
Table 4. The Pearson correlation coefficients between N2O concentrations and the water quality parameters in Weishan Lake
湖区 WD SD WT pH DO TN NO3- NO2- NH3 TP DIP DOC CODMn Chl-a 微山湖(n=42) 0.322 b -0.474 a 0.059 -0.258 0.156 0.186 0.730 a 0.781 a -0.006 0.017 -0.104 0.396 a -0.076 -0.199 河口(n=9) -0.257 0.622 0.173 0.480 -0.195 0.212 0.235 -0.064 0.672 b 0.072 0.518 -0.191 -0.309 -0.519 注Note:a:P < 0.01;b:P < 0.05. -
[1] KARLÉN W. Global temperature forced by solar irradiation and greenhouse gases? [J]. Ambio, 2001, 30(6): 349-350. doi: 10.1579/0044-7447-30.6.349 [2] IPCC, 2013. Climate Change 2013: The Physical Science Basis. Contribution of Working Group I to the Fifth Assessment Report of the Intergovernmental Panel on Climate Change[R]. Cambridge University Press, Cambridge, United Kingdom and New York, NY, USA. [3] XIAO Q T, XU X F, DUAN H T, et al. Eutrophic Lake Taihu as a significant CO2 source during 2000-2015 [J]. Water Research, 2020, 170: 115331. doi: 10.1016/j.watres.2019.115331 [4] BARTOSIEWICZ M, MARANGER R, PRZYTULSKA A, et al. Effects of phytoplankton blooms on fluxes and emissions of greenhouse gases in a eutrophic lake [J]. Water Research, 2021, 196: 116985. doi: 10.1016/j.watres.2021.116985 [5] SANTOSO A B, HAMILTON D P, SCHIPPER L A, et al. High contribution of methane in greenhouse gas emissions from a eutrophic lake: A mass balance synthesis [J]. New Zealand Journal of Marine and Freshwater Research, 2021, 55(3): 411-430. doi: 10.1080/00288330.2020.1798476 [6] MIAO Y Q, HUANG J, DUAN H T, et al. Spatial and seasonal variability of nitrous oxide in a large freshwater lake in the lower reaches of the Yangtze River, China [J]. Science of the Total Environment, 2020, 721: 137716. doi: 10.1016/j.scitotenv.2020.137716 [7] 闫兴成, 张重乾, 季铭, 等. 富营养化湖泊夏季表层水体温室气体浓度及其影响因素 [J]. 湖泊科学, 2018, 30(5): 1420-1428. doi: 10.18307/2018.0523 YAN X C, ZHANG Z Q, JI M, et al. Concentration of dissolved greenhouse gas and its influence factors in the summer surface water of eutrophic lake [J]. Journal of Lake Sciences, 2018, 30(5): 1420-1428(in Chinese). doi: 10.18307/2018.0523
[8] 邓焕广, 张菊, 刘浩志, 等. 不同营养水平城市水体温室气体溶存特征及影响因素研究[J]. 聊城大学学报(自然科学版), 2022, 35(5):103-110. DENG H G, ZHANG J, LIU H Z, et al. Characteristics and the influencing factors of dissolved concentrations of greenhouse gases in urban water bodies at different nutrient levels[J]. Journal of Liaocheng University (Natural Science Edition), 2022, 35(5):103-110(in Chinese).
[9] 刘臻婧, 肖启涛, 胡正华, 等. 引江济太对太湖贡湖湾氧化亚氮通量的影响 [J]. 中国环境科学, 2020, 40(12): 5229-5236. LIU Z J, XIAO Q T, HU Z H, et al. Effects of water diversion from Yangtze River to Lake Taihu on N2O flux in Gonghu Bay, Lake Taihu [J]. China Environmental Science, 2020, 40(12): 5229-5236(in Chinese).
[10] 张萍, 张菊, 邓焕广, 等. 南四湖菹草对上覆水和表层沉积物中汞和砷的富集特征 [J]. 环境化学, 2022, 41(11): 3589-3598. doi: 10.7524/j.issn.0254-6108.2021071402 ZHANG P, ZHANG J, DENG H G, et al. Enrichment characteristics of mercury and arsenic by Potamogeton crispus in the overlying water and surface sediment of Nansi Lake [J]. Environmental Chemistry, 2022, 41(11): 3589-3598(in Chinese). doi: 10.7524/j.issn.0254-6108.2021071402
[11] 曹起孟, 刘涛, 张菊, 等. 春季南四湖表层沉积物中生物硅的分布及其影响因素 [J]. 环境化学, 2022, 41(7): 2299-2308. doi: 10.7524/j.issn.0254-6108.2021112203 CAO Q M, LIU T, ZHANG J, et al. Study on the distribution and influencing factors of biogenic silica in surface sediments of Nansi Lake in spring [J]. Environmental Chemistry, 2022, 41(7): 2299-2308(in Chinese). doi: 10.7524/j.issn.0254-6108.2021112203
[12] 张慧, 郭文建, 刘绍丽, 等. 南四湖和东平湖表层水体中抗生素污染特征和风险评价 [J]. 环境化学, 2020, 39(12): 3279-3287. doi: 10.7524/j.issn.0254-6108.2019091002 ZHANG H, GUO W J, LIU S L, et al. Contamination characteristics and risk assessment of antibiotics in surface water of Nansi Lake and Dongping Lake [J]. Environmental Chemistry, 2020, 39(12): 3279-3287(in Chinese). doi: 10.7524/j.issn.0254-6108.2019091002
[13] LIU Y, YANG L Y, JIANG W. Qualitative and quantitative analysis of the relationship between water pollution and economic growth: A case study in Nansi Lake catchment, China [J]. Environmental Science and Pollution Research International, 2020, 27(4): 4008-4020. doi: 10.1007/s11356-019-07005-w [14] DIVYA K R, ZHAO S S, CHEN Y S, et al. A comparison of zooplankton assemblages in Nansi Lake and Hongze Lake, potential influences of the East Route of the South-to-North Water Transfer Project, China [J]. Journal of Oceanology and Limnology, 2021, 39(2): 623-636. doi: 10.1007/s00343-020-9288-1 [15] ZHANG B L, CUI B H, ZHANG S M, et al. Source apportionment of nitrogen and phosphorus from non-point source pollution in Nansi Lake Basin, China [J]. Environmental Science and Pollution Research International, 2018, 25(19): 19101-19113. doi: 10.1007/s11356-018-1956-8 [16] 陈永根, 白晓华, 李香华, 等. 中国8大湖泊冬季水-气界面甲烷通量初步研究 [J]. 湖泊科学, 2007, 19(1): 11-17. doi: 10.18307/2007.0102 CHEN Y G, BAI X H, LI X H, et al. A primary study of the methane flux on the water-air interface of eight lakes in winter, China [J]. Journal of Lake Sciences, 2007, 19(1): 11-17(in Chinese). doi: 10.18307/2007.0102
[17] 陈永根, 李香华, 胡志新, 等. 中国八大湖泊冬季水-气界面CO2通量 [J]. 生态环境, 2006, 15(4): 665-669. CHEN Y G, LI X H, HU Z X, et al. Carbon dioxide flux on the water-air interface of the eight lakes in China in winter [J]. Ecology and Environment, 2006, 15(4): 665-669(in Chinese).
[18] 张晓翠, 武周虎, 王瑜, 等. 南四湖湖区富营养化变化趋势与影响因素分析 [J]. 青岛理工大学学报, 2020, 41(1): 81-87. ZHANG X C, WU Z H, WANG Y, et al. Analysis of the eutrophication variation trends and influencing factors in Nansi Lake area [J]. Journal of Qingdao University of Technology, 2020, 41(1): 81-87(in Chinese).
[19] 邓焕广, 张智博, 刘涛, 等. 城市湖泊不同水生植被区水体温室气体溶存浓度及其影响因素 [J]. 湖泊科学, 2019, 31(4): 1055-1063. doi: 10.18307/2019.0409 DENG H G, ZHANG Z B, LIU T, et al. Dissolved greenhouse gas concentrations and the influencing factors in different vegetation zones of an urban lake [J]. Journal of Lake Sciences, 2019, 31(4): 1055-1063(in Chinese). doi: 10.18307/2019.0409
[20] 魏复盛主编. 国家环境保护总局, 水和废水监测分析方法编委会编. 水和废水监测分析方法[M]. 4版. 北京: 中国环境科学出版社, 2002. WEI F S. State Environmental Protection Administration, Water and wastewater monitoring and analysis methods[M]. 4thed. Beijing: China Environmental Science Press, 2002(in Chinese).
[21] WANG D Q, CHEN Z L, SUN W W, et al. Methane and nitrous oxide concentration and emission flux of Yangtze Delta plain river net [J]. Science in China Series B:Chemistry, 2009, 52(5): 652-661. doi: 10.1007/s11426-009-0024-0 [22] YU Z J, DENG H G, WANG D Q, et al. Nitrous oxide emissions in the Shanghai River network: Implications for the effects of urban sewage and IPCC methodology [J]. Global Change Biology, 2013, 19(10): 2999-3010. doi: 10.1111/gcb.12290 [23] DEEMER B R, HOLGERSON M A. Drivers of methane flux differ between lakes and reservoirs, complicating global upscaling efforts [J]. Journal of Geophysical Research:Biogeosciences, 2021, 126(4): e2019JG005600. [24] 胡蓓蓓, 谭永洁, 王东启, 等. 冬季平原河网水体溶存甲烷和氧化亚氮浓度特征及排放通量 [J]. 中国科学:化学, 2013, 43(7): 919-929. HU B B, TAN Y J, WANG D Q, et al. Methane and nitrous oxide dissolved concentration and emission flux of plain river network in winter [J]. Scientia Sinica(Chimica), 2013, 43(7): 919-929(in Chinese).
[25] 王雪竹, 刘佳, 牛凤霞, 等. 基于走航高频监测的水库冬季水体溶解甲烷浓度分布: 以湖北西北口水库为例 [J]. 湖泊科学, 2021, 33(5): 1564-1573. doi: 10.18307/2021.0524 WANG X Z, LIU J, NIU F X, et al. Dissolved methane concentration distribution of reservoir in winter based on the underway high-resolution monitoring: A case study of the Xibeikou Reservoir in Hubei Province [J]. Journal of Lake Sciences, 2021, 33(5): 1564-1573(in Chinese). doi: 10.18307/2021.0524
[26] 刘涛. 东平湖优势水生植物对水体氮转化的影响[D]. 聊城: 聊城大学, 2021. LIU T. Effects of dominant aquatic plants on nitrogen transformation in lake Dongping[D]. Liaocheng: Liaocheng University, 2021(in Chinese).
[27] 李香华. 太湖水-气界面温室气体通量及时空变化特征研究[D]. 南京: 河海大学, 2005. LI X H. Study of the greenhouse gas flux of water-air interface and its spatio-temporal change in Taihu Lake[D]. Nanjing: Hohai University, 2005(in Chinese).
[28] 林茂. 鄱阳湖水-气界面温室气体通量研究[D]. 北京: 北京林业大学, 2012. LIN M. Greenhouse gas fluxes on the water-air interface of Poyang Lake[D]. Beijing: Beijing Forestry University, 2012(in Chinese).
[29] WANG G Q, XIA X H, LIU S D, et al. Distinctive patterns and controls of nitrous oxide concentrations and fluxes from urban inland waters [J]. Environmental Science & Technology, 2021, 55(12): 8422-8431. [30] WANG G Q, XIA X H, LIU S D, et al. Intense methane ebullition from urban inland waters and its significant contribution to greenhouse gas emissions [J]. Water Research, 2021, 189: 116654. doi: 10.1016/j.watres.2020.116654 [31] XIAO Q T, DUAN H T, QI T C, et al. Environmental investments decreased partial pressure of CO2 in a small eutrophic urban lake: Evidence from long-term measurements [J]. Environmental Pollution, 2020, 263: 114433. doi: 10.1016/j.envpol.2020.114433 [32] VAN BERGEN T, BARROS N, MENDONCA R, et al. Seasonal and diel variation in greenhouse gas emissions from an urban pond and its major drivers [J]. Limnology and Oceanography, 2019, 64(5): 2129-2139. doi: 10.1002/lno.11173 [33] XING Y P, XIE P, YANG H, et al. Methane and carbon dioxide fluxes from a shallow hypereutrophic subtropical Lake in China [J]. Atmospheric Environment, 2005, 39(30): 5532-5540. doi: 10.1016/j.atmosenv.2005.06.010 [34] FREYMOND C V, WENK C B, FRAME C H, et al. Year-round N2O production by benthic NOx reduction in a monomictic south-alpine lake [J]. Biogeosciences, 2013, 10(12): 8373-8383. doi: 10.5194/bg-10-8373-2013 [35] 杨平, 仝川, 何清华, 等. 闽江口养殖塘水-大气界面温室气体通量日进程特征 [J]. 环境科学, 2012, 33(12): 4194-4204. YANG P, TONG C, HE Q H, et al. Diurnal variations of greenhouse gas fluxes at the water-air interface of aquaculture ponds in the Min River Estuary [J]. Environmental Science, 2012, 33(12): 4194-4204(in Chinese).
[36] 张力, 张振华, 高岩, 等. 不同水生植物对富营养化水体释放气体的影响 [J]. 生态与农村环境学报, 2014, 30(6): 736-743. ZHANG L, ZHANG Z H, GAO Y, et al. Effect of aquatic plants on emission of gases from eutrophic water [J]. Journal of Ecology and Rural Environment, 2014, 30(6): 736-743(in Chinese).
[37] KLÜBER H D, CONRAD R. Effects of nitrate, nitrite, NO and N2O on methanogenesis and other redox processes in anoxic rice field soil [J]. FEMS Microbiology Ecology, 1998, 25(3): 301-318. doi: 10.1111/j.1574-6941.1998.tb00482.x [38] 曾从盛, 王维奇, 仝川. 不同电子受体及盐分输入对河口湿地土壤甲烷产生潜力的影响 [J]. 地理研究, 2008, 27(6): 1321-1330. ZENG C S, WANG W Q, TONG C. Effects of different exogenous electron acceptors and salt import on methane production potential of estuarine marsh soil [J]. Geographical Research, 2008, 27(6): 1321-1330(in Chinese).
[39] MA Y C, SUN L Y, LIU C Y, et al. A comparison of methane and nitrous oxide emissions from inland mixed-fish and crab aquaculture ponds [J]. Science of the Total Environment, 2018, 637/638: 517-523. doi: 10.1016/j.scitotenv.2018.05.040 [40] PEACOCK M, AUDET J, BASTVIKEN D, et al. Small artificial waterbodies are widespread and persistent emitters of methane and carbon dioxide [J]. Global Change Biology, 2021, 27(20): 5109-5123. doi: 10.1111/gcb.15762 -


 下载:
下载:


