-
地表水中可溶性阳离子(Li+、Na+、NH4+、K+、Ca2+、Mg2+)是水环境监测的常规项目[1],实验室主要采用ICP-MS(电感耦合等离子体质谱仪)测定Li+,采用ICP-OES(全谱直读等离子体发射光谱仪)测定K+、Na+、Ca2+和Mg2+,采用紫外分光光度法或快速化学分析仪测定NH4+, 以上6种阳离子需要使用3种不同的方法分别测定,耗时长,易受干扰,因此建立6种阳离子高效快速的检测方法十分必要[2-3].
近年来关于一些学者采用离子色谱法测定水体阳性离子的报道,大多数是同时测定4种或是5种可溶性阳离子,如赵云[4]研究了离子色谱同时检测地表水中的Na+、K+、Mg2+、Ca2+等4种阳离子的快速测定方法,马丽萍和杨磊[5]以及王晓梅[6]建立了利用离子色谱法同时测定不同水体中K+、Na+、Ca2+、Mg2+、NH4+等5种可溶性阳离子,然而关于城市河道中6种可溶性阳离子Li+、NH4+、Na+、K+、Mg2+、Ca2+同时测定鲜有报道.
分析水体中不同阳性离子组分对了解区域内水体污染情况和生态环境状况具有重要的指导意义,本文对北京市不同区域河道水体中的阳离子变化进行了季节性监测,取样点多,检测工作量大,而利用离子色谱法最大的优点是可同时测定多种离子,节约人力成本及时间成本,同时具有样品预处理简便、检出限及检测限低、速度快、灵敏度高、无污染、稳定性好的优势,使其在地表水环境的监测中发挥了重要作用.
因此,本文为了全面、准确地监测北京市不同区域河道水体可溶性阳离子变化,建立了离子色谱法同时测定水体中Li+、Na+、NH4+、K+、Ca2+、Mg2+ 的6种阳离子的方法,分析北京市不同区域河道水体中可溶性阳离子随季节变化情况,掌握河道水体生态环境状况,有利于水体生态环境保护.
-
(1)离子色谱仪:ICS-1000型(美国戴安公司),配有DionexIonPac CG12A 阳离子保护柱(4 mm×50 mm),CS 12A 阳离子分离柱(4 mm×250 mm),CSRS 300 型抑制器(4 mm),电导检测器,AS自动进样器.
(2)超纯水仪:美国密理博公司Milli-Q超纯水仪,型号:Advantage A10,电导率为18MΩ·cm(25 ℃).
(3)甲基磺酸(MSA):质量分数为 99%,美国赛默飞世尔科技有限公司.
(4)Li+、Na+、NH4+、K+、Mg2+、Ca2+标准溶液:编号分别为GSB 04-1734—2004、GSB 04-1738—2004、GSB 04-2832—2011、GSB 04-1733—2004、GSB 04-1735—2004、GSB 04-1720—2004,质量浓度均为1000 mg·L−1,购于国家有色金属及电子材料分析测试中心.
Li+标准物质(0.762±0.034)mg·L−1,编号为BY400060,批号为B21060436;Na+标准物质(11.9±0.6)mg·L−1,编号为BY400059,批号为B21110027;NH4+标准物质(0.65±0.03)mg·L−1,编号为BY400064,批号为B21060262;K+标准物质(6.36±0.51)mg·L−1,编号为BY400061,批号为B21070308;Mg2+标准物质(5.56±0.27)mg·L−1,编号为BY400063,批号为B21080031;Ca2+标准物质(20.4±2.0)mg·L−1,编号为BY400062,批号为B21080029. 所有标准物质均购于坛墨质检科技股份有限公司.
-
进样体积25 µL ,抑制器电流59 mA ,柱流速1.00 mL·min−1,柱温保持在30 ℃,淋洗液浓度 20 mmol·L−1.
-
分别移取5mLLi+标准工作液(1000 mg·L−1)和5mLNH4+标准工作液(1000 mg·L−1)于两个50 mL容量瓶中,用水稀释后定容至标线混匀,Li+储备液和NH4+储备液浓度为100 mg·L−1,标准曲线溶液配制具体见表1.
-
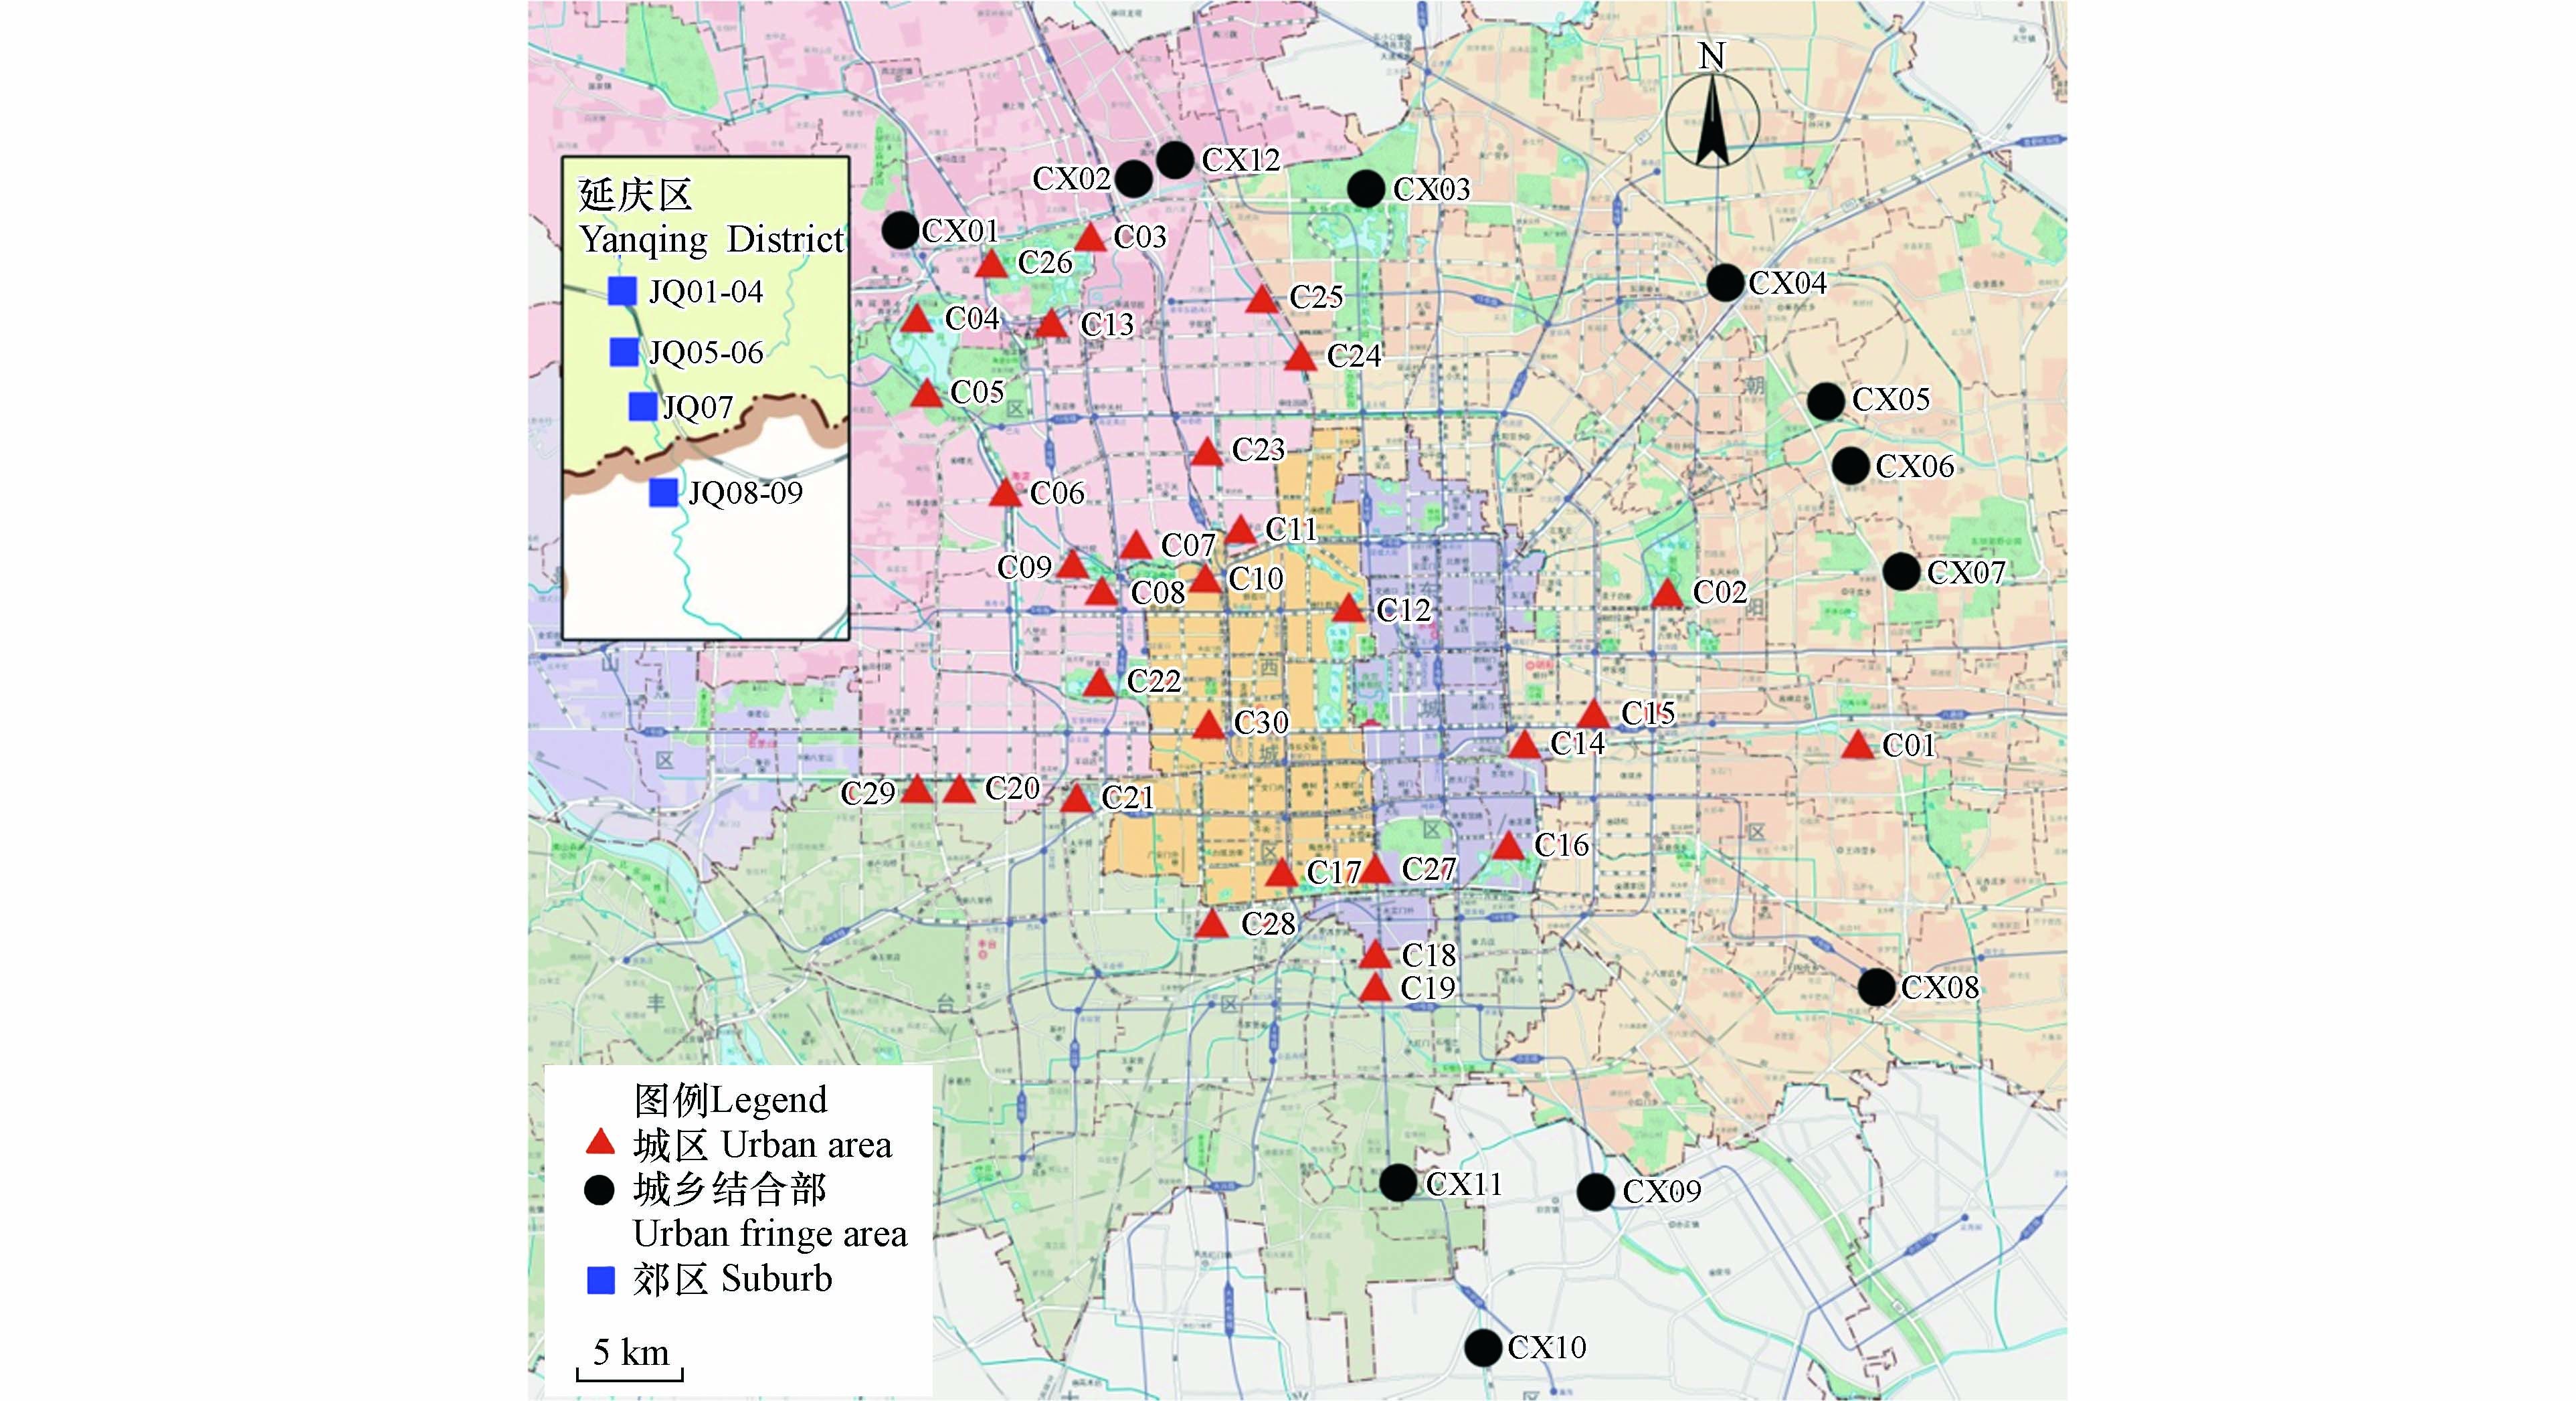
本次研究分别于2021年3月、6月、9月和11月采集城区、城乡结合部和郊区水样,其中城区样品29个位点,城乡结合部11个位点,郊区9个位点,具体采样点见图1. 不同区域河水样品中阳离子(Li+、Na+、NH4+、K+、Ca2+、Mg2+)含量采用离子色谱法测定,根据区域分类求出测定数据的算术平均值.
根据《水环境监测规范》SL 219—2013 [7]要求采集地表水样品,采集样品分装于1 L聚乙烯瓶中,每瓶样品中加入pH≤2的浓HNO3并放置于4 ℃冰箱中避光保存,备用. 待测水样经0.45 μm微孔滤膜过滤,在1.2节仪器工作条件下进样测定.
-
根据1.3节溶液配制方法配制成 8个不同浓度的混合标准系列,横坐标为待测离子的质量浓度(X),纵坐标为色谱峰面积(Y),以此绘制标准工作曲线,计算线性方程和相关系数,结果如表2所示,6种阳离子在0.01—0.50 mg·L−1到5.0—100.0 mg·L−1浓度范围内具有较好的线性关系,相关系数均大于0.999.
-
以同样方法对在超纯水中加入标准溶液的样品进行测定和分析,计算加入标准溶液后7个平行结果的标准偏差,方法检出限 =3.143×标准偏差,以4倍检出限作为测定下限,测定结果如表3所示,方法检出限为0.002—0.020 mg·L−1,测定下限为0.008—0.080 mg·L−1.
-
分别对6种阳离子进行低、中、高的标准溶液7次重复测定,计算3种标准溶液6种阳离子浓度的平均值和相对标准偏差,结果如表4所示,6种阳离子在低、中和高的3种标准溶液的测定结果相对标准偏差分别为0.52%—2.98%、0.17%—1.25%和0.10%—0.94%,证明此方法灵敏度高,可满足地表水中6种阳离子的同时测定要求.
-
分别对有证标准溶液 Li+(B2103065)、Na+(B21050087)、NH4+(B2101055)、K+(B1905134)、Ca2+(B2105014)、Mg2+(B21040276)进行6次平行测定,测定结果见表5,其结果均在保证值范围,相对标准偏差为0.19%—1.73%,相对误差在-2.50%—4.38%范围之内,说明该方法具有较高的准确性。
-
将已知浓度的阳离子标准溶液加入到实际地表水水样中,并按照试验方法,进行7次重复测定,回收率结果如表6所示. 根据《水环境监测规范》SL 219—2013的相关要求,回收率要求控制在 90%—110% 之间[7],由表6 可知,样品回收率为 90.7%—107.5%,均在控制范围内,表明该方法准确度较高,可用于地表水中6种阳离子测定.
-
北京市不同区域水体水化学统计特征见表7,河水pH 值变化范围为 6. 94—9. 69,城乡结合部、城区和郊区的pH均值分别为8.31、8.74和7.55,均呈弱碱性,变异系数分别为 4.33%、4.12%和4.61%,3个区域变异系数相差不大,表明pH在不同区域水体内较稳定.
由表7可知,城乡结合部区域6种阳离子总体质量浓度为150.05 mg·L−1,高于城区和郊区25.35%和63.54%;3个区域阳离子浓度均值均为:Ca2+> Na+>Mg2+> K+>NH4+>Li+. 不同区域阳离子组分中,Ca2+含量较高,自然水体的主要离子来源包括自然因素和人为因素。自然因素主要是大气沉降和岩石矿物风化,人为因素主要是人为活动输入,当水体受岩石风化影响时阳离子组分多在 Ca2+一端[8-9].
Li+质量浓度最低,均低于各自区域阳离子总质量浓度的0.1%;NH4+浓度在各区域均呈稳定状态且低于0.2 mg·L−1,均达到地表水二类标准;Ca2+和 Na+是3个区域水体的优势离子,浓度分别为52.49—59.61 mg·L−1和23.84—58.39 mg·L−1,Ca2+和Na+质量浓度占阳离子总浓度的78.13%—85.82%,二者变异系数均值分别为28.76%和53.19%,表明Ca2+含量在流域内变化不大,水体中各类风化岩石等天然矿物含量丰富,地表水中Ca2+主要由岩石土壤等与地表水充分接触并缓慢溶解,使得3个区域Ca2+浓度明显高于其他阳离子.
城乡结合部和城区Na+质量浓度明显高于郊区,居民排放的生活污水中含有一定的Na+,有研究证明Na+作为人类活动影响水体的指标,可以指征生活污水排放对自然水体环境的影响[10-12].
-
不同水体阳离子之间的相关性以及离子来源是否一致可以通过相关性分析表示,利用 SPSS 软件分别计算郊区、城乡结合部和城区水体6种阳离子之间的 Pearson 相关性系数,用 r值表示(表8),其中,r > 0 表示两变量呈正相关,r < 0 表示两变量呈负相关.
由表8可知,郊区水体中,Na+与Ca2+、Mg2+呈显著负相关,相关系数分别是-0.889和-0.778,与Li+呈显著正相关,相关系数为0.500;Ca2+与Mg2+呈显著正相关,相关系数分别是0.932;NH4+与Li+呈显著负相关,相关系数为-0.641. 城乡结合部水体中,K+与Na+、Ca2+、Mg2+、Li+呈显著正相关,相关系数分别为0.906、0.684、0.651和0.648;Na+与Ca2+、Mg2+、Li+呈显著正相关,相关系数分别为0.755、0.793和0.614;Ca2+与Mg2+呈显著正相关,相关系数为0.862. 城区水体中,K+与Na+、Ca2+、Mg2+、Li+呈显著正相关,相关系数分别为0.841、0.478、0.551和0.658;Na+与Ca2+、Mg2+、Li+呈显著正相关,相关系数分别为0.470、0.834和0.797;Ca2+与Mg2+、Li+呈显著正相关,相关系数分别是0.639和0.289;Mg2+与Li+呈显著正相关,相关系数为0.663.
综上分析可知,城乡结合部和城区的水体各离子间相关性变化规律较为接近,说明城区水体和城乡结合部水体有较密切的联系;郊区水体中Na+与Ca2+、Mg2+呈显著负相关,而城乡结合部和城区水体Na+与Ca2+、Mg2+呈显著正相关,推测可能受到了人为因素的影响;城乡结合部、城区和郊区水体Ca2+与Mg2+呈显著正相关,说明来源于相同的岩石风化过程.
-
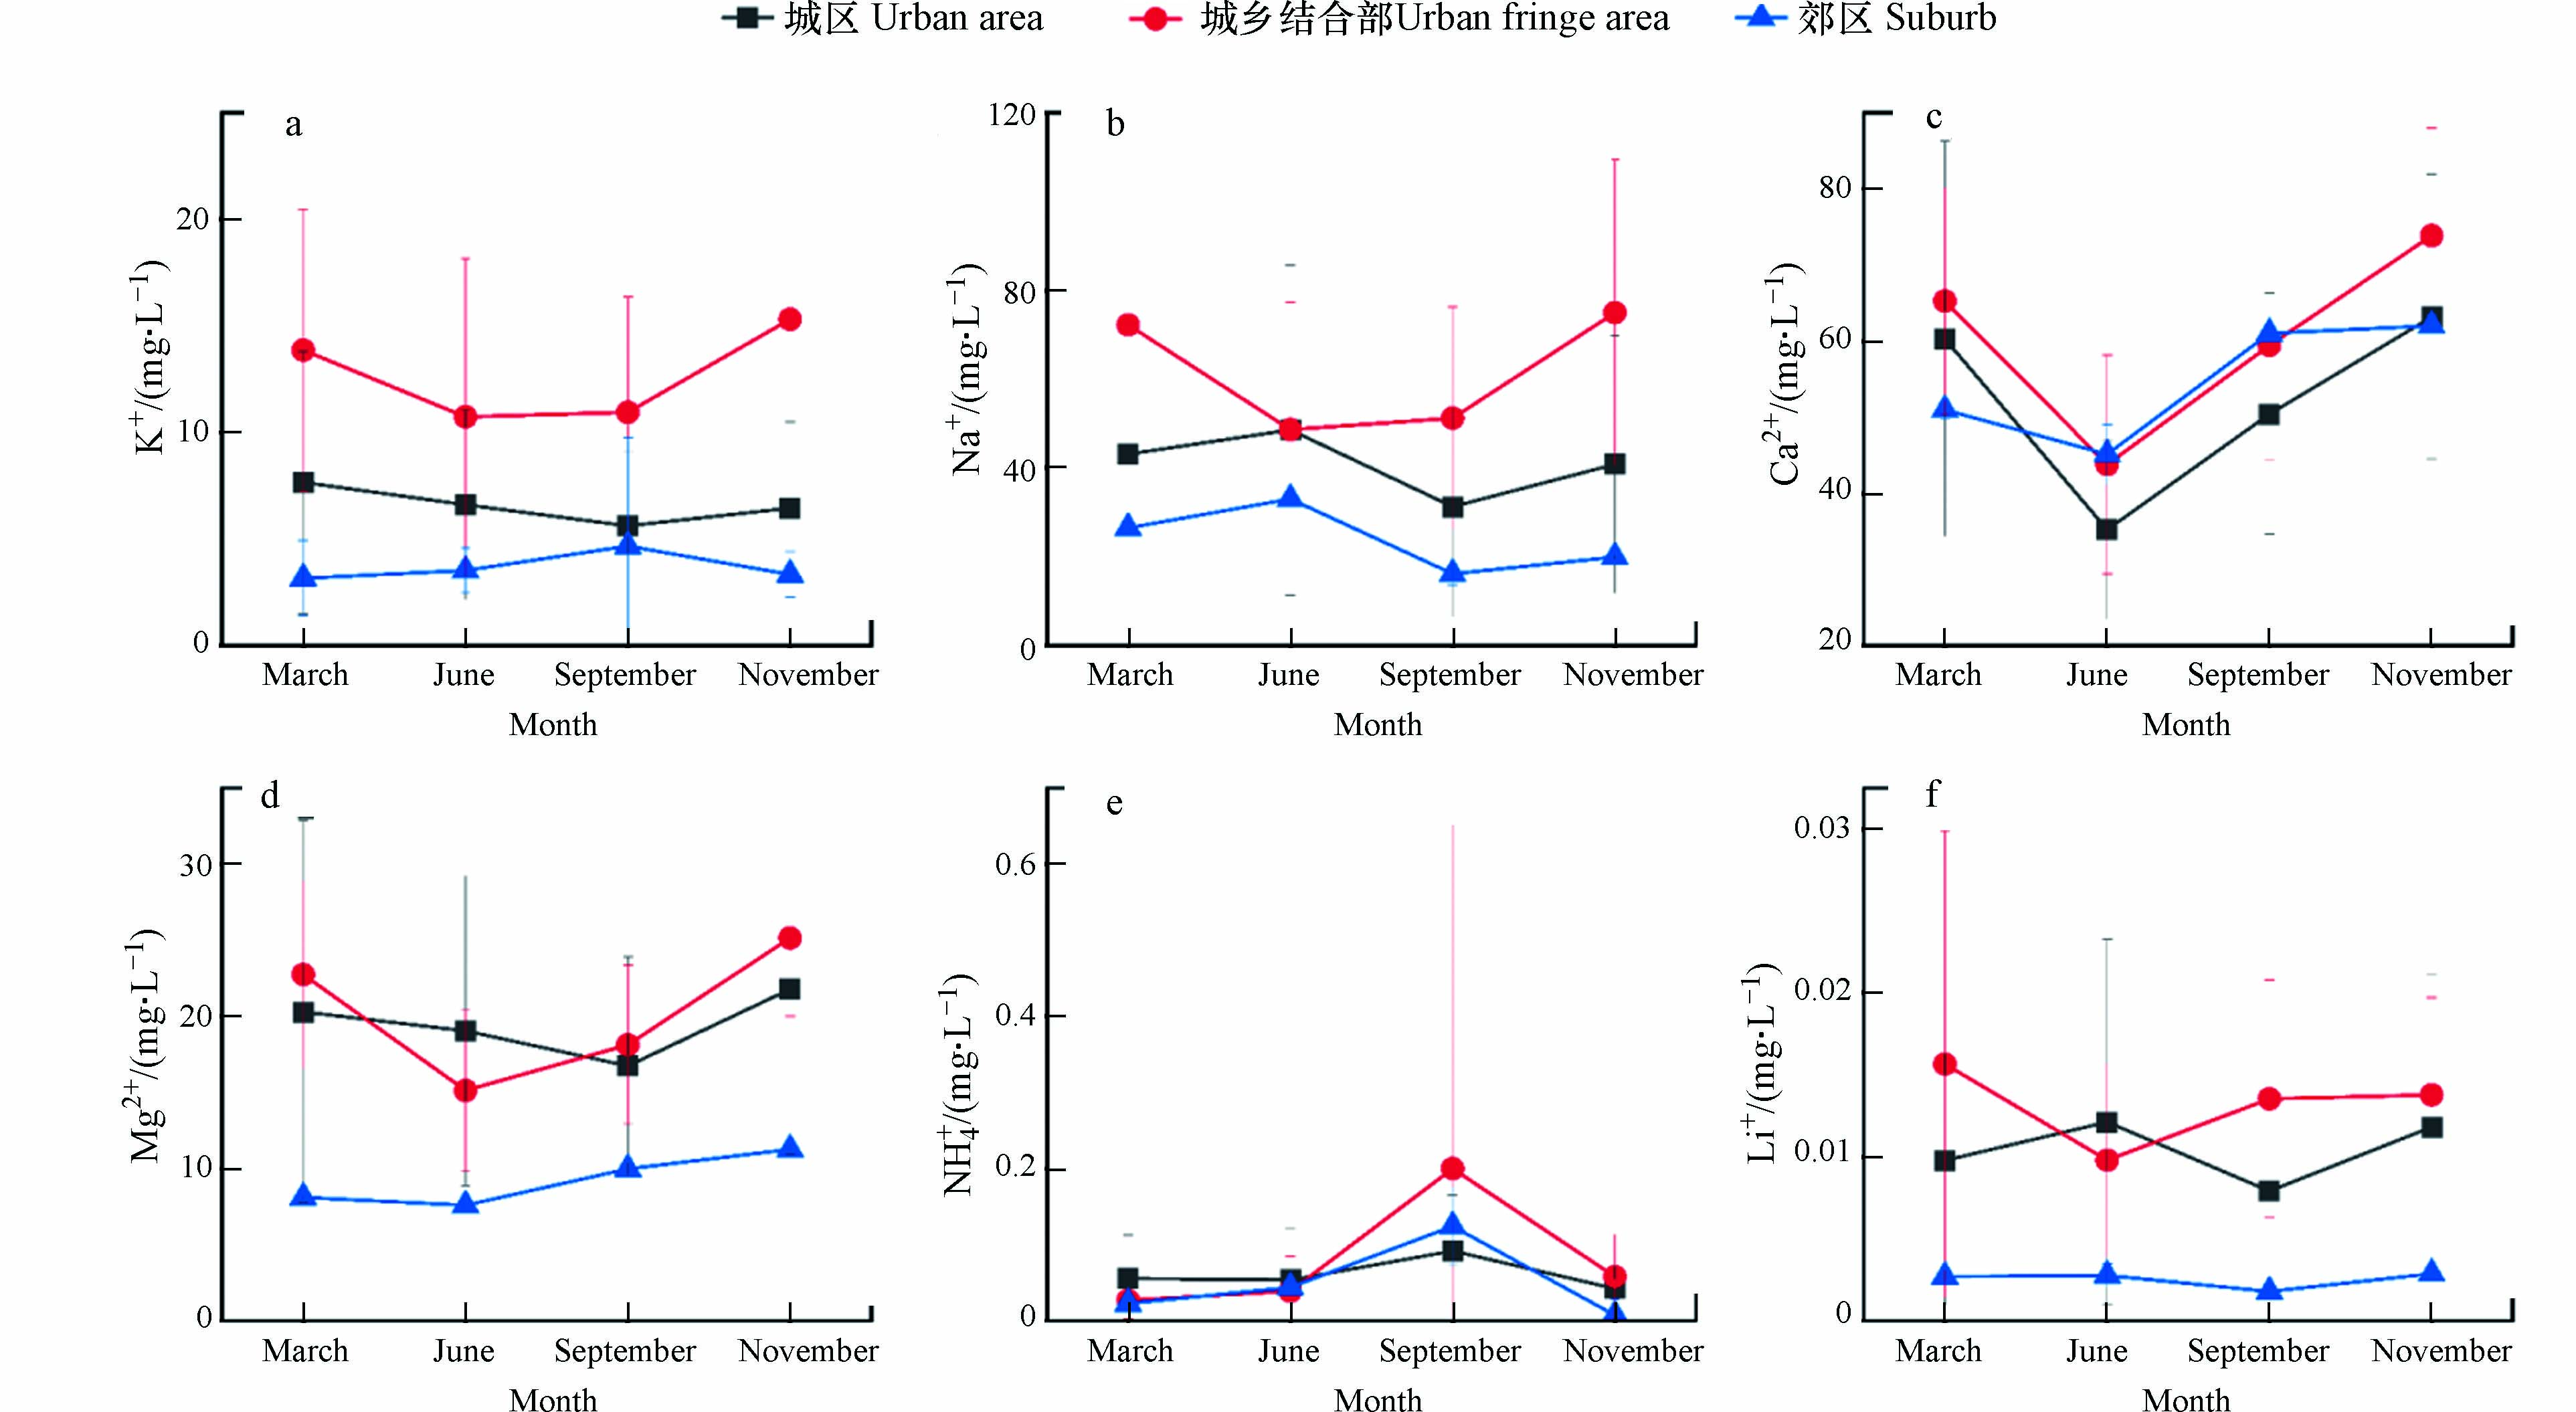
选取北京市城区、郊区和城乡结合部等不同区域水体,对其3月、6月、9月和11月的阳离子指标进行空间分布格局的对比分析(图2)发现,6种阳离子浓度变化存在一定的差异,除郊区外,城区和城乡结合部区域阳离子浓度变化具有明显季节性.
由图2可以看出,城乡结合部和城区水体中K+、Ca2+、Na+和Mg2+等4种阳离子质量浓度3月和11月份的监测均值高于6月和9月份,这4种阳离子浓度春季、冬季高于夏季、秋季,北京地区属于典型的北温带半湿润大陆性季风气候,夏季雨水较多、温度高,6—10月是主要的降雨期,降雨期时自然水体水量增加,在无外来离子来源情况下,降水对自然水体化学组分起到稀释作用,特别是对阳离子的稀释更为明显,因此冬季时阳离子浓度低于夏季[13-14].
城乡结合部水体3月和11月阳离子总质量浓度达到了174.1 mg·L−1和189.3 mg·L−1,6月和9月为118.3 mg·L−1和139.8 mg·L−1;城区水体3月和11月阳离子总质量浓度达到了131.4 mg·L−1和132.3 mg·L−1, 6月和9月为109.5 mg·L−1和104.1 mg·L−1. 城乡结合部水体中Na+和Ca2+是占绝对优势的离子,3月、6月、9月和11月的Na+占各月份总量的41.49%、41.11%、36.66%和39.61%,Ca2+占各月份总量的37.49%、37.01%、42.53%和39.01%;城区水体中3月、9月和11月Ca2+占优势,占水体中各月份总量的45.89%、48.45%和47.77%, 6月水体中Na+是占优势的离子,占总量的44.37%.
郊区水体中K+、Na+、Ca2+和Mg2+4种阳离子浓度变化不大,3月、6月、9月和11月阳离子总质量浓度分别为88.7 mg·L−1、89.3 mg·L−1、91.8 mg·L−1和96.6 mg·L−1;水体中Ca2+是占绝对优势的离子,分别占各月份离子总量的57.45%、50.54% 、66.45%和64.22%.
3个区域水体的NH4+质量浓度在3月、6月和12月变化不大,均值分别为0.035 mg·L−1、0.046 mg·L−1和0.036 mg·L−1,九月份NH4+质量浓度最高,均值达到0.139 mg·L−1,高于其他月份3—4倍,主要原因是夏季过后秋季降雨量明显减少,径流量降低,含NH4+污染物排入河道中得不到有效稀释,从而导致地表水中有机污染物浓度升高,NH4+质量浓度也随之增大.
本研究中3个区域各月份Li+质量浓度均低于0.02 mg·L−1,且在各月份中浓度变化不大,因此本文未对Li+变化情况进行讨论.
-
(1)本文建立了利用离子色谱测定地表水中Li+、Na+、NH4+、K+、Ca2+、Mg2+等6种可溶性阳离子的方法,其标准曲线、精密度、准确度、最低检出限和加标回收率均符合相关技术要求,实现了6种阳离子同时检测,同时适用于地表水中水溶性阳离子测定.
(2)通过对北京市不同区域水体6种阳离子分布特征分析可知,3个区域水体整体呈弱碱性,城乡结合部区域6种阳离子总浓度高于城区区域和郊区区域;3个区域阳离子浓度均值大小均为:Ca2+> Na+>Mg2+> K+>NH4+>Li+,主要的阳离子Ca2+和 Na+,二者质量浓度占阳离子总浓度的78.13%—85.82%.
(3)通过对不同水体阳离子之间的相关性可知,城乡结合部和城区的水体各离子间相关性变化规律较为接近;城乡结合部和城区水体Na+与Ca2+、Mg2+呈显著正相关,郊区水体中则相反;城乡结合部、城区和郊区水体Ca2+与Mg2+均呈显著正相关.
(4)不同区域水体阳离子浓度变化存在一定差异,城区和城乡结合部区域阳离子浓度受季节变化影响,具有明显的季节性特征,春冬季阳离子浓度高于夏秋季,而郊区水体阳离子浓度年度变化不大.
离子色谱法同时测定北京市不同区域水体6种阳离子
Ion chromatography for simultaneously determining six cations in water bodies of different areasof Beijing
-
摘要: 建立离子色谱法测定不同区域水体Li+、Na+、NH4+、K+、Ca2+、Mg2+等6种阳离子的方法,以及验证方法在实际应用的可行性. 以 ICS1000型离子色谱仪配有DionexIonPac CG12A 阳离子保护柱(4 mm×50 mm)和CS 12A 阳离子分离柱(4 mm×250 mm),CSRS 300 型抑制器(4 mm),甲基磺酸为淋洗液,流量为1.0 mL·min−1,6种阳离子的质量浓度在0.01—0.50 mg·L−1到5.0—100.0mg·L−1范围内线性较好,相关系数>0.9995,方法检出限为0.002—0.020 mg·L−1,与有证标准溶液相对误差−2.50%—4.38%(n=6),不同环境水样加标回收率90.7%—107.5%. 利用以上色谱条件分析北京市不同区域地表水阳离子分布特征,结果显示城乡结合部、城区和郊区水体pH稳定,呈弱碱性;城乡结合部水体6种阳离子总浓度为150.05 mg·L−1,明显高于城区和郊区25.35%和63.54%,阳离子浓度均值大小为:Ca2+> Na+>Mg2+> K+>NH4+>Li+,其中Ca2+和 Na+是3个区域水体的优势离子,NH4+和Li+质量浓度最低;城乡结合部和城区水体阳离子浓度在夏季和秋季低于春季和冬季. 实验结果表明,离子色谱法样品处理简便,分析速度快,准确可靠,灵敏度高,重复性好,适用于地表水中6种水溶性阳离子的快速批量测定.Abstract: A method for determination of Li+, Na+, NH4+, K+, Ca2+ and Mg2+in different areas of water bodies by ion chromatography was established, and verify the feasibility of the method’s chromatographic conditions and characteristic indexes in the laboratory. The method precautions were also discussed for the reference of model ICS1000 chromatography with DionexIonPac CG12A cation protection column (4 mm × 50 mm) and CS 12A cation separation column (4 mm×250 mm), CSRS 300 suppressed conductivity detector (4 mm), methane sulfonic acid as eluent, and flow rate of 1.0 mL·min−1. The mass concentration of six cations had a good linear relationship with the chromatographic peak area in the range of 0.01—0.50 mg·L−1and 5.0—100.0 mg·L−1, correlation coefficient > 0.9995, and the detection limits of the method were 0.002—0.020 mg·L−1, the relative error of −2.50%—4.38%(n=6)with the certified standard solution, and the recovery rate of standard addition of water samples measured in different environments was 90.7%—107.5%. Six cations in different areas of water bodies in Beijing were analyzed according to the above-mentioned chromatography conditions, and the result reflects that water bodies were weakly alkaline and pH was stable, the total concentration of six cations (150.05 mg·L−1) in the urban and rural joint area was higher than the city proper and the suburbs (25.35% and 63.54%); Order of mean values of cation concentrations: Ca2+> Na+>Mg2+> K+>NH4+>Li+, Ca2+ and Na+ were the dominant ions, while NH4+ and Li+ had the lowest concentrations. The total concentration of six cations of the urban and rural joint area and city area in summer and autumn was lower than in spring and winter. The results showed that the method is simple sample preparation, rapid determination, high sensitivity and accuracy, good repeatability, which is suitable for rapid determination of cations in surface water.
-
Key words:
- ion chromatography /
- cations /
- surface water /
- distribution characteristics.
-

-
表 1 标准曲线溶液配制(mg·L−1)
Table 1. Preparation of calibration solution (mg·L−1)
离子
Cations标准溶液 Standard Solution 1 2 3 4 5 6 7 8 Li+ 0.01 0.05 0.10 0.20 0.50 1.00 2.00 5.00 Na+ 0.20 0.50 1.00 2.00 5.00 10.00 20.00 50.00 NH4+ 0.01 0.05 0.10 0.20 0.50 1.00 2.00 5.00 K+ 0.50 1.00 2.00 5.00 10.00 20.00 50.00 100.0 Mg2+ 0.50 1.00 2.00 5.00 10.00 20.00 50.00 100.0 Ca2+ 0.50 1.00 2.00 5.00 10.00 20.00 50.00 100.0 表 2 标准工作曲线的回归方程和相关系数
Table 2. Regression equations and correlation coefficientsofthestandard curve
出峰顺序
Peak occurrence sequence离子名称
Cations线性方程
Linear equations相关系数
Related coefficient1 Li+ Y=0.9249X+0.0026 0.9999 2 Na+ Y=0.3115X+0.0490 0.9999 3 NH4+ Y=−0.0185X2+0.3390X+0.0173 0.9997 4 K+ Y=0.1899X+0.0553 0.9996 5 Mg2+ Y=0.4900X+0.1890 0.9998 6 Ca2+ Y=0.3768X-0.0918 0.9998 表 3 方法的检出限、测定下限(mg·L−1)
Table 3. Method detection limit and the limit of quantitation(mg·L−1)
离子名称
Cations平均值
Average value标准偏差
Standard deviation方法检出限
Method detection limit测定下限
Limit of quantitationLi+ 0.0507 0.0005 0.002 0.008 Na+ 0.0530 0.0021 0.01 0.04 NH4+ 0.0576 0.0031 0.01 0.04 K+ 0.4830 0.0026 0.01 0.04 Mg2+ 0.5195 0.0048 0.01 0.04 Ca2+ 0.4848 0.0027 0.02 0.08 表 4 不同浓度标准溶液的测定平均值和相对标准偏差
Table 4. Measured meanconcentrations and relative standard deviations of standard solutions with different concentrations
离子
Cations低浓度/(mg·L−1)
Low concentration相对标准偏差/%
Relative standard
deviation中浓度/(mg·L−1)
Medium
concentration相对标准偏差/%
Relative standard
deviation高浓度/(mg·L−1)
High concentration相对标准偏差/%
Relative standard
deviationLi+ 0.05 1.45 0.53 0.40 1.08 0.46 Na+ 0.55 0.52 12.68 0.87 21.47 0.10 NH4+ 0.11 2.98 1.15 1.25 5.77 0.36 K+ 0.26 0.76 7.34 0.64 21.74 0.94 Mg2+ 0.22 1.29 5.64 0.77 22.67 0.19 Ca2+ 0.76 0.82 5.48 0.17 21.16 0.18 表 5 有证标准溶液阳离子浓度测定结果
Table 5. Results of determination of cationic concentration in certified standard solution
离子
Cations平均值/(mg·L−1)
Average value标准样品浓度/(mg·L−1)
Standard sample concentration相对标准偏差/%
Relative standard deviation相对误差/%
Relative errorLi+ 0.77 0.76±0.03 1.41 0.72 Na+ 12.35 11.90±0.60 0.19 3.82 NH4+ 0.63 0.65±0.03 1.73 −2.50 K+ 6.34 6.36±0.51 0.74 −0.29 Mg2+ 5.68 5.56±0.27 1.45 2.11 Ca2+ 21.29 20.4±2.0 0.33 4.38 表 6 阳离子的加标回收率
Table 6. Therecovery rates of spiked cations
离子
Cations原样浓度/(mg·L−1)
Original concentration加标量/(mg·L−1)
Added scalar quantity加标回收率/%
Recovery rateLi+ 0.0167 0.05 90.7 0.50 103.0 5.00 97.4 Na+ 109.8143 0.50 98.1 5.00 99.5 50.00 95.9 NH4+ ND 0.05 92.6 0.50 96.2 5.00 97.9 K+ 12.2641 1.00 93.0 20.00 107.5 50.00 103.7 Mg2+ 41.7051 1.00 92.8 20.00 106.7 50.00 104.5 Ca2+ 93.1263 1.00 98.1 20.00 105.8 50.00 99.3 表 7 3个区域水体水化学特征值
Table 7. Hydrochemical characteristic values of water bodies in thethreeareas
区域
Region项目
ItempH 离子/(mg·L−1)
CationsK+ Na+ Ca2+ Mg2+ NH4+ Li+ 城乡
结合部最大值 9.45 29.07 112.13 94.56 31.72 1.47 0.031 最小值 7.45 1.63 6.09 26.52 6.93 0.00 0.001 平均值 8.31 12.34 58.39 59.61 19.59 0.11 0.013 标准差 0.36 7.15 30.79 18.52 6.52 0.28 0.006 变异系数CV/% 4.33 57.94 52.73 31.07 33.28 254.6 46.15 城区 最大值 9.69 20.31 109.16 131.59 49.17 0.23 0.044 最小值 7.73 1.53 4.85 19.92 6.65 0.00 0.00 平均值 8.74 6.63 41.04 52.49 19.48 0.06 0.010 标准差 0.36 4.71 32.14 21.76 10.47 0.07 0.01 变异系数CV/% 4.12 71.04 78.31 41.46 53.75 116.7 100.0 郊区 最大值 8.49 18.19 35.48 64.82 11.71 0.20 0.004 最小值 6.94 2.30 9.59 36.04 7.06 0.00 0.001 平均值 7.55 3.69 23.84 54.90 9.27 0.05 0.003 标准差 0.35 2.75 6.80 7.55 1.53 0.06 0.001 变异系数CV/% 4.64 74.53 28.52 13.75 16.50 120.0 33.33 表 8 3个区域水体阳离子相关性矩阵
Table 8. Correlation matrices of cation concentrations of water bodies in the three areas
郊区 Suburb K+ Na+ Ca2+ Mg2+ NH4+ Li+ K+ 1 −0.042 0.089 0.076 −0.110 0.105 Na+ 1 −0.889*** −0.778*** −0.354 0.500* Ca2+ 1 0.932*** 0.160 −0.227 Mg2+ 1 −0.004 −0.110 NH4+ 1 −0.641*** Li+ 1 城乡结合部 Urban fringe area K+ Na+ Ca2+ Mg2+ NH4+ Li+ K+ 1 0.906*** 0.684*** 0.651*** −0.037 0.648*** Na+ 1 0.755*** 0.793*** −0.043 0.614*** Ca2+ 1 0.862*** −0.028 0.401 Mg2+ 1 −0.019 0.383 NH4+ 1 −0.044 Li+ 1 城区 Urban area K+ Na+ Ca2+ Mg2+ NH4+ Li+ K+ 1 0.841*** 0.478*** 0.551*** −0.146 0.658*** Na+ 1 0.470*** 0.834*** −0.202 0.797*** Ca2+ 1 0.639*** −0.208 0.289* Mg2+ 1 −0.214 0.663*** NH4+ 1 −0.172 Li+ 1 注:***表示在 0.001 置信度下显著相关,**表示在 0.01 置信度下显著相关,* 表示在 0.05 置信度下显著相关.
Note:*** indicated a significant correlation between the 0.001 confidence level,** indicated a significant correlation between the 0.01 confidence level, * indicated a significant correlation between the 0.05confidence level. -
[1] 陈伟华, 张艳芳, 鲍峰伟, 等. 超声波提取-离子色谱法同时测定卷烟纸中的钾、钠、钙、镁 [J]. 中国测试, 2012, 38(6): 41-43. CHEN W H, ZHANG Y F, BAO F W, et al. Simultaneous determination of K+, Na+, Ca2+and Mg2+ contents in cigarette paper by ultrasonic extraction-ion chromatography [J]. China Measurement & Test, 2012, 38(6): 41-43(in Chinese).
[2] 殷丽, 张飞, 唐溢湉, 等. 大气降水中钾钠钙镁测定方法的比对 [J]. 环境监测管理与技术, 2013, 25(5): 60-62. doi: 10.3969/j.issn.1006-2009.2013.05.017 YIN L, ZHANG F, TANG Y T, et al. Method comparison of the determination of K+, Na+, Ca2+, Mg2+ in atmospheric precipitation [J]. The Administration and Technique of Environmental Monitoring, 2013, 25(5): 60-62(in Chinese). doi: 10.3969/j.issn.1006-2009.2013.05.017
[3] 国家环境保护总局. 水和废水监测分析方法[M]. 4版. 北京: 中国环境科学出版社, 2002. The State Environmental Protection Administration. Water and wastewater monitoring and analysis method[M]. Fourth Edition. Beijing: China Environment Science Press, 2002(in Chinese).
[4] 赵云. 离子色谱同时检测水中4种阳离子的快速测定方法研究 [J]. 水利技术监督, 2018, 26(6): 181-183. doi: 10.3969/j.issn.1008-1305.2018.06.055 ZHAO Y. Study on rapid method of simultaneous determination of 4 cations in water by ion chromatography [J]. Technical Supervision in Water Resources, 2018, 26(6): 181-183(in Chinese). doi: 10.3969/j.issn.1008-1305.2018.06.055
[5] 马丽萍, 杨磊. 离子色谱法同时测定黄河水中5种可溶性阳离子 [J]. 化学分析计量, 2021, 30(5): 22-27. doi: 10.3969/j.issn.1008-6145.2021.05.006 MA L P, YANG L. Simultaneous determination of five soluble cations in Yellow River water by ion chromatography [J]. Chemical Analysis and Meterage, 2021, 30(5): 22-27(in Chinese). doi: 10.3969/j.issn.1008-6145.2021.05.006
[6] 王晓梅. 离子色谱法测定降水中的五种阳离子 [J]. 中国资源综合利用, 2022, 40(6): 24-26. doi: 10.3969/j.issn.1008-9500.2022.06.007 WANG X M. Determination of five cations in precipitation by ion chromatography [J]. China Resources Comprehensive Utilization, 2022, 40(6): 24-26(in Chinese). doi: 10.3969/j.issn.1008-9500.2022.06.007
[7] 中华人民共和国水利部. 水环境监测规范: SL 219—2013[S]. 北京: 中国水利水电出版社, 2014. Ministry of Water Resources of the People's Republic of China. Regulation for water environmental monitoring: SL 219—2013[S]. Beijing: China Water Power Press, 2014(in Chinese).
[8] 朱世丹, 张飞, 张海威. 艾比湖流域河流水化学季节特征及空间格局研究 [J]. 环境科学学报, 2018, 38(3): 892-899. doi: 10.13671/j.hjkxxb.2017.0448 ZHU S D, ZHANG F, ZHANG H W. The seasonal and spatial variations of water chemistry of rivers in Ebinur Lake Basin [J]. Acta Scientiae Circumstantiae, 2018, 38(3): 892-899(in Chinese). doi: 10.13671/j.hjkxxb.2017.0448
[9] 赵胜男, 史小红, 崔英, 等. 内蒙古达里诺尔湖湖泊水体与入湖河水水化学特征及控制因素 [J]. 环境化学, 2016, 35(9): 1865-1875. doi: 10.7524/j.issn.0254-6108.2016.09.2016012001 ZHAO S N, SHI X H, CUI Y, et al. Hydrochemical properties and controlling factors of the Dali Lake and its inflow river water in Inner Mongolia [J]. Environmental Chemistry, 2016, 35(9): 1865-1875(in Chinese). doi: 10.7524/j.issn.0254-6108.2016.09.2016012001
[10] 冯泽波, 史正涛, 苏斌, 等. 滇池主要入湖河流水化学特征及其环境意义 [J]. 水生态学杂志, 2019, 40(3): 18-24. doi: 10.15928/j.1674-3075.2019.03.003 FENG Z B, SHI Z T, SU B, et al. Water chemistry in the primary tributaries of Dianchi Lake and effect on the water environment of Dianchi Lake [J]. Journal of Hydroecology, 2019, 40(3): 18-24(in Chinese). doi: 10.15928/j.1674-3075.2019.03.003
[11] 陈荣彦, 叶许春, 张世涛, 等. 人类活动影响盘龙江下游浅层地下水水质的变化 [J]. 水资源与水工程学报, 2007, 18(5): 47-51. doi: 10.3969/j.issn.1672-643X.2007.05.012 CHEN R Y, YE X C, ZHANG S T, et al. Change of the shallow groundwater quality by human activities influence in lower reaches of Panlongjiang River [J]. Journal of Water Resources and Water Engineering, 2007, 18(5): 47-51(in Chinese). doi: 10.3969/j.issn.1672-643X.2007.05.012
[12] 尹新雅, 陶发祥. 寻找人类活动影响南明河的水化学指纹: Ⅰ. 空间变化 [J]. 地球与环境, 2012, 40(4): 517-523. YIN XY, TAO F X. Searching for hydrochemical imprints indicating human impacts on the Nanming River: Ⅰ. Spatial variations [J]. Earth and Environment, 2012, 40(4): 517-523(in Chinese).
[13] 闻欣然, 王天阳, 李凤全, 等. 金华江城区段河流水化学变化及其控制因素 [J]. 地球与环境, 2018, 46(2): 146-155. doi: 10.14050/j.cnki.1672-9250.2018.46.019 WEN X R, WANG T Y, LI F Q, et al. Changes in river water chemistry of the urban section of Jinhua river and its' controlling factors [J]. Earth and Environment, 2018, 46(2): 146-155(in Chinese). doi: 10.14050/j.cnki.1672-9250.2018.46.019
[14] 陈洲, 王兮之, 李保生, 等. 粤北岩溶区星子河流域水化学离子特征及其时空变化分析 [J]. 地球与环境, 2014, 42(2): 145-156. doi: 10.14050/j.cnki.1672-9250.2014.02.010 CHEN Z, WANG X Z, LI B S, et al. Analysis of hydrochemical ion characteristics and their temporal and spatial variations in the Karst Basin of the Xingzi River, north Guangdong Province [J]. Earth and Environment, 2014, 42(2): 145-156(in Chinese). doi: 10.14050/j.cnki.1672-9250.2014.02.010
-


 下载:
下载:


