


-
在社会经济快速发展、能源需求不断加大以及随之带来的生态环境问题集中爆发等背景下,大气污染问题备受关注。大气中污染物的去除一般有污染物自生的转化和干湿沉降两种主要方式,其中大气降水是将大气颗粒物和气体污染物有效清除的重要湿沉降过程[1-2]。研究表明,大气降水是一种复杂的物理、化学反应过程[3],降水的pH、化学组成与大气污染及气象条件、地理位置、地形地貌等因素密切相关[4-6],对大气降水进行监测与分析,对于评估当地空气环境质量以及人为活动对大气的影响有着重要的指示作用[7]。
在我国长三角区域、珠三角区域及毗邻区域大气降水化学组分的研究一直是热点。这些区域特点是高速的城市化进程、人口密集、较多的人类活动、工业生产、机动车排放以及垃圾焚烧。从而这些城市降水酸化程度高、酸雨污染问题日益严重。蒋冰艳等[8]利用降水离子相对海洋和土壤的富集系数及酸性离子与中和离子线性关系研究深圳市降水化学组分特征。陈圆圆等[9]利用降水中离子相关性及聚类分析研究北京市大气降水离子特征。肖致美等[10]对天津市降水中化学组分的空间变化特征进行研究。孙启斌等[2]运用PMF模型分析来源和TrajStat软件模拟后向轨迹讨论南昌市大气降水特征。张清华等[11]利用大气降水重金属湿沉降通量讨论桂林市大气降水化学组成及来源分析。前人对大气降水的研究取得了一定的成果,对于了解大气降水的酸化原因以及各组分的变化规律和来源具有重要指示意义。
米东区隶属于新疆维吾尔自治区乌鲁木齐市,是新疆维吾尔自治区实施乌昌经济一体化的“试验田”和“启动区”,是确定规划的首府乌鲁木齐城市副中心、全疆最大的制造业基地核心区、全疆重要的化工工业城、全疆重要的出口加工基地、乌鲁木齐市绿色食品基地和重要的人居生态新区。通过文献调研可知,有关乌鲁木齐市降水中化学组分的报道较少且集中在2012年之前[12-13],而对于米东区降水研究鲜有相关报道。为了更好地了解该区域大气降水中污染物的来源、贡献及大气降水变化特征,本研究于2017—2019年连续3年对米东区降水进行了采样,主要分析了降水中各化学组分的变化规律、特征及来源,以期为乌鲁木齐市米东区的环境保护工作提供理论基础和决策参考。
-
米东区位于乌鲁木齐市东北郊,地理坐标为(43°44′—45°31′N,87°06′—88°80′E),该地区距乌鲁木齐市中心城区20 km,远离海洋,属温带大陆性气候,年日照时数2400—3000 h,年最高气温≥38 ℃,最低气温−20 ℃左右,年均降水量260 mm。
-
本次实验采样点位于米东区环保局(43º96´89″N,87º62´01″E)和米东区铁厂沟学校(43º95´95″N,87º74´66″E)楼顶,距离地面约15 m。采样点周围空旷、周边无高大建筑群及明显污染源,样品采集及分析严格按照《大气降水样品的采集与保存》(GB13580.2—1992)、《酸沉降监测技术规范》(HJ/T 165—2004)进行。每次采样前后用自来水和去离子水清洗采样桶。为减少干沉降的影响,每次降水开始前将采样桶放置在采样点位,降水结束2 h内将样品从采样装置取出。逢雨(雪)必采,每次采集降水的全过程样品,当降水超过24 h时,将上午9:00至次日9:00的降水视为1个降水样品;若1 d有几次降雨(雪),则合并为1个样品。严防样品受到污染,并及时记录气象参数。样品取回实验室后,取适量样品采用便携式多参数水质分析仪(德国WTW,Multi 3630IDS)分别测定电导率(GB/T 13580.3—92)及pH值(GB/T 13580.4—92),余下样品经0.45 μm滤膜过滤,将过滤后的样品转移至洗净的聚乙烯塑料瓶中,置于3—5 ℃冰箱中保存,用于化学组分分析。
-
采用原子吸收分光光谱仪(德国耶拿,Zeenit 700P)测定阳离子中的K+、Na+、Ca2+及Mg2+浓度(GB/T 13580.12—92、GB/T 13580.13—92),采用离子色谱仪(美国戴安,ICS 1600)测定阴离子中的F−、Cl−、
${\rm{NO}}_{\rm{3}}^{\rm{ - }}$ 及${\rm{SO}}_{\rm{4}}^{{\rm{2 - }}}$ 浓度(GB/T 13580.5—92),采用纳氏试剂光度法测定大气降水中的${\rm{NH}}_4^{+} $ (GB/T 13580.11—92)。另外,使用生态环境部标准样品研究所提供的标准物质进行质量控制,每批次样品分析前至少测定2个实验室空白,空白含量低于分析项目方法检出限。每批次抽取10%进行实验室平行分析,平行样的标准偏差均小于10%,曲线线性相关系数大于0.999。另取曲线中间浓度点作为质量控制样品,每隔10个样品测定1次,核查仪器运行的稳定性,并确保测试结果的准确性。样品测试在乌鲁木齐市环境监测中心站分析实验室进行,分析过程所使用的玻璃器皿等器材均在提前配制的1:3硝酸溶液中浸泡24 h以上,并用蒸馏水和纯水洗净后烘干备用。分析过程中所使用的化学试剂均为分析纯,实验用水为超纯水。降水中主要离子浓度Pearson相关性分析通过Origin 8.0计算并绘图。 -
参照美国环境保护署(US EPA)的规定[14],确定所采集大气降水中总阴离子、总阳离子浓度差的接受范围:总离子浓度在50—100 µeq·L−1时为30%—60%,总离子浓度>100 µeq·L−1时为15%—30%。按照标准对所采集的有效水样进行检查,对3年内所有有效降水样进行总阴离子浓度、总阳离子浓度回归曲线分析,根据回归方程以及相关系数判断所测定的降水组成的可靠性。本研究所有水样的总阴离子浓度和总阳离子浓度回归方程和相关系数结果如图1所示,3年间,阴、阳离子浓度均呈现良好的线性关系(R2最高值0.979,最低值0.846),表明乌鲁木齐市米东区2017—2019年阴、阳离子数据高度相关。从2017年1月至2019年12月乌鲁木齐市米东区两个降水采集点米东区环保局和米东区铁厂沟学校都监测到降水53场。依据样品剔除标准,两个降水采集点的有效样品分别为49个和47个。
-
由表1可知,采样期间大气降水的雨量加权平均pH值为7.56—8.40,年均值为7.95,pH值呈现先降低后增大趋势。按照大气降水化学特性的酸碱分类法[15]:pH≥5.6的降水不会对生态环境造成危害,称为碱性降水。本研究中,水样pH值均大于5.6,因此,不会对生态环境造成危害。相较乌鲁木齐市其他年份(1997—2009年)大气降水pH的监测结果[12-13],本研究测得的降水pH有明显上升趋势,碱性降水频率增加,大气降水酸化问题明显改善。与其他城市相比,该研究区pH均值均比其他城市高,如深圳(pH均值为5.01)[8]、北京(pH均值为6.79)[9] 、天津(pH均值为5.58)[10]和上海(pH均值为4.81)[16]。
电导率和pH是大气降水化学特征的综合反映[17],电导率值较高表明大气降水中各离子的浓度相对较高。本研究中,降水雨量加权电导率的变化范围为14.70—17.04 mS·m−1之间,年均值为16.15 mS·m−1,高于我国降水背景站点瓦里关山降水的平均电导率(1.48 mS·m−1)。由表1可知,电导率与总离子浓度变化趋势一致,呈现逐年增加的趋势。与此前研究报告相比[9],降水电导率大幅度降低,说明乌鲁木齐市大气污染呈逐年改善的变化趋势。这与当地政府不断调整产业结构、产业布局,从2012年开始实施“煤改气”工程、2014年开始限制“黄标车”等重大环境保护工作息息相关。
-
对2017—2019年乌鲁木齐市米东区降水的离子组成进行分析,得到主要离子的雨量加权平均浓度。由表2可知,乌鲁木齐市米东区近3年雨量加权平均总离子浓度为72.75—95.89 µeq·L−1,年均浓度为81.93 µeq·L−1。从总离子雨量加权平均浓度看,乌鲁木齐市米东区近3年的大气降水属于清洁降水(浓度≤100 µeq·L−1)。与我国其他城市相比(表3),如深圳(144.08 µeq·L−1)[8]、北京(1078 µeq·L−1)[9]、天津(1363 µeq·L−1)[10]和上海(455.65 µeq·L−1)[16]等, 乌鲁木齐市米东区总离子浓度低于全国大部分地区。
乌鲁木齐市米东区大气降水中阴离子浓度排序为
${\rm{SO}}_{\rm{4}}^{{\rm{2 - }}}$ >Cl−>${\rm{NO}}_{\rm{3}}^{\rm{ - }}$ >F−,${\rm{SO}}_{\rm{4}}^{{\rm{2 - }}}$ 和Cl−是最主要的阴离子,其雨量加权平均值分别为29.01、9.46 µeq·L−1,分别占阴离子总量的66.83%和21.79%。阳离子浓度排序为Ca2+>Na+>${\rm{NH}}_{\rm{4}}^{\rm{ + }}$ >K+>Mg2+,Ca2+是主要的阳离子,Na+是次要阳离子,两者的雨量加权平均值分别为21.91、9.47 µeq·L−1,分别占阳离子总量的56.87%和24.59%。乌鲁木齐市米东区大气降水中主要离子浓度排序为${\rm{SO}}_{\rm{4}}^{{\rm{2 - }}}$ >Ca2+>Cl−>Na+>${\rm{NO}}_{\rm{3}}^{\rm{ - }}$ >${\rm{NH}}_{\rm{4}}^{\rm{ + }}$ >K+>Mg2+>F−,主要离子${\rm{SO}}_{\rm{4}}^{{\rm{2 - }}}$ 、Ca2+对总离子浓度的贡献分别为35.41%、26.74%。表3将采样期间乌鲁木齐市米东区降水各离子浓度与我国其他城市相比较发现,研究区降水离子浓度顺序、主要组成与其他城市略有差异。${\rm{SO}}_{\rm{4}}^{{\rm{2 - }}}$ 、Ca2+、${\rm{NO}}_{\rm{3}}^{\rm{ - }}$ 和${\rm{NH}}_{\rm{4}}^{\rm{ + }}$ 是其他城市降水中的主要离子,Ca2+、${\rm{NH}}_{\rm{4}}^{\rm{ + }}$ 是降水中含量较高的阳离子组分,${\rm{SO}}_{\rm{4}}^{{\rm{2 - }}}$ 和${\rm{NO}}_{\rm{3}}^{\rm{ - }}$ 是含量较高的阴离子组分。Ca2+可能主要来自陆地尘埃及建筑施工等开放源,${\rm{SO}}_{\rm{4}}^{{\rm{2 - }}}$ 主要来自工业高硫煤的燃烧,二者浓度远低于北京[9]、天津[10]、上海[16]等发达城市,这可能与城市化进程、土壤扬尘在大气颗粒物中所占比例较低、乌鲁木齐“煤改气”工程的持续实施以及大量燃煤烟气脱硫设施的运行有密切关系。${\rm{NH}}_{\rm{4}}^{\rm{ + }}$ 可能主要来自化石燃料燃烧以及工厂排放有关,${\rm{NO}}_{\rm{3}}^{\rm{ - }}$ 可能主要来自人为活动如工业废气排放、机动车燃料排放等,二者浓度也远远低于深圳[8]、北京[9]、天津[10]、上海[16]等发达地区,可能这些发达地区高速的城市化进程、密集的人口造成大量交通工具所排放的氮氧化物有关。总的来说,结合大气降水pH,以上城市酸雨污染问题较乌鲁木齐市严重。 -
将3月至5月划定为春季,6月至8月划定为夏季,9月至11月划定为秋季,12月至翌年2月划定为冬季,对不同季节大气降水中离子浓度进行统计,结果如图2和表4所示。从季节分布上看,2017—2019年3年乌鲁木齐市米东区总离子浓度顺序为冬季>夏季>秋季>春季,而降水量大小顺序为秋季>春季>冬季>夏季。冬季降水中离子浓度过高可能是局部污染物增加所致,比如冬季采暖期大量燃煤、冬季机动车使用频次增加以及化工企业排放污染物。另外,冬季降水量相对较少、大气层稳定等气象条件影响了空气中各种污染物的扩散、稀释、导致空气污染较严重。春季降雨量迅速增多,虽淋洗下大量污染物,但降水的稀释作用更加明显,此季节降水中离子浓度最低。
由图3降水中主要离子的季节变化可知,
${\rm{SO}}_{\rm{4}}^{{\rm{2 - }}}$ 离子浓度在冬季最高,春季最低,Ca2+、Cl−、${\rm{NO}}_{\rm{3}}^{\rm{ - }}$ 变化趋势也一致,均在冬季出现了较高水平,春季最低。K+、Mg2+浓度是秋季最高,春季最低,且变化趋势一致,表明它们可能有着共同的来源。 -
[
${\rm{SO}}_{\rm{4}}^{{\rm{2 - }}}$ ]/[${\rm{NO}}_{\rm{3}}^{\rm{ - }}$ ]被用来划分酸雨类型和降水酸化程度:[${\rm{SO}}_{\rm{4}}^{{\rm{2 - }}}$ ]/[${\rm{NO}}_{\rm{3}}^{\rm{ - }}$ ]>3.0,表示降水为硫酸型或燃煤型;0.5<[${\rm{SO}}_{\rm{4}}^{{\rm{2 - }}}$ ]/[${\rm{NO}}_{\rm{3}}^{\rm{ - }}$ ]≤3.0,表示降水为混合型;[${\rm{SO}}_{\rm{4}}^{{\rm{2 - }}}$ ]/[${\rm{NO}}_{\rm{3}}^{\rm{ - }}$ ]≤0.5,表示降水为硝酸型或燃油型[15]。由表5可知,本研究中,[${\rm{SO}}_{\rm{4}}^{{\rm{2 - }}}$ ]/[${\rm{NO}}_{\rm{3}}^{\rm{ - }}$ ]的比值范围介于4.62—11.99之间,年均浓度比值为7.51,且该比值具有逐年减少的变化趋势,即${\rm{SO}}_{\rm{4}}^{{\rm{2 - }}}$ 对降水酸化的贡献率逐渐下降,而${\rm{NO}}_{\rm{3}}^{\rm{ - }}$ 对降水酸化的贡献率逐年上升,降雨的酸化类型仍然为硫酸型,但具有逐步向硝酸型转变的趋势。将其与我国其他城市相比较,结果见表6。由表6可知,我国其他城市降雨的酸化类型为混合型,其他城市[${\rm{SO}}_{\rm{4}}^{{\rm{2 - }}}$ ]/[${\rm{NO}}_{\rm{3}}^{\rm{ - }}$ ]值与乌鲁木齐市不相近,说明乌鲁木齐市与其他城市可能具有不同的能源结构。本研究[${\rm{SO}}_{\rm{4}}^{{\rm{2 - }}}$ ]/[${\rm{NO}}_{\rm{3}}^{\rm{ - }}$ ]值总体呈现变小的规律,其原因可能是因为随着社会经济的发展,生态文明观念宣传力度加大,人们对环境保护的要求越来越高,各项环境污染治理力度加强,与此同时,“煤改气”工程的持续实施以及大量燃煤烟气脱硫设施的运行,有效降低了乌鲁木齐市的SO2排放量。也可能是由于近年来乌鲁木齐市机动车保有量快速增长导致NOx排放量增加。总之,一方面SO2的排放量在降低;另一方面,NOx的排放量并没有降低甚至在升高。两方面因素的综合作用,致使降水中的[${\rm{SO}}_{\rm{4}}^{{\rm{2 - }}}$ ]/[${\rm{NO}}_{\rm{3}}^{\rm{ - }}$ ]值逐年降低。碱性离子对降水酸度的中和作用可以通过酸中和因子(NF)来进行计算,NF值越大,表明该离子对降水中阴离子的中和作用越大。计算方法如公式(1)所示:
式中,NF(X)为中和因子,[X]为碱性离子的浓度。计算结果见表5。
由表5可知,主要致碱阳离子中,Ca2+与主要阴离子(
${\rm{SO}}_{\rm{4}}^{{\rm{2 - }}}$ +${\rm{NO}}_{\rm{3}}^{\rm{ - }}$ )的浓度比值最高且连续3年呈现稳中有升趋势,说明大气中的酸性物质主要由阳离子Ca2+进行中和,且Ca2+在大气组分中的比例居高不下。Ca2+主要来自土壤、道路扬尘及建筑施工。近年来,米东区城市化进程加速,建筑施工活动剧增,使得城市开放源(扬尘、土壤风沙尘和建筑尘)的环境颗粒物保持在较高的浓度,通过云下冲刷进入大气中,从而使大气中的Ca2+浓度较高。另外,降水中([${\rm{SO}}_{\rm{4}}^{{\rm{2 - }}}$ ]+[${\rm{NO}}_{\rm{3}}^{\rm{ - }}$ ])/([Ca2+]/[${\rm{NH}}_{\rm{4}}^{\rm{ + }}$ ])整体呈现降低趋势,说明存在逐年增多的碱性物质中和降水中的酸性物质,该值连续3年均高于1,说明酸性组分多余碱性组分,表明降水中没有足够多的碱性成分中和酸性物质。该结果与表2中酸性离子贡献结论一致。 -
降水中各离子的相关性较好时,表明相关离子可能具有相同来源或者具有相互的潜在关系[18]。为了弄清乌鲁木齐市米东区降水中各离子之间的内在关联性和来源,对大气降水主要离子进行相关性分析。由表7可知,5种阳离子中,
${\rm{SO}}_{\rm{4}}^{{\rm{2 - }}}$ 与Ca2+的相关性最高(r=0.93),其次是与Na+(r=0.65),表明${\rm{SO}}_{\rm{4}}^{{\rm{2 - }}}$ 多以CaSO4的形式存在,辅助以Na2SO4的形式存在;${\rm{NO}}_{\rm{3}}^{\rm{ - }}$ 与Ca2+相关性也较高(r=0.82),表明${\rm{NO}}_{\rm{3}}^{\rm{ - }}$ 主要以Ca(NO3)2的形式存在。${\rm{SO}}_{\rm{4}}^{{\rm{2 - }}}$ 与${\rm{NO}}_{\rm{3}}^{\rm{ - }}$ 存在显著性相关(r=0.88),表明二者的前体化合物SO2和NOx在降水中具有相似的释放来源,如汽车尾气、工业废气及生物质燃烧等人为来源或者相似的化学过程[8]。另外,${\rm{SO}}_{\rm{4}}^{{\rm{2 - }}}$ 与Ca2+(r=0.93)、${\rm{NO}}_{\rm{3}}^{\rm{ - }}$ 与Ca2+(r=0.82)的线性相关系数明显大于${\rm{SO}}_{\rm{4}}^{{\rm{2 - }}}$ 与${\rm{NH}}_{\rm{4}}^{\rm{ + }}$ (r=0.17)、${\rm{NO}}_{\rm{3}}^{\rm{ - }}$ 与${\rm{NH}}_{\rm{4}}^{\rm{ + }}$ (r=0.26),说明乌鲁木齐市大气降水中的碱性阳离子Ca2+对致酸阴离子${\rm{SO}}_{\rm{4}}^{{\rm{2 - }}} $ 、${\rm{NO}}_{\rm{3}}^{\rm{ - }}$ 的中和作用可能大于${\rm{NH}}_{\rm{4}}^{\rm{ + }} $ ,相关离子在大气降水中可能主要以CaSO4和Ca(NO3)2两种化合物的形式存在。这与研究期间所采集的大气降水样品[Ca2+]/[${\rm{NH}}_{\rm{4}}^{\rm{ + }}$ ]值逐年增加且平均值达7.83相符。影响乌鲁木齐市米东区降水酸度的主要酸性离子
${\rm{SO}}_{\rm{4}}^{{\rm{2 - }}}$ 、${\rm{NO}}_{\rm{3}}^{\rm{ - }}$ 及中和离子Ca2+、${\rm{NH}}_{\rm{4}}^{\rm{ + }}$ 的线性关系见图4。由图4可知,Ca2+与${\rm{SO}}_{\rm{4}}^{{\rm{2 - }}}$ 、${\rm{NO}}_{\rm{3}}^{\rm{ - }}$ 的线性相关系数分别为0.855及0.676,表明降水中主要致酸、致碱离子的组合方式主要为CaSO4及Ca(NO3)2两种化合物。Ca2+受地壳来源如建筑扬尘、土壤尘影响较大,城市化进程也是大气中颗粒物的主要来源,这些人为活动是大气中Ca2+的潜在来源。此结论与表7分析结论吻合。 -
(1)2017—2019年,乌鲁木齐市米东区大气降水的雨量加权pH年均值为7.95,雨量加权平均电导率年均值为16.15 mS·m−1,雨量加权平均总离子浓度为81.93 µeq·L−1,大气降水污染程度为清洁。降水中各离子的雨量加权平均浓度顺序为:
${\rm{SO}}_{\rm{4}}^{{\rm{2 - }}}$ >Ca2+>Cl−>Na+>${\rm{NO}}_{\rm{3}}^{\rm{ - }}$ >${\rm{NH}}_{\rm{4}}^{\rm{ + }}$ >K+>Mg2+>F−,浓度最高的阴、阳离子分别为${\rm{SO}}_{\rm{4}}^{{\rm{2 - }}}$ (29.01 µeq·L−1)、Ca2+(21.91 µeq·L−1)二者对总离子浓度的贡献分别为35.41%、26.74%。(2)总离子平均浓度按季节排序为冬季>夏季>秋季>春季,降水量大小顺序为秋季>春季>冬季>夏季。
${\rm{SO}}_{\rm{4}}^{{\rm{2 - }}}$ 、Ca2+、Cl−、${\rm{NO}}_{\rm{3}}^{\rm{ - }}$ 浓度在冬季最高,春季最低。[${\rm{SO}}_{\rm{4}}^{{\rm{2 - }}}$ ]/[${\rm{NO}}_{\rm{3}}^{\rm{ - }}$ ]平均值为7.51,降雨的酸化类型为硫酸型,但具有逐步向硝酸型转变的趋势。中和降水中酸性组分的主要碱性离子为连续3年占比最高且稳中有升的Ca2+。(3)相关性分析表明,Ca2+、Mg2+、Na+、Cl−、
${\rm{SO}}_{\rm{4}}^{{\rm{2 - }}}$ 、${\rm{NO}}_{\rm{3}}^{\rm{ - }}$ 之间存在着较为显著的相关性,说明它们之间有相似的来源,并形成化合物共同存在。Ca2+在大气中优先与${\rm{SO}}_{\rm{4}}^{{\rm{2 - }}}$ 、${\rm{NO}}_{\rm{3}}^{\rm{ - }}$ 结合且Ca2+的降水酸性中和贡献率明显大于${\rm{NH}}_{\rm{4}}^{\rm{ + }}$ ,表明乌鲁木齐市米东区大气降水中可能存在以CaSO4和Ca(NO3)2为主的化学物质。
乌鲁木齐市米东区大气降水的化学特征及来源分析
Chemical characteristics and source apportionment of atmospheric precipitation in Urumqi City
-
摘要: 为研究乌鲁木齐市米东区大气降水中的化学组分特征及来源,对2017—2019年降水中主要离子浓度及来源进行了分析。研究结果显示,米东区2017—2019年降水的雨量加权pH年均值为7.95,雨量加权平均电导率年均值为16.15 mS·m−1,雨量加权平均总离子浓度为72.75—95.89 µeq·L−1,年均浓度为81.93 µeq·L−1。降水中各离子的雨量加权平均浓度顺序为
${\rm{SO}}_{\rm{4}}^{{\rm{2 - }}}$ >Ca2+>Cl−>Na+>${\rm{NO}}_{\rm{3}}^{\rm{ - }}$ >${\rm{NH}}_{\rm{4}}^{\rm{ + }}$ >K+>Mg2+>F−,浓度最高的阴、阳离子分别为${\rm{SO}}_{\rm{4}}^{{\rm{2 - }}}$ (29.01 µeq·L−1)、Ca2+(21.91 µeq·L−1),二者对总离子浓度的贡献分别为35.41%、26.74%。总离子浓度按季节排序为冬季>夏季>秋季>春季。[${\rm{SO}}_{\rm{4}}^{{\rm{2 - }}}{\rm{/NO}}_{\rm{3}}^{\rm{ - }}$ ]平均值为7.51,${\rm{SO}}_{\rm{4}}^{{\rm{2 - }}} $ 对雨水酸度的贡献率逐渐减弱,${\rm{NO}}_{\rm{3}}^{\rm{ - }}$ 的贡献率逐年增加,降雨的酸化类型为硫酸型,但具有逐步向硝酸型转变的趋势。中和降水中酸性组分的主要碱性离子为连续3年占比最高且稳中有升的Ca2+离子。Ca2+、Mg2+、Na+、Cl−、${\rm{SO}}_{\rm{4}}^{{\rm{2 - }}}$ 、${\rm{NO}}_{\rm{3}}^{\rm{ - }}$ 之间存在着较为显著的相关性,说明上述离子有相似的来源并形成化合物共同存在。Ca2+在大气中优先与${\rm{SO}}_{\rm{4}}^{{\rm{2 - }}}$ 、${\rm{NO}}_{\rm{3}}^{\rm{ - }}$ 结合,且Ca2+对雨水酸性的中和贡献率大于${\rm{NH}}_{\rm{4}}^{\rm{ + }}$ ,表明乌鲁木齐市米东区大气降水中可能存在以CaSO4和Ca(NO3)2为主的化学物质。Abstract: To investigate the characteristics and sources of chemical compositions of precipitation in the Midong district of Urumqi, the concentration and sources of major ions in the precipitation collected during the period from 2017 to 2019 were analyzed. The results showed that the annual weighted mean pH of precipitation was 7.95, and the annual weighted mean conductivity of precipitation was 16.15 mS·m−1. The variation range of total ion concentrations in precipitation was 72.75—95.89 µeq·L−1, with the annual weighted average concentrations of 81.93 µeq·L−1. The weighted mean concentration of precipitation components followed the order${\rm{SO}}_{\rm{4}}^{{\rm{2 - }}}$ >Ca2+>Cl−>Na+>${\rm{NO}}_{\rm{3}}^{\rm{ - }}$ >${\rm{NH}}_{\rm{4}}^{\rm{ + }}$ >K+>Mg2+>F−, the highest contents of anion and cation was${\rm{SO}}_{\rm{4}}^{{\rm{2 - }}}$ (29.01 µeq·L−1)and Ca2+(21.91 µeq·L−1), the contribution of total ion concentration was 35.41% and 26.74%, respectively. The order of concentration of total ions was winter>summer>autumn>spring. The mean ratio of the${\rm{SO}}_{\rm{4}}^{{\rm{2 - }}}{\rm{/NO}}_{\rm{3}}^{\rm{ - }}$ was 7.51, and the ratio of${\rm{NO}}_{\rm{3}}^{\rm{ - }}$ had increased year by year, which indicated that precipitation of Urumqi City belonged to sulfuric acid, and might gradually evolve from a sulfuric acid to nitric acid type. The significant correlation among Ca2+、Mg2+、Na+、Cl−、${\rm{SO}}_{\rm{4}}^{{\rm{2 - }}}$ and${\rm{NO}}_{\rm{3}}^{\rm{ - }}$ indicated their similar sources or the formation of compounds with them. Ca2+ was preferentially combined with${\rm{SO}}_{\rm{4}}^{{\rm{2 - }}}$ 、${\rm{NO}}_{\rm{3}}^{\rm{ - }}$ in the atmosphere, and the contribution of Ca2+ to the acid neutralization of rainwater was greater than${\rm{NH}}_{\rm{4}}^{\rm{ + }}$ , indicated that the chemical compositions of precipitation were mainly existed in the form of CaSO4 and Ca(NO3)2.-
Key words:
- Urumqi /
- atmospheric precipitation /
- chemical composition /
- source appointment
-

-

图 1 乌鲁木齐市米东区3年降水中总阴离子、总阳离子浓度相关系数
Figure 1. Relationships between total cations and anions over the past three years in Midong district of Urumqi
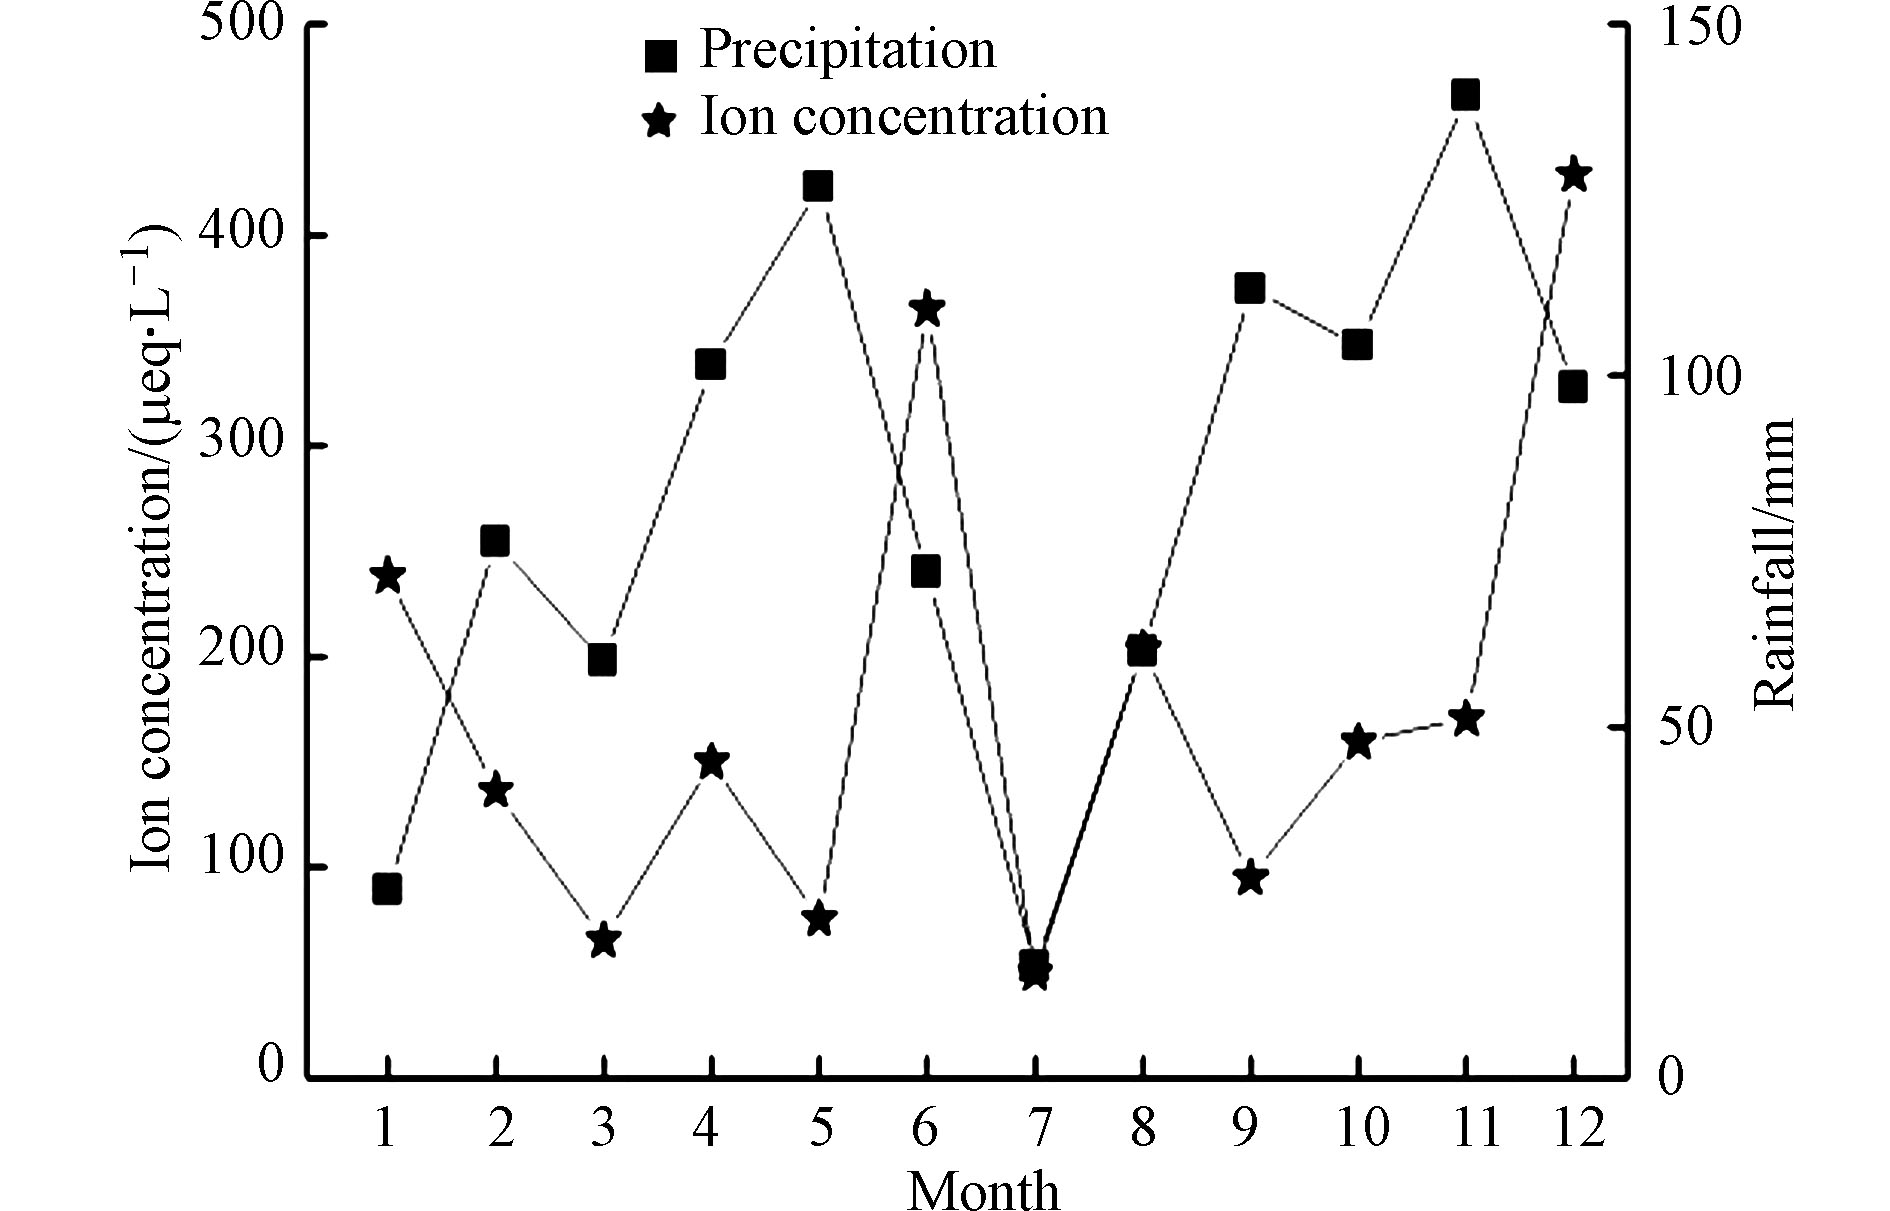
图 2 降水总离子浓度月份变化
Figure 2. Month variation of concentration of total ions in precipitation
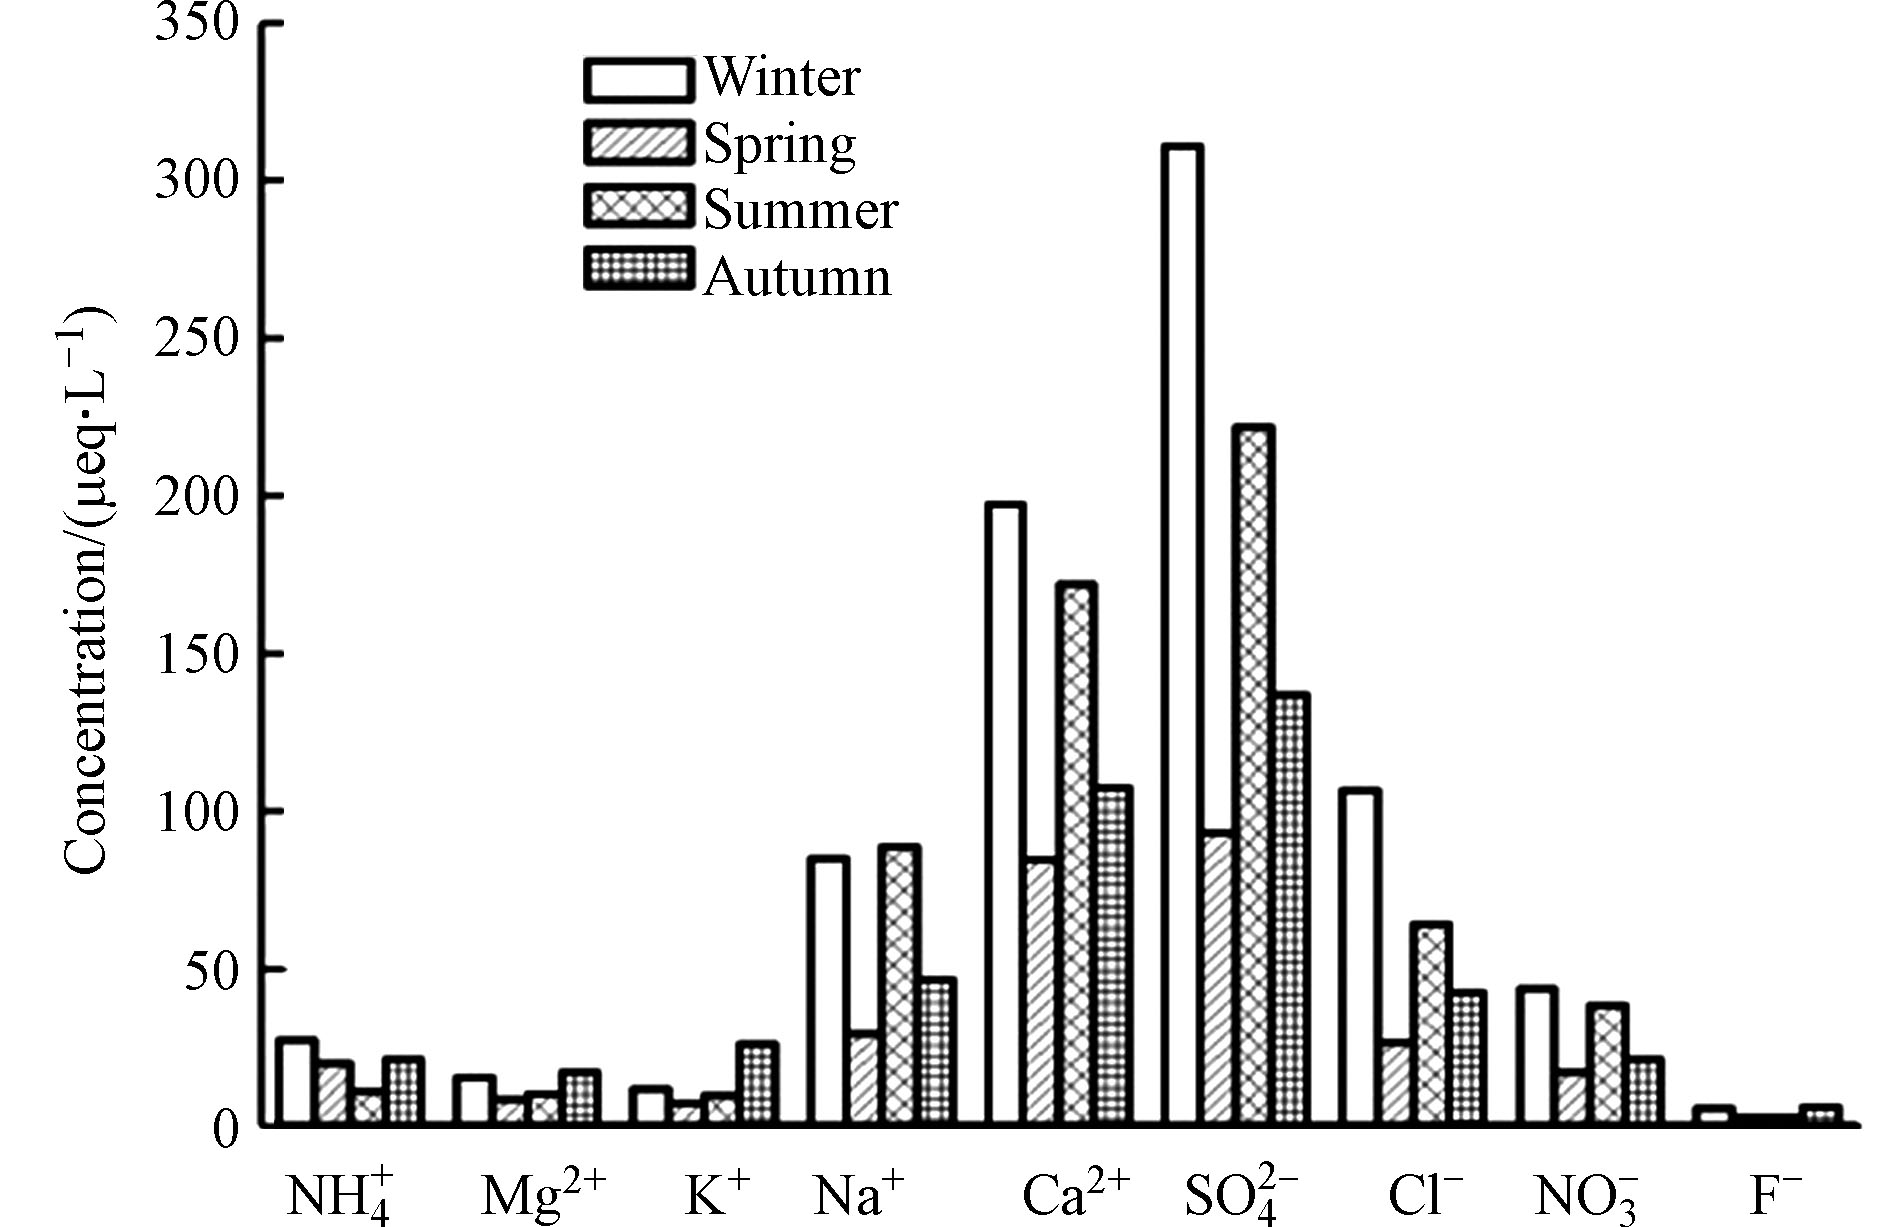
图 3 乌鲁木齐市米东区3年降水中主要离子浓度的季节变化
Figure 3. Seasonal variation of major ion concentration in precipitation over the past 3 years in Midong district of Urumqi

图 4 乌鲁木齐市米东区3年降水中主要阳离子Ca2+,
${\rm{NH}}_{\rm{4}}^{\rm{ + }}$ 及阴离子${\rm{SO}}_{\rm{4}}^{{\rm{2 - }}}$ 、${\rm{NO}}_{\rm{3}}^{\rm{ - }}$ 相关性Figure 4. Correlations between Ca2+,
${\rm{NH}}_{\rm{4}}^{\rm{ + }}$ and${\rm{SO}}_{\rm{4}}^{{\rm{2 - }}}$ −,${\rm{NO}}_{\rm{3}}^{\rm{ - }}$ in precipitation in Midong district of Urumqi from 2017 to 2019表 1 乌鲁木齐米东区3年大气降水雨量加权总离子浓度、pH、EC、降水量变化
Table 1. The annual weighted mean total ion concentrations, pH,EC and amount of precipitation over the past three years in Midong district of Urumqi
年份
Year降水量/mm
RainfallpH 电导率/ (mS·m−1)
Conductivity雨量加权平均总离子浓度/(µeq·L−1)
Rainfall volume weighted mean values for total ions2017 338.20 8.40 14.70 77.53 2018 293.57 7.56 16.71 80.02 2019 356.11 7.88 17.04 88.24 年均值 329.29 7.95 16.15 81.93  下载: 导出CSV
表 2 乌鲁木齐市米东区降水中主要离子的雨量加权平均浓度(µeq·L−1)
Table 2. The weighted mean concentrations of major ions in precipitation in Midong district of Urumqi(µeq·L−1)
年份 Year ${\rm{SO}}_{\rm{4}}^{{\rm{2 - }}}$ ${\rm{NO}}_{\rm{3}}^{\rm{ - }}$ F− Cl− ${\rm{NH}}_{\rm{4}}^{\rm{ + }}$ Ca2+ Mg2+ Na+ K+ 2017 34.40 2.87 0.62 6.37 3.78 21.14 1.57 5.67 1.11 2018 26.92 4.53 0.56 14.05 2.51 17.07 1.65 9.97 2.76 2019 25.71 5.57 0.66 7.96 2.48 27.52 2.54 12.78 3.02 年均值 29.01 4.32 0.61 9.46 2.92 21.91 1.92 9.47 2.30
下载: 导出CSV
表 3 乌鲁木齐市米东区降水主要离子与我国其他地区的比较
Table 3. Comparison of main ions of precipitation in Midong district of Urumqi with other cities in China
地区
Area研究时段
Research time雨量加权平均总离子浓度/ (µeq·L−1)
Rainfall volume weighted mean values for total ions${\rm{SO}}_{\rm{4}}^{{\rm{2 - }}}$ ${\rm{NO}}_{\rm{3}}^{\rm{ - }}$ F− Cl− ${\rm{NH}}_{\rm{4}}^{\rm{ + }}$ Ca2+ Mg2+ Na+ K+ 乌鲁木齐 2017—2019 29.01 4.32 0.61 9.46 2.92 21.91 1.92 9.47 2.30 深圳[8] 2010—2017 27.82 21.16 1.15 19.01 26.63 16.16 4.73 15.49 2.40 天津[10] 2013 380 185 19 79 198 403 51 34 14 北京[9] 1997—2010 319 114 15.2 47.2 221 255 56.4 28.5 21.7 上海[16] 2014—2015 92.7 46.14 20.4 66.7 54.3 113 21.9 29.7 10.81
下载: 导出CSV
表 4 乌鲁木齐米东区3年各季节降水离子浓度与降水量统计分析
Table 4. Statistical analysis of ion concentration and amount of precipitation in each season over the past 3 years in midong district of Urumqi
季节
Season降水总量/mm
Rainfall平均降水量/mm
Mean rainfall离子浓度/ (µeq·L−1)
Concentration冬季 201.40 67.13 803.69 春季 287.80 95.93 290.59 夏季 132.71 44.24 618.38 秋季 356.57 118.86 424.81
下载: 导出CSV
表 5 乌鲁木齐市米东区降水中阴阳离子雨量加权平均浓度比值的年际变化情况
Table 5. Annual variation of the mean ratio of cations and anions concentrations in precipitation in Midong district of Urumqi from 2017 to 2019
2017年 2018年 2019年 ${\rm{SO}}_{\rm{4}}^{{\rm{2 - }}}{\rm{/NO}}_{\rm{3}}^{\rm{ - }}$ 11.99 5.94 4.62 Ca2+/ ${\rm{NH}}_{\rm{4}}^{\rm{ + }}$ 5.59 6.80 11.10 ( ${\rm{SO}}_{\rm{4}}^{{\rm{2 - }}}$ ${\rm{NO}}_{\rm{3}}^{\rm{ - }}$ ${\rm{NH}}_{\rm{4}}^{\rm{ + }}$ 1.50 1.61 1.04 Ca2+/( ${\rm{SO}}_{\rm{4}}^{{\rm{2 - }}}$ ${\rm{NO}}_{\rm{3}}^{\rm{ - }}$ 0.57 0.54 0.88 ${\rm{NH}}_{\rm{4}}^{\rm{ + }}$ ${\rm{SO}}_{\rm{4}}^{{\rm{2 - }}}$ ${\rm{NO}}_{\rm{3}}^{\rm{ - }}$ 0.10 0.08 0.08 Mg2+/( ${\rm{SO}}_{\rm{4}}^{{\rm{2 - }}}$ ${\rm{NO}}_{\rm{3}}^{\rm{ - }}$ 0.04 0.05 0.08
下载: 导出CSV
表 6 我国部分城市大气降水中
${\rm{SO}}_{\rm{4}}^{{\rm{2 - }}}{\rm{/NO}}_{\rm{3}}^{\rm{ - }}$ Table 6. Comparisons of
${\rm{SO}}_{\rm{4}}^{{\rm{2 - }}}{\rm{/NO}}_{\rm{3}}^{\rm{ - }} $
下载: 导出CSV
表 7 乌鲁木齐市米东区3年大气降水中各离子相关性分析
Table 7. Correlation analysis of major ions in precipitation in Midong district of Urumqi from 2017 to 2019
${\rm{SO}}_{\rm{4}}^{{\rm{2 - }}}$ ${\rm{NO}}_{\rm{3}}^{\rm{ - }}$ F− Cl− ${\rm{NH}}_{\rm{4}}^{\rm{ + }}$ Ca2+ Mg2+ Na+ K+ ${\rm{SO}}_{\rm{4}}^{{\rm{2 - }}}$ 1 0.88 0.29 0.77 0.17 0.93 0.43 0.65 0.47 ${\rm{NO}}_{\rm{3}}^{\rm{ - }}$ 1 0.24 0.54 0.26 0.82 0.30 0.55 0.40 F− 1 0.32 0.27 0.35 0.65 0.19 0.51 Cl− 1 0.01 0.74 0.56 0.73 0.44 ${\rm{NH}}_{\rm{4}}^{\rm{ + }}$ 1 0.15 0.16 0.07 0.07 Ca2+ 1 0.56 0.89 0.50 Mg2+ 1 0.40 0.68 Na+ 1 0.48 K+ 1
下载: 导出CSV
-
[1] 王璟. 大气降水中离子化学特征及来源分析 [J]. 环境科学与管理, 2012, 37(3): 73-79. doi: 10.3969/j.issn.1673-1212.2012.03.018 WANG J. Chemical characteristics of ions in atmospheric precipitation and their source analysis [J]. Environmental Science and Management, 2012, 37(3): 73-79(in Chinese). doi: 10.3969/j.issn.1673-1212.2012.03.018
[2] 孙启斌, 肖红伟, 肖化云, 等. 南昌市大气降水化学特征及来源分析 [J]. 环境科学研究, 2017, 30(12): 1841-1848. SUN Q B, XIAO H W, XIAO H Y, et al. Chemical characteristics and source apportionment of atmospheric precipitation in Nanchang City [J]. Research of Environmental Sciences, 2017, 30(12): 1841-1848(in Chinese).
[3] 张苗云, 王世杰, 张迎, 等. 金华市大气降水的化学组成特征及来源解析 [J]. 中国环境监测, 2007, 23(6): 86-92. doi: 10.3969/j.issn.1002-6002.2007.06.025 ZHANG M Y, WANG S J, ZHANG Y, et al. Analysis on the origin and characteristics of chemical composition of precipitation in Jinhua [J]. Environmental Monitoring in China, 2007, 23(6): 86-92(in Chinese). doi: 10.3969/j.issn.1002-6002.2007.06.025
[4] 肖红伟, 龙爱民, 谢露华, 等. 中国南海大气降水化学特征 [J]. 环境科学, 2014, 35(2): 475-480. XIAO H W, LONG A M, XIE L H, et al. Chemical characteristics of precipitation in South China Sea [J]. Environmental Science, 2014, 35(2): 475-480(in Chinese).
[5] 肖红伟, 肖化云, 王燕丽, 等. 典型污染城市9d连续大气降水化学特征: 以贵阳市为例 [J]. 环境科学, 2010, 31(4): 865-870. XIAO H W, XIAO H Y, WANG Y L, et al. Chemical characteristics of 9d continuous precipitation in a typical polluted city: A case study of Guiyang, China [J]. Environmental Science, 2010, 31(4): 865-870(in Chinese).
[6] AL-KHASHMAN A O. Study of chemical composition in wet atmospheric precipitation in Eshidiya Area, Jordan [J]. Atmospheric Environment, 2005, 39(33): 6175-6183. doi: 10.1016/j.atmosenv.2005.06.056 [7] YATKIN S, ADALI M, BAYRAM A. A study on the precipitation in Izmir, Turkey: Chemical composition and source apportionment by receptor models [J]. Journal of Atmospheric Chemistry, 2016, 49(3): 1-19. [8] 蒋冰艳, 吴尧, 李少艾, 等. 深圳市2010—2017年降水中化学组分特征及来源解析 [J]. 环境化学, 2019, 38(8): 1872-1881. doi: 10.7524/j.issn.0254-6108.2018101004 JIANG B Y, WU Y, LI S A, et al. Chemical compositions and sources of precipitation in Shenzhen from 2010 to 2017 [J]. Environmental Chemistry, 2019, 38(8): 1872-1881(in Chinese). doi: 10.7524/j.issn.0254-6108.2018101004
[9] 陈圆圆, 田贺忠, 杨懂艳, 等. 1997—2010年北京市大气降水离子特征变化趋势研究 [J]. 中国环境监测, 2013, 29(3): 20-25. doi: 10.3969/j.issn.1002-6002.2013.03.004 CHEN Y Y, TIAN H Z, YANG D Y, et al. Change of anion characteristics analysis on acid rain in Beijing 1997—2010 [J]. Environmental Monitoring in China, 2013, 29(3): 20-25(in Chinese). doi: 10.3969/j.issn.1002-6002.2013.03.004
[10] 肖致美, 李鹏, 陈魁, 等. 天津市大气降水化学组成特征及来源分析 [J]. 环境科学研究, 2015, 28(7): 1025-1030. XIAO Z M, LI P, CHEN K, et al. Characteristics and sources of chemical composition of atmospheric precipitation in Tianjin [J]. Research of Environmental Sciences, 2015, 28(7): 1025-1030(in Chinese).
[11] 张清华, 黎永珊, 于奭, 等. 桂林市大气降水的化学组成特征及来源分析 [J]. 环境化学, 2020, 39(1): 229-239. doi: 10.7524/j.issn.0254-6108.2019011801 ZHANG Q H, LI Y S, Y S, et al. Characteristics and source analysis of chemical composition of atmospheric precipitation in Guilin City, South China [J]. Environmental Chemistry, 2020, 39(1): 229-239(in Chinese). doi: 10.7524/j.issn.0254-6108.2019011801
[12] 赵丽莉, 魏疆, 孙红叶. 乌鲁木齐近十二年(1997—2009)降水中化学组分变化趋势分析 [J]. 中国环境监测, 2011, 27(2): 83-87. doi: 10.3969/j.issn.1002-6002.2011.02.021 ZHAO L L, WEI J, SUN H Y. Analysis on the chemical composition change rule of precipitation between 1997—2009 in Urumqi [J]. Environmental Monitoring in China, 2011, 27(2): 83-87(in Chinese). doi: 10.3969/j.issn.1002-6002.2011.02.021
[13] 吕湘芳. 乌鲁木齐市降水化学特征时空变化研究 [J]. 干旱环境监测, 2013, 27(2): 55-59. doi: 10.3969/j.issn.1007-1504.2013.02.002 LV X F. Study on temporal and spatial changes of chemical composition of rainfall in Urumqi, Xinjiang [J]. Arid Environmental Monitoring, 2013, 27(2): 55-59(in Chinese). doi: 10.3969/j.issn.1007-1504.2013.02.002
[14] AYER G P. Some practical aspects of acid deposition measurements: presentation to the 3rd expert meeting on acid deposition monitoring network in East Asia [R]. Japan: Niigata Prefecture, 1995. [15] 程新金, 黄美元. 降水化学特性的一种分类分析方法 [J]. 气候与环境研究, 1998, 3(1): 83-89. CHEN X J, HUANG M Y. A classification method to analyze the chemical characteristics of precipitation [J]. Climatic and Environmental Research, 1998, 3(1): 83-89(in Chinese).
[16] 邓黄月. 上海市大气降水的化学组成分析及来源解析[D]. 上海: 华东师范大学, 2016. DENG H Y. The chemical characteristics of precipitation and their source analysis in Shanghai[D]. Shanghai: East china Normal University, 2016 (in Chinese).
[17] HU G P, BALASUBR A R, WU C D. Chemical characterization of rainwater at Singapore [J]. Chemosphere, 2003, 51(8): 747-755. doi: 10.1016/S0045-6535(03)00028-6 [18] XIAO H W, XIAO H Y, LONG A M, et al. Chemical composition and source apportionment of rain water at Guiyang, SW China [J]. Journal of Atmospheric Chemistry, 2013, 70(3): 269-281. doi: 10.1007/s10874-013-9268-3 -
 点击查看大图
计量
- 文章访问数: 3631
- HTML全文浏览数: 3631
- PDF下载数: 106
- 施引文献: 0


