-
全氟化合物(perfluoroalkyl substances,PFASs)是19世纪40年代人工合成的一类具有稳定疏水结构[F(CF2)n]和亲水官能团的持久性有机化合物(POPs),以全氟烷基羧酸(PFCAs)和全氟烷基磺酸(PFSAs)为主[1]. PFASs因其具有理想的疏水疏油、表面活性和热化学稳定性等能力,被广泛应用于制备消防泡沫灭火器(AFFF)、金属电镀材料和防污纺织/炊具等民用或工业生产[2 − 4]. 现有的研究已经证实,PFASs在环境中广泛存在,且具有一定的生物富集能力和生物毒性[5]. 因此,PFOS和PFOA及其相关化合物已相继受到管控,全球开始生产使用毒性较低的短碳链(C≤7)或多氟类PFASs,我国是PFASs的重要生产地[6 − 7].
PFASs污染源分为直接来源和间接来源. 直接来源是指在生产或在日常生活使用的过程中产生的PFASs直接排放到环境中,如用作加工的基于PFAA的铵类等物质(如APFHx,产物为PFHxA)作为生产原料,最终生成全氟烷基类物质,会在大气或水体中有相应排放[8];间接来源是指PFASs前体物通过生物或化学等降解而产生的污染物,如全氟辛烷磺酰氟(PFOSF)和氟化调聚醇(FTOH)等可通过生物降解的转化方式生成PFASs. 与氟化工厂不同,常见的工业园区是由多种工/民用企业组成,聚集了众多工业生产领域综合型园区,且园区总的范围和数量远大于氟化工厂(fluorochemical industrial park,FIP),这使其可能具有与FIP相当的PFASs污染贡献[9],对其环境中的PFASs进行排放规模的预测和风险管控标准的制定亟需科学依据. 基于此,本研究对于少有关注的综合型化工园区及周边表层土壤介质中PFASs的污染特征与空间分布进行研究,并评估了该地区PFBA、PFHpA、PFOS和PFOA对环境和人体的潜在风险,填补了对PFASs非典型污染区域的研究数据空白,以期为该地区PFASs污染的相关管控提供数据支撑.
-
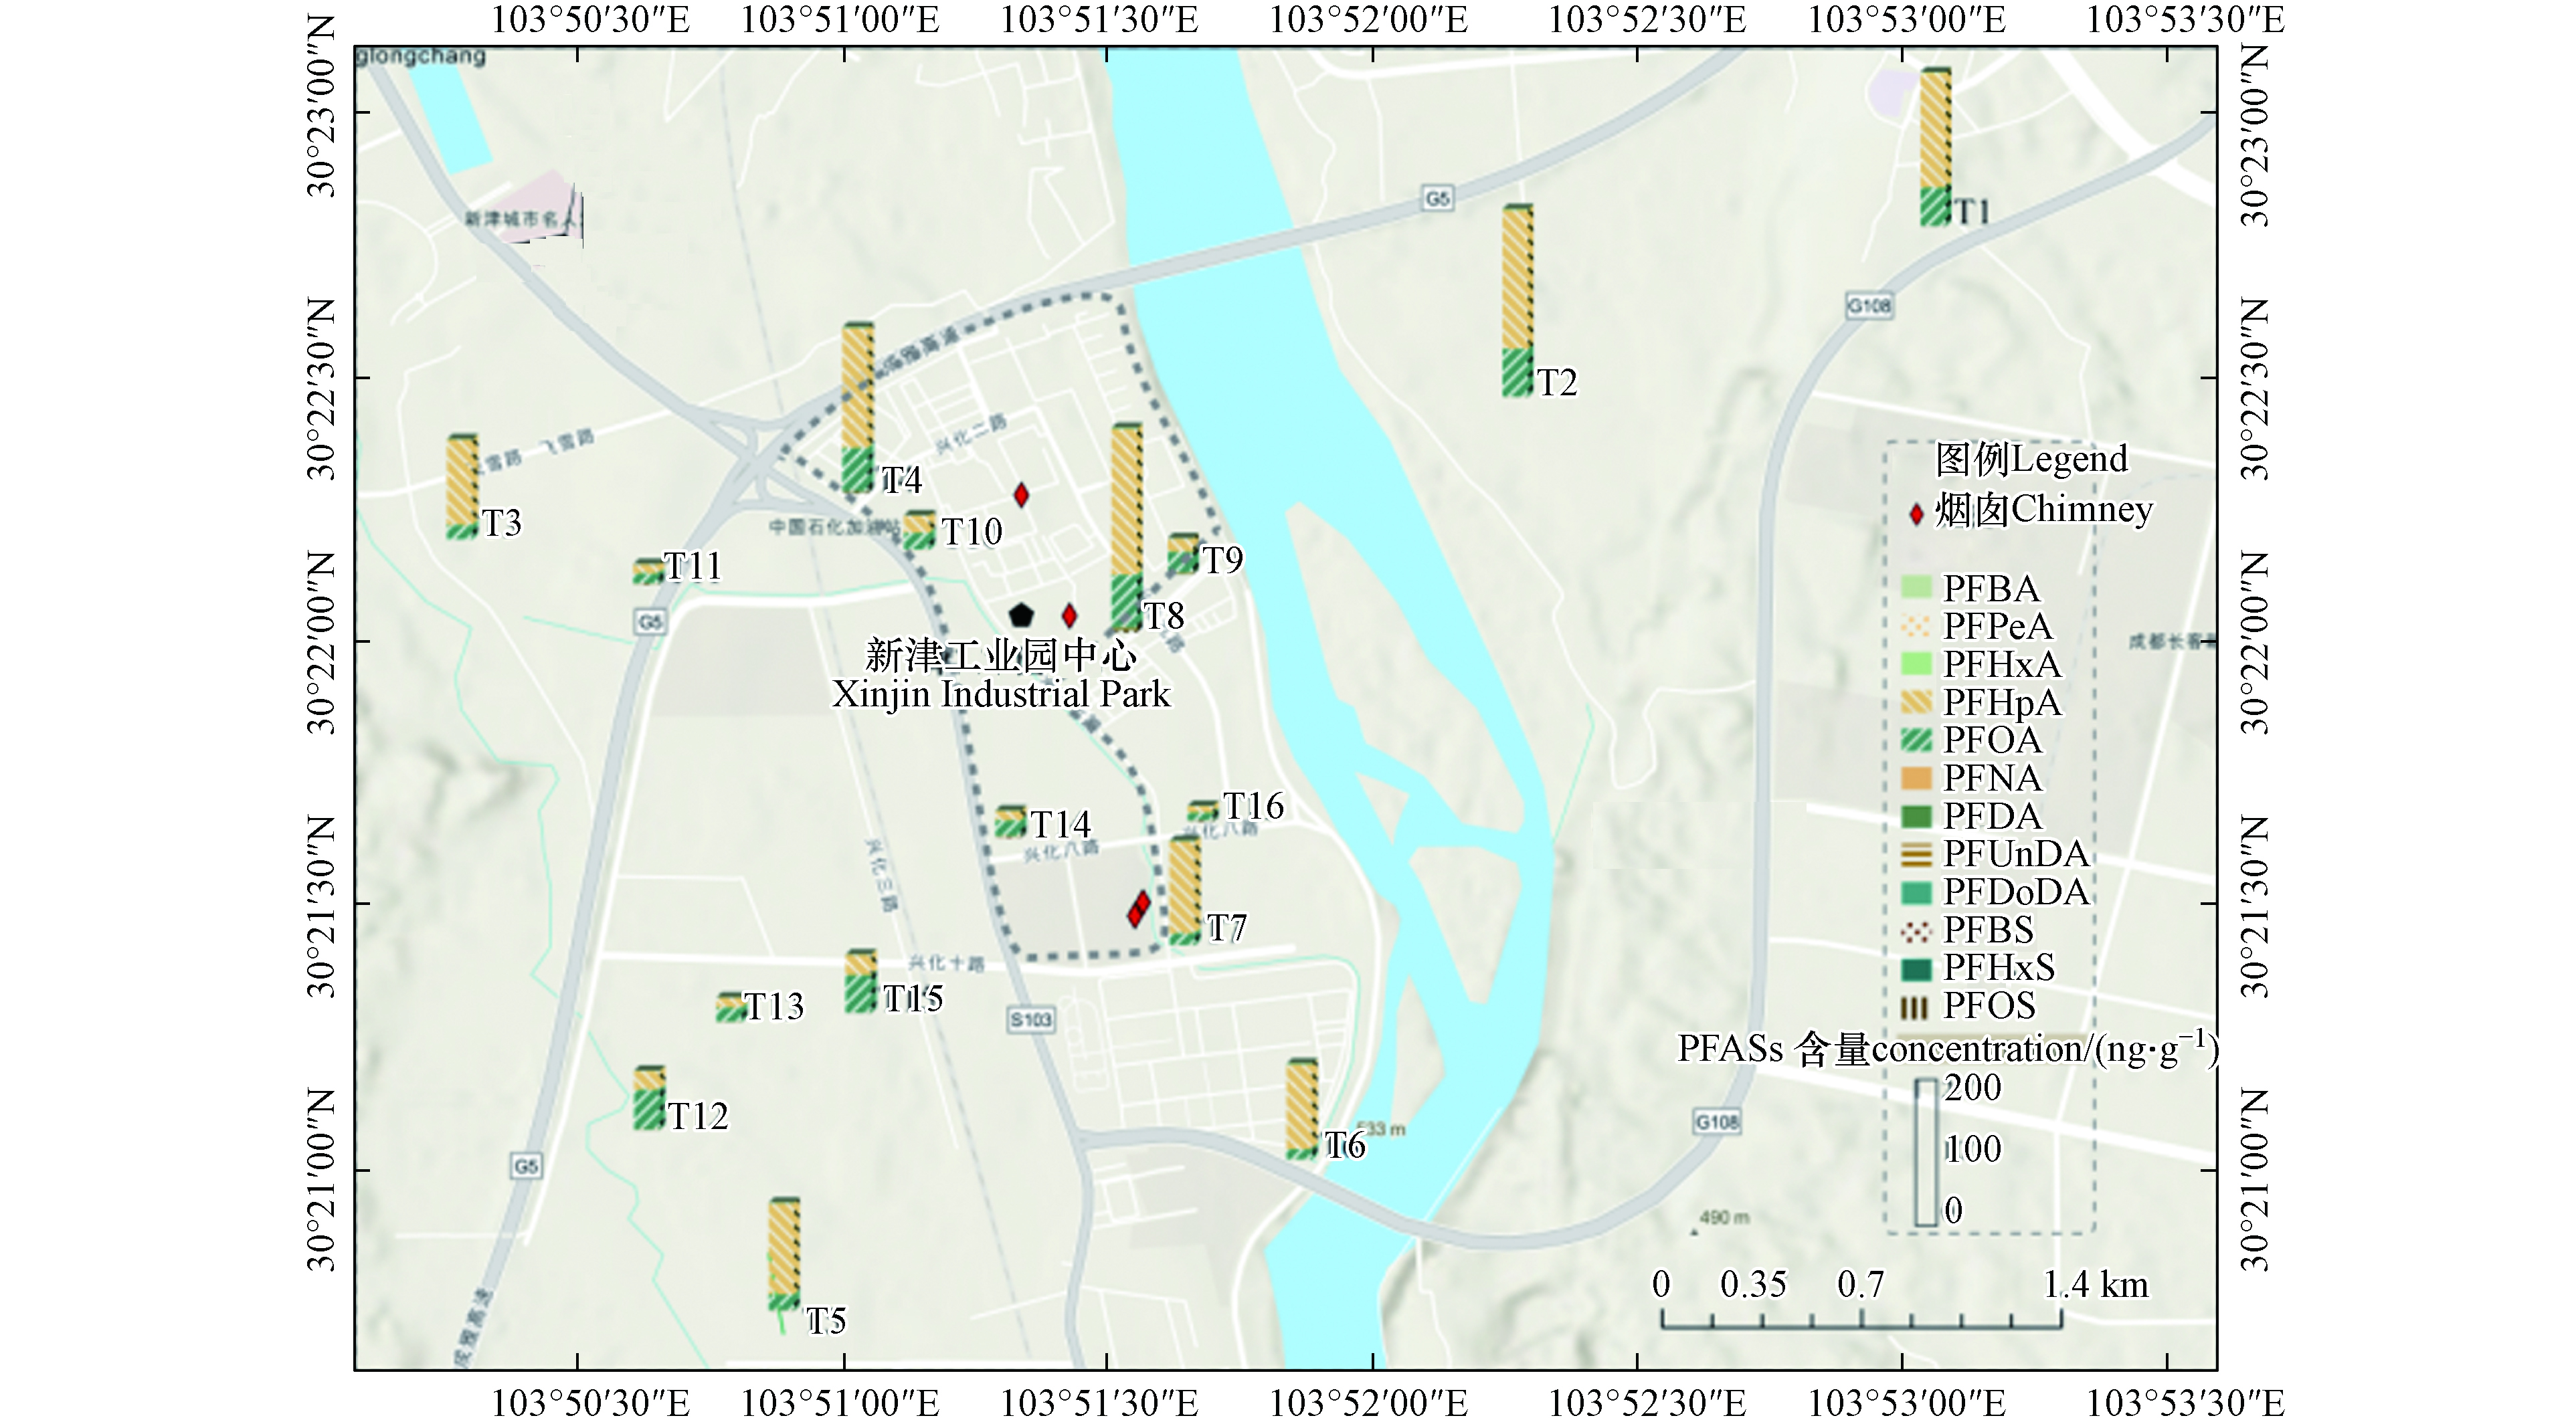
研究区域为四川省成都市新津工业园及周围3000 m内(图1),主导风向为西南风,工业园包括新津工业园B区及新津华通园,总面积约115.8万m2,是成都市重点发展的三大化工园区之一. 以工业园区为采样中心,采集不同风向上不同距离的土样,共计16个土壤样品. 土样用不锈钢铲子挖取,装于聚丙烯材质的塑封袋中,运输至实验室于−4 ℃冰柜保存.
-
超高效液相色谱-串联质谱(1290 Infinity Ⅱ-6465B,安捷伦科技有限公司)、真空冷冻干燥仪(XHDGJ-10,上海霄汉实业发展)、水浴氮吹仪(JHD-006S,上海极恒实业)、水浴恒温振荡器(SHA-B,江苏金坛宏华仪器厂)和低速台式离心机(TDL-5-A,上海安亭科学仪器厂).
高纯度混合标准品PFAC-MXB和高纯度混合碳同位素标记品PFAC-MXA(Wellington公司),甲醇(色谱纯,99.9%,Fisher Chemical,加拿大)、氨水(分析纯,25%,成都市科隆化学品有限公司)和Milli-Q超纯水. 一次性PP离心管(德国CNW)和PestiCarb柱(500 mg,6 mL,博纳艾杰尔科技有限公司)等.
标准品包括:全氟丁烷羧酸(PFBA)、全氟丁烷磺酸(PFBS)、全氟戊烷羧酸(PFPeA)、全氟己烷羧酸(PFHxA)、全氟己烷磺酸(PFHxS)、全氟庚烷羧酸(PFHpA)、全氟辛烷羧酸(PFOA)、全氟辛烷磺酸(PFOS)、全氟壬烷羧酸( PFNA)、全氟癸烷羧酸(PFDA)、全氟十一烷羧酸(PFUnDA)和全氟十二烷羧酸(PFDoDA). 碳标记内标物包括:13C4-PFBA、13C2-PFHxA、13C4-PFOA、13C5-PFNA、13C2-PFDA、13C2-PFUnDA、13C2-PFDoDA、13O2-PFHxS和13C4-PFOS.
-
本研究采用超高效液相色谱-串联质谱(UPLC-MS/MS,1290-6465B,安捷伦)及C18色谱柱(Zorbax Eclipse Plus C18,2.1 mm×50 mm,1.8 μm)对土壤样品进行定性定量分析. 仪器流动相设置为:0.00—0.10 min,90.0%A相(5 mmol·L−1乙酸铵溶液),10.0%B相(甲醇);0.10—6.00 min,A相降低至5.0%,B相升高至95.0%;6.00—8.00 min,5.0 %A相保持,后运行3 min. 仪器采用ESI源负离子模式,设置包括:样品进样量(5.00 μL),柱温(35 ℃),流速为(0.3 mL·min−1). 更多仪器参数设置和目标物的结构信息见表1.
-
将土样真空冷冻干燥24—36 h,去除杂草、小石块后研磨过100目筛. 土样前处理参考已有方法[10]. 准确称取~1.000 g土样,加入2 ng PFAC-MXA内标物,混匀后放置过夜. 采用5 mL甲醇超声萃取,5000 r·min−1下离心8 min,取上清液转移至新的离心管中,重复3次,合并上清液. 使用柔和高纯氮气将上清液浓缩至5 mL左右,用Cleanert PestiCarb固相萃取柱净化,萃取液经氮吹浓缩至0.5 mL并过0.22 μm尼龙滤膜,于进样小瓶中封存冷藏,待上机检测.
-
为避免对样品产生污染或影响,实验过程中所用容器均为聚丙烯材料,在采集样品时,每个点位土壤采集前都用甲醇擦拭一遍铁铲,并保存于PE塑封袋中. 实验采用内标定量法,13种PFASs标准溶液的线性范围为0—50 ng·mL−1,线性系数r>0.9989. 实验设置两组不同浓度(2 ng、20 ng)的加标回收率实验,每组3个平行样品,回收率为67.1%—97.7%,标准偏差为0.3%—7.9%,表明该方法满足土壤样品中PFASs的定性定量检测. 实验中每批样品设置1个过程空白样品,空白样品中均未检出PFASs,根据3倍信噪比对应的浓度计算方法检出限(MDL)[10],MDL范围为0.001—0.036 ng·g−1(表2).
-
采用IBM SPSS Statistics 25对实验数据进行统计分析,各目标物含量之间相关性运用Pearson检验分析,PFASs差异性分析运用Student-t检验,所有检验均为双尾检验,当P<0.05时,认为差异具有统计学意义;采用Origin 2021对PFASs的含量特征和源解析(主成分分析)进行作图;PFASs空间分布采用ArcGIS Pro软件制图.
克里金插值法(Ordinary Kriging, OK)是数据在空间中满足正态分布的条件下,计算样本变异函数以量化空间自相关性,再选择合适的理论模型进行模拟从而对估计点进行线性估计[11]. 该法适用于在稀疏不均匀分布的离散点插值,可估计出最好的连续表面[12].
-
本研究对成都市新津工业园区及周围的土壤中的13种PFASs进行检测分析,结果显示,除PFDS外,其余12种PFASs均有检出,其中,PFBA(C4)、PFHpA(C7)、PFOA(C8)、PFNA(C9)检出率为100%,其次为PFDA(C10)=PFUnDA(C11)(93.8%),而后依次PFHxA(C6,87.5%)>PFOS(C8,75.0%)>PFDoDA(C12,56.3%),PFBS(C4),PFHxS(C6)和PFPeA(C5)检出率小于50%. 每个点位均有PFASs检出,C7和C8的PFCAs是该区域主要使用和生产排放的PFASs.
土样中PFASs的含量与检出率如表3所示,ω(Σ12PFASs)为19.31—244.94 ng·g−1(dw,下同),平均值为104.84 ng·g−1,属于Brusseau等[13]根据全球2000点位以上的土壤PFASs数据整合而定义的二级点源级别,即使用或受到被PFAS污染的介质影响(如生物固体和灌溉水)而导致的土壤污染. 表现为,远低于氟化工业园区周边环境中的PFASs含量,如桓台县FIP[14](最大含量值641 ng·g−1)和湖北省FIP土芯[15](含量范围1.19—1495 ng·g−1),但高于一般的城市土壤,如山东省[16](4.23—48.72 ng·g−1),且远高于住宅区土壤(如全国居民区[13],0.24—1.56 ng·g−1)和偏远地区土壤(如青藏高原东北部地区[10],平均含量0.398 ng·g−1). 研究区域中,PFHpA(7.87—174.42 ng·g−1,平均值72.99 ng·g−1)是含量最高的主要PFASs污染物,其次为PFOA(8.62—62.12 ng·g−1,平均值29.25 ng·g−1),两者远高于其余的10种PFASs(nd—2.34 ng·g−1,平均值0.32 ng·g−1). 土样中PFCAs的总含量(平均值104.49 ng·g−1)明显高于PFSAs(1.26 ng·g−1)(P<0.01),这与目前大多数关于环境介质中PFASs浓度研究一致[17 − 19],同时表明PFOA和PFOS及其相关物在受到管制后,该地区开始使用PFHpA替代长链PFASs的使用. 因优良的疏水、疏油和低表面张力,PFHpA和PFOA常见于纺织、皮革和表面活性剂等相关行业[20 − 21],且PFOA已确定至少有14种产业用途[4],经调查,该园区包含约70家企业,主要包括精细化工、材料化工、设备制造、香料、油料、纸业和科技产业,涉及的塑料制品、材料制备、镀铬镀铜和混凝土加工等企业均可能使用PFHpA和PFOA相关原料.
图2是研究区域土壤中各PFASs含量,PFHpA(C7)和PFOA(C8)为该研究区域最主要的污染因子,而其他11种PFASs含量集中在nd—0.75 ng·g−1级别,这与偏远地区环境介质中的赋存含量相当[10,22],污染水平较低. PFHpA和PFOA在各点位PFASs含量中贡献率分别为30.8%—87.9%和10.5%—66.6%(平均值为59.1%和36.7%),且每个点位两者贡献值之和均超过85%. 值得注意的是,PFHpA和PFOA含量最高点均在T8(铜冶炼公司),分别为174.42 ng·g−1和62.12 ng·g−1,远高于泰州市某有机氟化工厂周围土壤中浓度水平(0.58 ng·g−1,1.76 ng·g−1)[23].
-
研究区域各点位PFASs的含量值如图1所示,ΣPFASs含量最高点为T8(铜业公司),平均含量值244.94 ng·g−1,其次为T2(225.00 ng·g−1)>T4(生态园,199.18 ng·g−1)>T1(184.39 ng·g−1)>T5(包装公司,129.62 ng·g−1)>T7(水务公司,125.17 ng·g−1)>T3(120.05 ng·g−1)>T6(混凝土公司,114.96 ng·g−1),其余8个点位的PFASs含量水平为15—100 ng·g−1. 其中T4、T8、T9、T14、T10和T16在园区内部,其余点位距园区中心1000—3000 m. 园区内,化工工业分布广泛,纸业和材料制备工业主要在四方位边缘,香、油料产业集中在中部. 有趣的是,相关性分析发现除PFBS表现出与距园区距离呈负相关性(P<0.05)外,园区外点位的PFASs含量与距离无明显相关性,这与大多数园区PFASs排放特征研究不同[9,15,19,24 − 25],其含量并无随距园区距离的增加而降低,这表明含量较低的PFBS属于经园区点源排放随大气扩散的污染方式,但该园区其他PFASs的污染传播途径有所不同. 除PFHpA和PFBS外,各点PFAS含量无显著性差异(P>0.05),即这些物质属于一般污染物,普遍存在于该地区,是通过包括日常使用和大气传输等途径而赋存于表层土壤中. 对PFHpA进一步分析,该物质在T10和高污染点位T1—8(设为A组)的含量为Σ12PFASs最大贡献者(20.80—174.42 ng·g−1),而PFOA在低污染点位T9和T11—16(设为B组)的含量为Σ12PFASs最大贡献者(8.62—47.45 ng·g−1),根据独立样本t检验,PFHpA在两组中具有显著性差异(P<0.05),在A组含量明显高于B组,而PFOA没有显著性差异. 这表明在该地区,PFOA是一般污染物,而PFHpA是特征污染物,具有相应污染排放点.
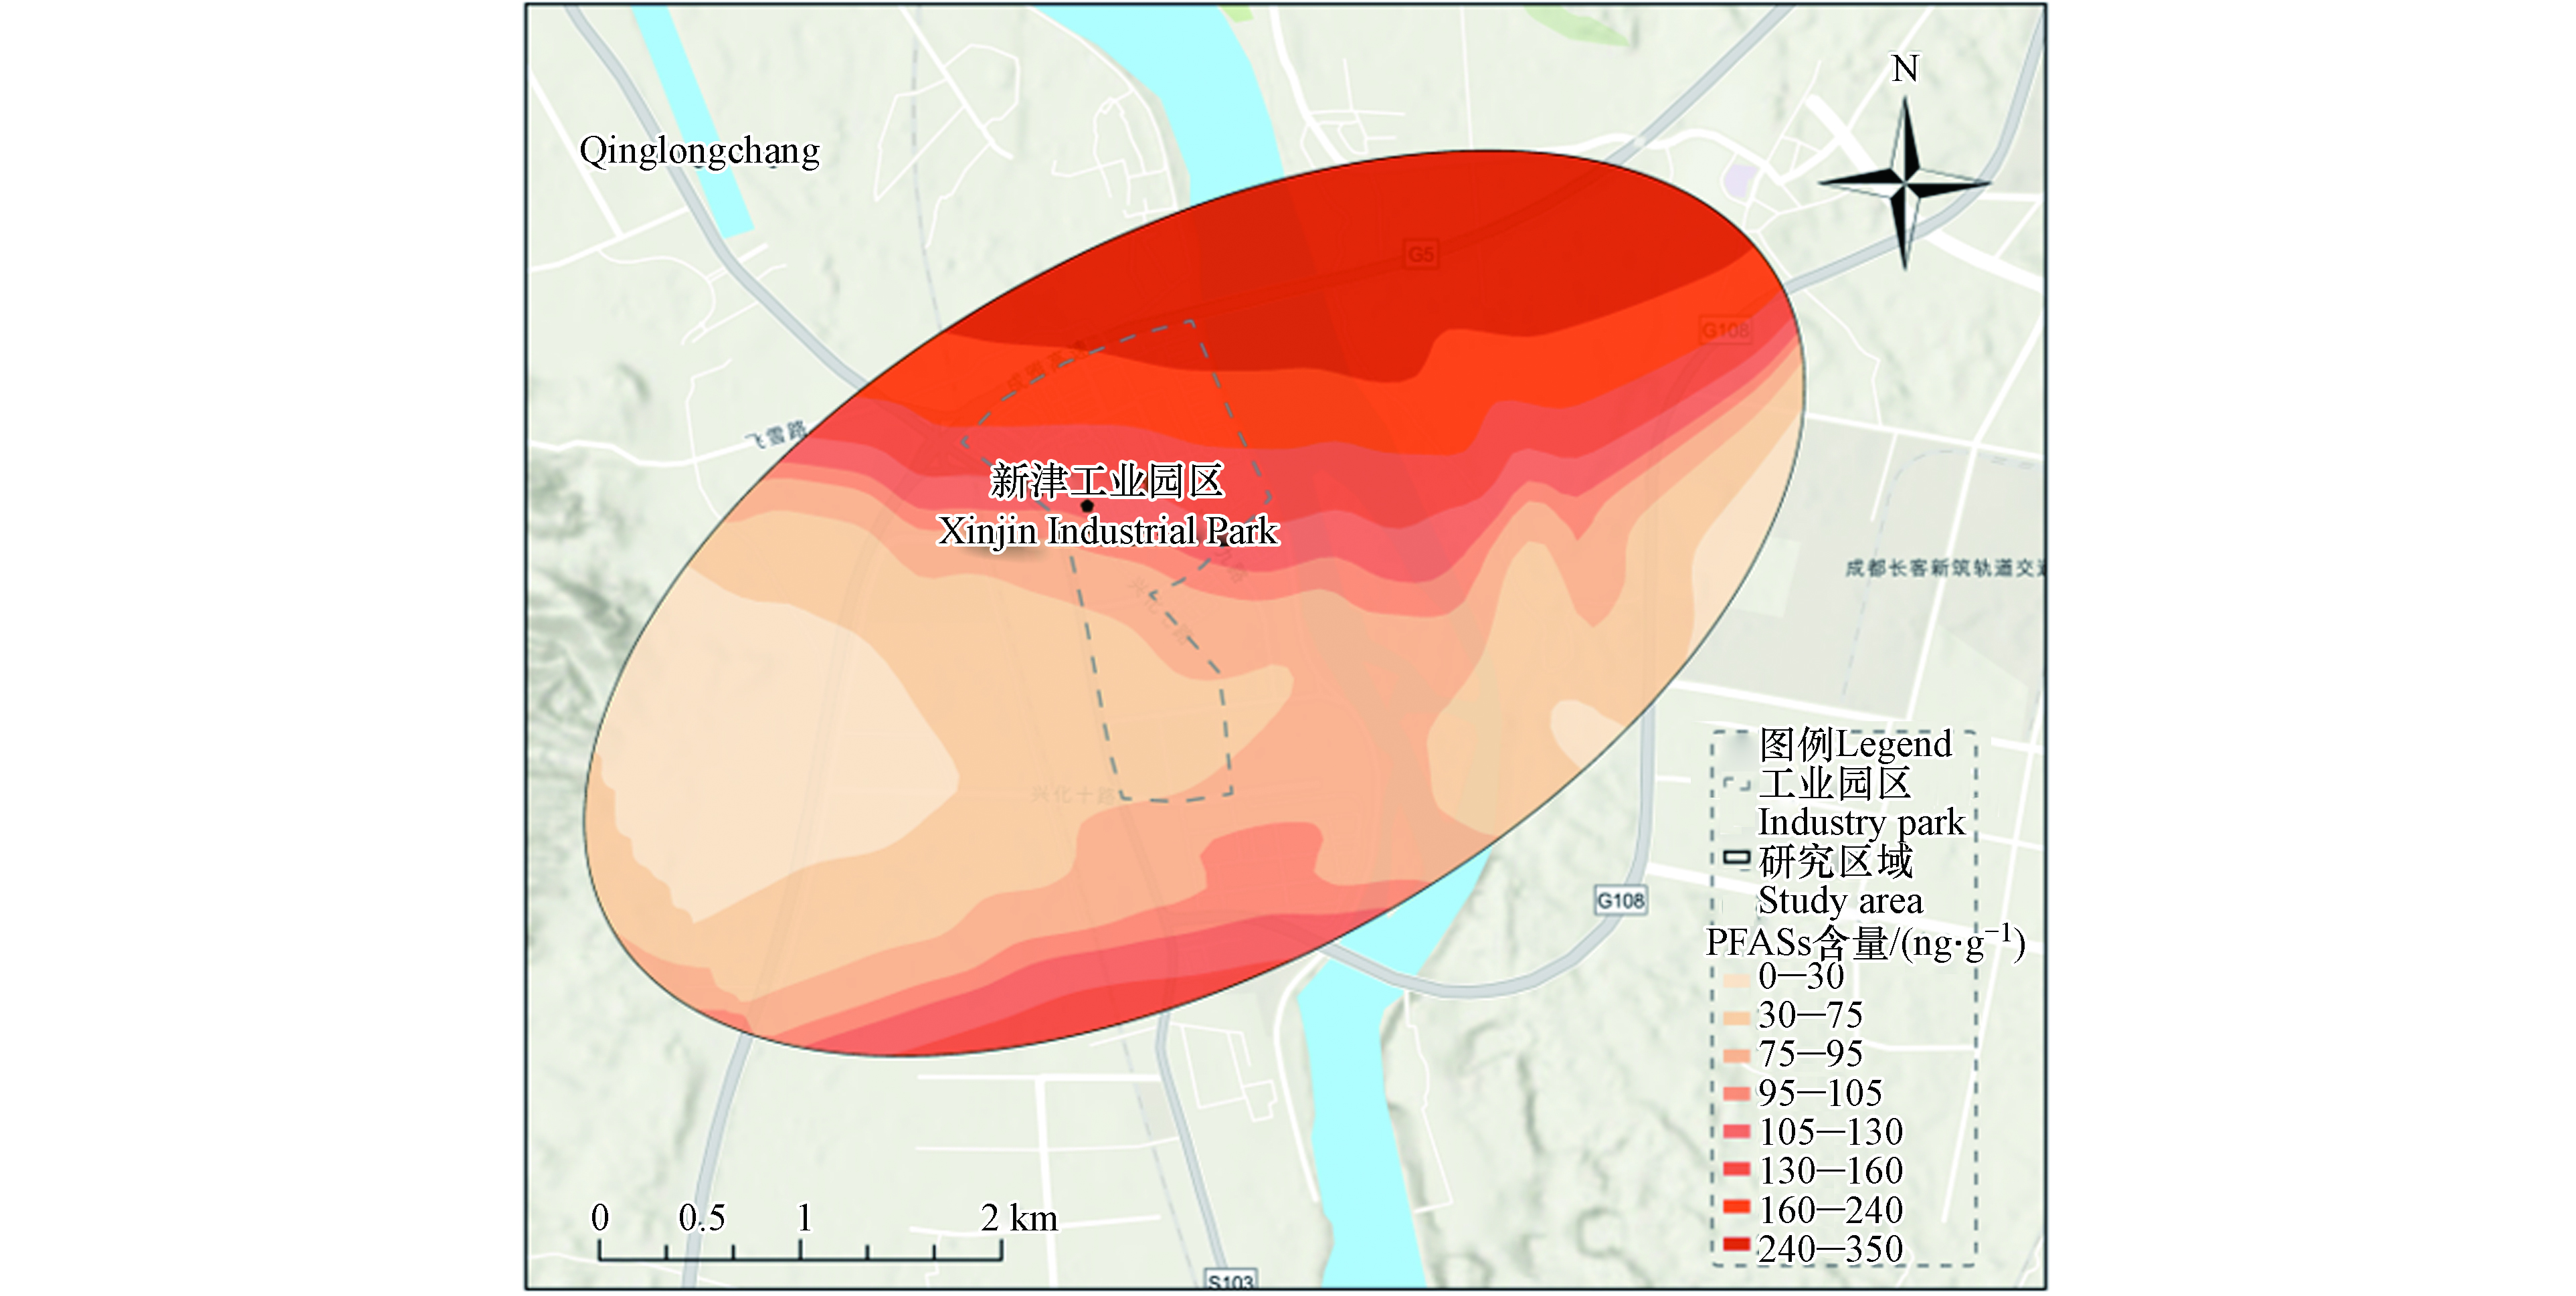
为进一步了解该地区土壤中PFASs的空间分布特征,采用普通克里金法进行含量空间制图和描述(图3). 在该法精确预测尺度(1.5 km)内划定研究区域,趋势分析选择高斯函数,使用基于半变异函数的J-Bessel模型进行预测未知点位[26],经交叉验证,该模型标准平均值0.005,平均标准误差接近均方根预测误差,标准均方根预测误差1.224,为最优模型. 由图3可知,模型预测PFASs在园区北部往上地区污染严重,呈带状分布,表示污染源集中[27 − 28]. 数据显示浓度最高值在园区内的PFASs污染点位T8(铜业公司,244.94 ng·g−1)和T4(生态园,199.18 ng·g−1),前者主要是铜材压延及废旧五金、电器等加工,后者涉及金属表面处理剂、涂料、专用蜡等生产,存在使用PFHpA及其相关物进行工业生产活动的情况,且园区内工厂建有4个烟囱(约40 m)进行工业气体排放,可能为PFASs排放源. 根据高斯扩散模型[29 − 30],当污染源处于无界的流畅均匀的空间,会以风向为x轴,在纵向和横向进行扩散,以此传播到远距离处再进行沉降,且新津地处平原地区,湍流稳定,南风和西南风是区域主导风向,促进了污染物通过烟囱的大范围传输[31],经两次实地调查,估计烟囱抬升高度约30—50 m,计算地面浓度最大值在距烟囱800 m以上,可解释距园区较远的无污染源地点T1和T2检出高含量的PFASs.
-
主成分分析法(PCA)是一种将多个复杂且看似无关联的指标转换为少数综合性指标的多元统计分析方法,其基本原理为降维思想[32],得到的简单化的指标能代表绝大部分原数据矩阵的信息. PCA被广泛应用于对于多种环境介质中不同污染物的来源分析[32 − 34],在水体和土壤中PFASs的来源解析也常有报道[20,22]. 运用IBM SPSS数据分析的PCA法首先进行数据编码、筛选无效数据等预处理,然后计算标准化后的数据的相关系数、特征值、贡献率以及累积贡献率,最后依据特征值或累计贡献率选取主成分,通过软件算法运算得到各因子在各主成分上的载荷矩阵. 本研究选取检出率大于40%的9种PFASs进行PCA分析,标准化后的PFASs数据之间的相关性矩阵、特征值和贡献率如表4所示.
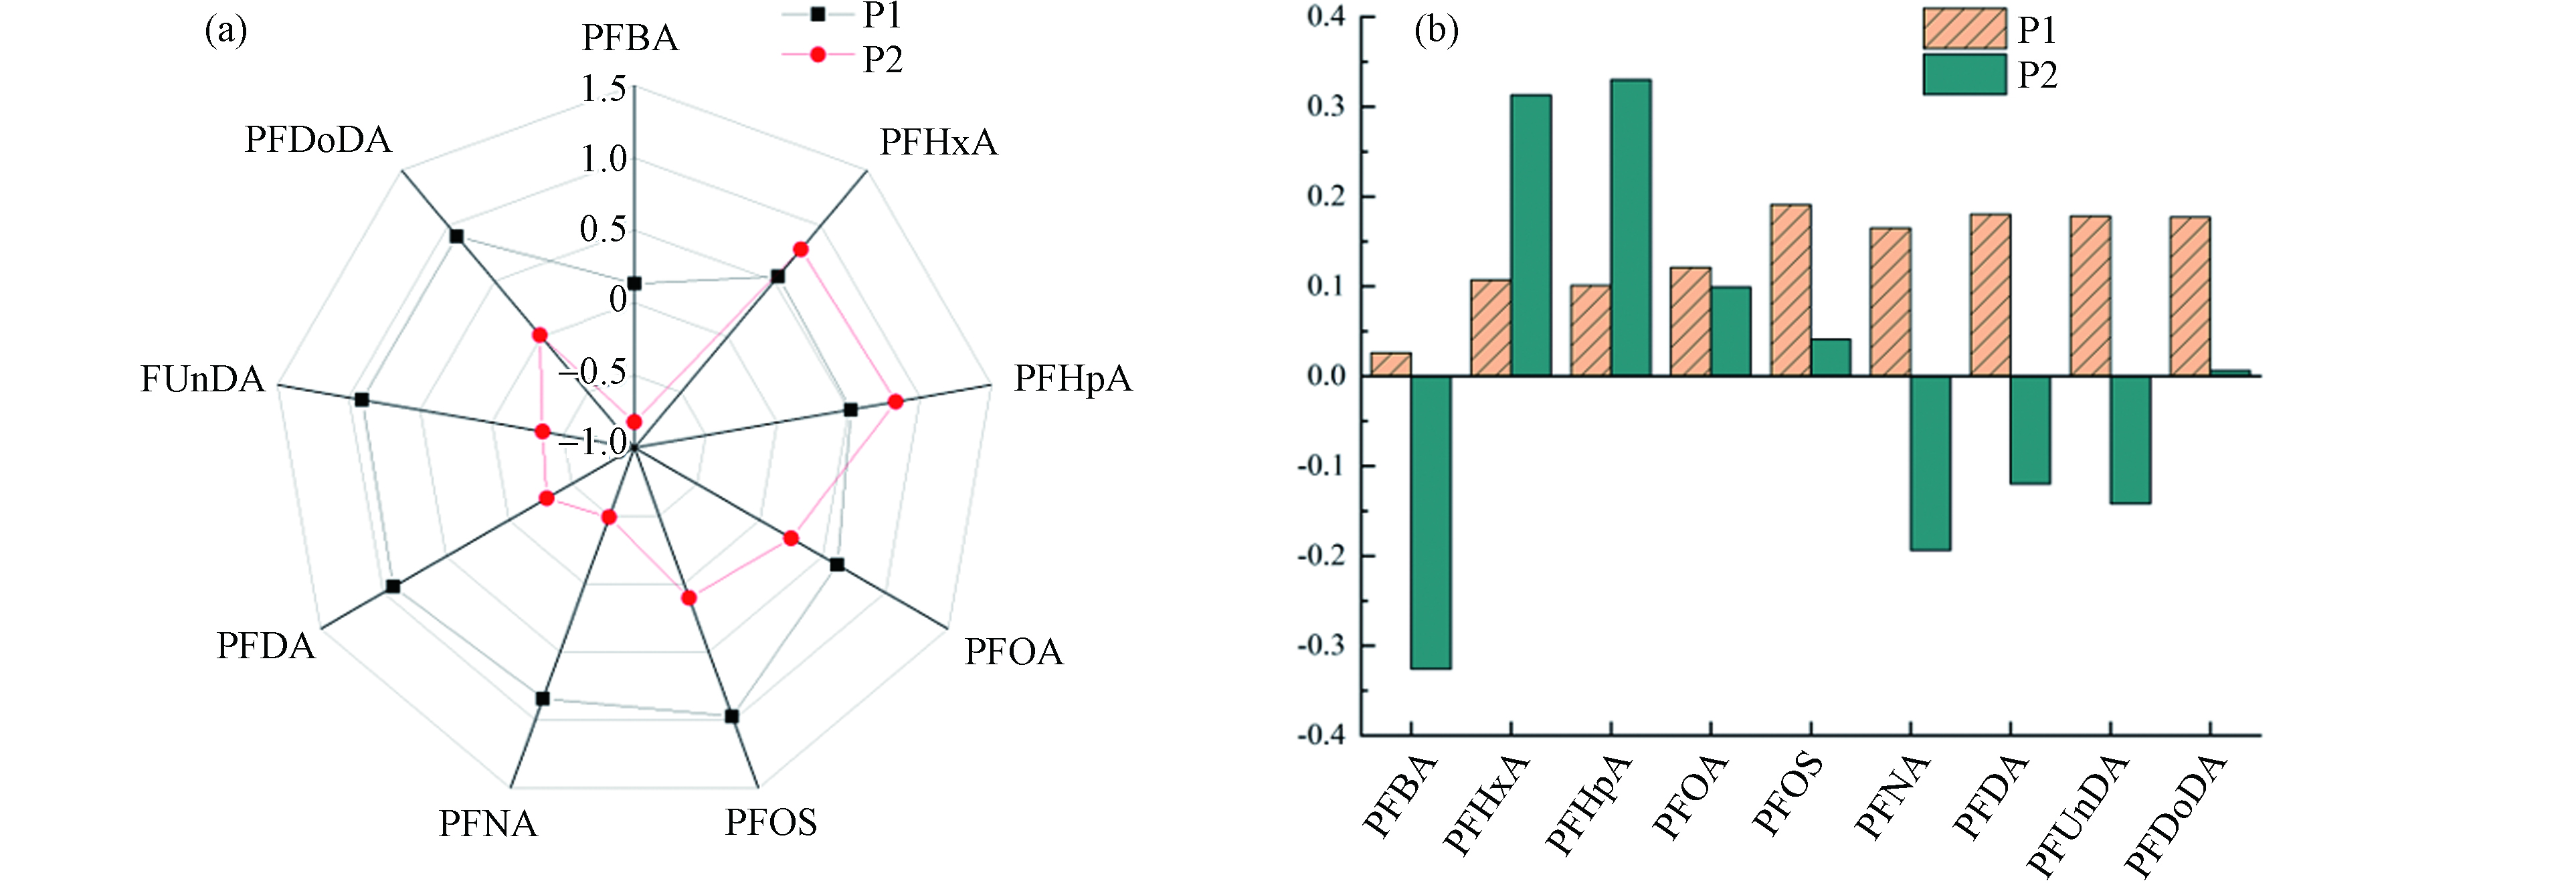
选取到特征值大于1的两个因子为主成分,第一主成分为P1,第二主成分为P2,累计贡献率84.697%,9种PFASs通过进一步运算分析得到标准化的因子载荷及得分矩阵,以表示在各个因子所占的比重,载荷越大或得分越高则越能代表该主成分的特征,成为描述该主成分的主要依据,正(负)号代表主成分与因子成正(负)相关. 图4为软件Origin 2021做出的主成分因子载荷图和得分图.
通过PCA分析得到的主成分因子可与排放来源形成相对应的关系,即不同的PFASs可以作为污染来源的典型标志物[20]:PFOS主要是应用于石化行业和电子产品清洗等相关行业[35],PFDA、PFNA主要来源于生产PFCAs活动的排放[36],PFOA主要用于食品的包装过程、灭火剂的使用和纸质类表面的处理等,PFHxA主要用于造纸、制造皮革和纺织品等的有关行业[4,21],PFHpA和PFBA分别主要用于表面活性剂和工业生产中的电化学氟化过程[37]等. 16个点位中,PFASs特征来源被分为P1和P2. P1中6种长碳链PFASs(PFOS、PFDA、PFUnDA、PFDoDA、PFNA、PFOA)载荷较高(得分值≥0.618),共对研究区域67%的PFASs污染来源进行解释,六者在各点中含量较低且相关性较高(P<0.01),表明该地区广泛存在长碳链PFASs污染且具有相似来源,结合空间分析,该现象属于日常生活产生和大气沉降形成的一般性污染. P2中,PFHpA、PFBA、PFHxA这3种短碳链的载荷较高(绝对得分值≥0.787),其特征点位为非园区的T1、T2、T6和T7,但与园区内PFASs污染物显著相关(P<0.05),PFHpA可经烟囱扩散至远距离地区进行沉降,另外还可能同时影响大气中的如氟调聚物、全氟磺胺类等PFASs前体物转化降解,比如常用于含氟聚合物加工的FTOHs物质降解可形成FTUCA中间产物并最终生成C4—C6的短碳链PFASs[38],多种来源导致相当含量的PFASs混合并通过干湿沉降到土壤中,位于下风向的T1和T2的区域由此富集了来自包括化工园区生产活动排放的高含量污染物. 此外,园区内的污染点源T8和T10在P1和P2负载值相似,表明同时受到生产活动的排放和大气传输的影响.
-
PFASs对人体具有多种毒性,对其进行环境和健康风险评估极为重要,常用方法为风险商值法[39](risk quotient,RQ),RQ>1表示有健康风险. 但由于目前对土壤中各PFASs的RQ研究参数较为匮乏[23],本研究根据毒理学方法,选择使用CSOIL模型定量计算通过食入土壤颗粒、吸入土壤颗粒和皮肤接触3种方式的环境暴露含量EDIPFBA、EDIPFHpA、EDIPFOA和EDIPFOS,再进一步与各国建议的PFAS指导值进行比较来判断风险程度. CSOIL模型适用于多种对人体健康有影响的污染物,通过人体暴露的最基础途径进行人体摄入量计算,与健康指导值对比即可判断受影响大小,且国内外均有针对本国人民的相应特征参数值,是较为成熟的健康风险评估方法[40]. 计算方式参考文献[41],参数选用文献[40]和[42]提供的我国居民土壤污染物暴露参数,具体信息见表5.
根据公式计算本研究点位土壤中PFBA、PFHpA、PFOA和PFOS的每日预计摄入量如表6所示,在3种暴露途径中,经口食入是PFASs进入人体的主要途径,其中PFBA、PFHpA和PFOA在儿童体内每日摄入量均高于成人(1个数量级),但低于部分国家管理机构发布的健康指导值,表明该地通过食入、吸入土壤颗粒和皮肤接触土壤所产生的风险相对较小,但不可忽视长期的低剂量暴露亦对人体生殖系统和免疫系统等存在潜在风险. 此外,表层土壤中的PFASs可以经淋溶进入地下水或者富集于植物,进而存在于饮用水和蔬菜水果等饮食中,最终进入人体不断蓄积. 由于参考值的缺乏,本研究污染含量最高的PFHpA的健康风险不能确定,但应当采取措施防止其暴露风险加剧. 儿童的相对较高暴露量预示着PFASs的相关风险需要社会各界的持续关注和重视,除PFOS和PFOA外,我国的环境质量基准标准值亟需加速补充PFASs及其替代品数据,尤其是在沉积物和土壤介质中.
-
在对四川省成都市新津县工业园区及周围环境表层土壤中13种PFASs进行的检测分析中,除PFDS(C10)外,其余PFASs都有一定程度的检出,ω(Σ12PFASs)为19.31—244.94 ng·g−1(平均值104.84 ng·g−1),主要的污染因子为PFHpA(C7,7.87—174.42 ng·g−1)和PFOA(C8,8.62—62.12 ng·g−1). PFASs污染含量较高点位分布在园区中心和城市主导风向下风向区域. 通过差异性分析和主成分分析,探讨了该区域PFAS污染来源和传输途径,其特点有:一是PFHpA由工业园区内企业相关工业生产活动通过烟囱直接排放,二是日常生活中排放的PFASs除分布于周围环境外,经大气传输后沉降于其他地区的表层土壤中,最终导致郊区土壤中有与园区环境相当水平的PFHpA污染,同时PFOA在全区域普遍分布. 对PFBA、PFHpA、PFOA和PFOS进行的环境和健康风险评估表明该地区PFOA和PFOS的污染风险较小,儿童暴露量大于成人. 但是,一方面由于目前对土壤中各种PFASs生态毒性研究参数较为匮乏,人体暴露量较高的PFHpA的风险影响未能估计,另一方面是未研究更深层次土壤中PFASs的污染水平,难以进行其他途径的风险暴露估算,所以本研究对该区域土壤中PFASs的风险评估具有一定的局限性,在进一步开展研究的同时对该地区的PFHpA及相关污染的监管亦不可忽视,且亟需相关部门制订我国PFOS和PFOA在沉积物和土壤等未有公开研究的介质中的环境质量基准标准,加强PFASs环境管理体系建设.
成都市某工业园区及周围表层土壤中全氟化合物的分布特征与风险评估
Distribution characteristics and risk assessment of perfluoroalkyl substances in surface soils in and around an industrial park in Chengdu
-
摘要: 综合型工业园具有工用和民用生产的双重功能,多领域的生产活动导致产生的污染物混杂且难以全面处理,可能造成更为广泛和严重的影响. 本研究以成都市新津工业园及周围表层土壤环境为对象,分析其13种全氟化合物(PFASs)的浓度水平和空间分布特征. 结果表明,该区域共有12种PFASs被检出,Σ12PFASs含量平均值为104.84 ng·g−1(dw). 在检出的12种PFASs中,含量较高的为PFHpA(平均值为72.99 ng·g−1,占比70%,下同)与PFOA(29.25 ng·g−1,28%)是该地区主要PFASs污染物. 普通克里金插值法(OK)结果显示,PFASs向园区北面方向有递增趋势,浓度偏高,呈现大范围高污染的带状分布特征. 通过差异性和主成分分析,该地区土壤中PFASs污染来源主要为园区内的PFHpA相关工业生产活动通过烟囱进行的扩散排放和大气沉降,其次为日常生活中PFASs的产生和排放. 基于CSOIL模型的风险评估分析表明,该地区PFOA和PFOS风险值较小,但PFHpA人体暴露量较高,需对其持续关注.Abstract: Integrated industrial park has dual functions of industrial and civil production, generating complex pollutants that are difficult to be treated comprehensively and may cause more extensive and serious impacts. Concentration levels and spatial distribution characteristics of 13 PFASs in Xinjin Industrial Park and the surrounding surface soil were studied. In the present study, 12 PFASs were detected with a mean concentration of 104.84 ng·g−1. PFHpA (mean value of 72.99 ng·g−1, 70%) and PFOA (29.25 ng·g−1, 28%) were the main PFASs. The Ordinary Kriging interpolation (OK) results showed that PFASs concentrations increased in the north direction of the park with a broad band distribution. Analysis of variance and principal component indicated that sources of PFASs contamination are mainly diffuse emissions and atmospheric deposition from PFHpA-related industrial production activities followed by the emission of daily use. The risk assessment analysis based on the CSOIL model displayed that the risk values of PFOA and PFOS in the region were at low level, but the human exposure to PFHpA is high and requires continuous attention.
-
Key words:
- PFASs /
- soil /
- industrial park /
- distribution characteristics /
- risk assessment.
-

-
表 1 目标物的结构信息和仪器参数设置
Table 1. Structural information of the target and instrument parameter settingst
类型
Type目标物
Objects缩写
Abb.结构式
Structure对应内标
Internal
standard母离子→
子离子(m/z)
Precursor→
Product保留
时间/min
Reservation
time碎裂电压/V
Fragmentor碰撞能/V
Collision
EnergyPFCA-MXB 全氟丁酸 PFBA F(CF2)3COOH MPFBA 213→169 2.91 60 5 全氟戊酸 PFPeA F(CF2)4COOH MPFHxA 263→219/69 4.09 60 5 全氟己酸 PFHxA F(CF2)5COOH MPFHxA 313→269/119 4.76 70 10 全氟庚酸 PFHpA F(CF2)6COOH MPFOA 363→319/169 5.21 70 5 全氟辛酸 PFOA F(CF2)7COOH MPFOA 413→369/169 5.56 80 10 全氟壬酸 PFNA F(CF2)8COOH MPFNA 463→419/219 5.84 80 10 全氟癸酸 PFDA F(CF2)9COOH MPFDA 513→469/269 6.07 90 5 全氟十一酸 PFUnDA F(CF2)10COOH MPFUnDA 563→519/269 6.27 90 10 全氟十二酸 PFDoDA F(CF2)11COOH MPFDoDA 613→569/319 6.44 90 10 PFSA-MXB 全氟丁烷磺酸 PFBS F(CF2)4SO3H MPFHxS 299→99/80 4.25 120 35 全氟己烷磺酸 PFHxS F(CF2)6SO3H MPFHxS 399→99/80 5.23 150 40 全氟辛烷磺酸 PFOS F(CF2)8SO3H MPFOS 499→99/80 5.82 170 50 全氟癸烷磺酸 PFDS F(CF2)10SO3H MPFOS 599→99/80 6.25 190 60 表 2 土壤中PFASs的回收率,方法检出限(MDL)和线性方程
Table 2. Recoveries, method detection limits (MDL) and linear equation of PFASs in soils
类别
Type目标物
Objects回收率/%
Recovery (Avg±SD)检出限/(ng·g−1)
MDL加标2 ng 加标20 ng PFCAs PFBA 71.4±1.6 71.6±1.5 0. 005 PFPeA 82.3±1.2 90.3±3.9 0. 036 PFHxA 76.0±0.3 88.6±1.0 0.008 PFHpA 97.7±1.6 96.3±3.9 0. 002 PFOA 67.1±2.7 82.9±1.1 0. 002 PFNA 69.2±2.9 83.4±1.3 0. 003 PFDA 95.1±5.4 93.9±3.3 0. 020 PFUnDA 70.9±1.3 82.7±0.5 0. 014 PFDoDA 94.0±2.0 88.6±3.7 0. 025 PFSAs PFBS 89.9±1.1 92.6±3.2 0. 005 PFHxS 80.1±7.9 95.5±1.5 0. 041 PFOS 93.4±1.7 95.1±3.5 0. 021 PFDS 90.0±2.2 81.2±4.4 0.029 表 3 研究区域土壤中PFASs的含量和检出率(ng·g−1)
Table 3. Concentration range and detection rate of PFASs in soils of the study area(ng·g−1)
点位
SitePFBA PFPeA PFBS PFHxA PFHpA PFHxS PFOA PFOS PFNA PFDA PFDS PFUnDA PFDoDA Σ12PFASs T1 0.21 nd nd 0.80 137.15 nd 45.34 0.46 0.14 0.10 nd 0.10 0.09 184.39 T2 0.20 nd nd 1.31 165.90 nd 56.87 0.35 0.11 0.09 nd 0.07 nd 225.00 T3 0.19 nd 0.24 0.62 102.06 nd 16.65 nd 0.07 0.08 nd 0.05 0.09 120.05 T4 0.26 nd 0.25 0.97 143.40 nd 51.12 1.08 0.56 0.64 nd 0.43 0.47 199.18 T5 0.27 nd nd 0.76 109.14 nd 18.35 0.41 0.26 0.19 nd 0.12 0.12 129.62 T6 0.21 nd nd 1.15 100.93 nd 12.03 0.24 0.13 0.10 nd 0.08 0.09 114.96 T7 0.11 nd nd 0.71 109.98 nd 13.72 0.28 0.11 0.10 nd 0.07 0.09 125.17 T8 0.44 nd 0.27 1.32 174.42 0.12 62.12 2.34 1.25 0.95 nd 1.13 0.58 244.94 T9 0.49 nd nd 0.26 15.71 nd 24.35 0.46 0.83 0.49 nd 0.65 0.32 43.56 T10 0.51 nd nd nd 20.80 nd 19.86 nd 0.38 nd nd nd nd 41.55 T11 0.33 0.10 0.97 0.12 10.84 nd 11.87 0.15 0.41 0.28 nd 0.17 nd 25.24 T12 0.75 nd nd 0.22 21.94 0.14 47.45 nd 0.34 0.23 nd 0.22 nd 71.29 T13 0.41 nd nd nd 11.91 nd 16.66 nd 0.24 0.22 nd 0.26 nd 29.70 T14 0.43 nd 0.88 0.25 11.45 nd 18.29 0.43 0.62 0.41 nd 0.39 nd 33.15 T15 0.27 nd nd 0.22 24.30 0.13 44.64 0.19 0.22 0.20 nd 0.15 nd 70.32 T16 0.35 nd 0.85 0.17 7.87 nd 8.62 0.25 0.34 0.34 nd 0.31 0.21 19.31 平均值 0.34 0.10 0.58 0.63 72.99 0.13 29.25 0.55 0.38 0.29 nd 0.28 0.23 104.84 检出率/% 100 12.50 37.50 87.50 100 18.80 100 75.00 100 93.80 0 93.80 56.30 — 表 4 各PFASs的相关性矩阵,特征值和贡献率
Table 4. Correlation matrix R for each PFASs, eigenvalues and contribution rates
PFASs PFBA PFHxA PFHpA PFOA PFOS PFNA PFDA PFUnDA PFDoDA 特征值
Eigenvalue方差贡献率/%
Variance
contribution
rate累计贡献率/%
Cumulative
contribution
ratePFBA 1.000 5.106 56.728 56.728 PFHxA −0.496 1.000 2.517 27.969 84.697 PFHpA −0.534* 0.945** 1.000 0.828 9.195 93.891 PFOA 0.140 0.509* 0.556* 1.000 0.223 2.475 96.366 PFOS 0.101 0.599* 0.587* 0.580* 1.000 0.160 1.781 98.148 PFNA 0.482 0.085 0.029 0.335 0.786** 1.000 0.073 0.814 98.962 PFDA 0.279 0.244 0.190 0.421 0.863** 0.908** 1.000 0.041 0.457 99.419 PFUnDA 0.358 0.219 0.156 0.402 0.849** 0.944** 0.953** 1.000 0.034 0.374 99.793 PFDoDA 0.013 0.470 0.464 0.393 0.861** 0.736** 0.852** 0.814** 1.000 0.019 0.207 100.000 注:*P<0.05, **P<0.01. 表 5 CSOIL模型定量计算公式及暴露参数
Table 5. CSOIL model quantitative calculation formula and exposure parameters
暴露途径
Exposure pathways计算公式
Calculation formula参数意义
Parameter暴露参数
Exposure parameters儿童
Children成人
Adults食入土壤颗粒 DI1=AID×ωs×Fa/BW AID:土颗粒食入量,mg·d−1 200 100 ωs:污染物含量,mg·kg−1 Fa:吸收因子 0.5 0.6 BW:人体平均体重,kg 20.76 58.55 吸入土壤颗粒 DI1=ωs×ITSP×Fr×Fa/BW ITSP:土壤颗粒的吸入量,kg·d−1 3.13·10−7 [41] 8.33·10−7 [41] Fr:肺部保持因子 0.75 0.75 DI1=ωs×AEXPi×Fm×DAEi×DAR×TBi×
FRSi×Fa/BWAEXPi:暴露表面皮肤面积,m2 0.05 0.09 Fm:基质因子的皮肤吸收 0.15 0.15 DAEi:皮肤覆盖程度,kg soil·m−2 5.6·10-4 [41] 5.6·10-4 [41] DAR:皮肤吸收速度,h−1 0.01 0.005 TBi:接触土壤暴露时间,h·d−1 9.14 14.9 FRSi:室内土颗粒质量分数 0.8 0.8 环境暴露含量 EDIx=DIx1+DIx2+DIx3 DI为暴露量,ng·(kg·d)−1 EDI为环境暴露量,x表示不同种类的PFAS 表 6 国际管理机构提议的每日预计摄入量健康指导值(ng·(kg·d)−1)
Table 6. Health guidance values for expected daily intake as proposed by international regulatory agencies(ng·(kg·d)−1)
-
[1] BUCK R C, FRANKLIN J, BERGER U, et al. Perfluoroalkyl and polyfluoroalkyl substances in the environment: Terminology, classification, and origins[J]. Integrated Environmental Assessment and Management, 2011, 7(4): 513-541. doi: 10.1002/ieam.258 [2] HUA Z L, YU L, LIU X D, et al. Perfluoroalkyl acids in surface sediments from the Lower Yangtze River: Occurrence, distribution, sources, inventory, and risk assessment[J]. Science of the Total Environment, 2021, 798: 149332. doi: 10.1016/j.scitotenv.2021.149332 [3] FANG S H, LI C, ZHU L Y, et al. Spatiotemporal distribution and isomer profiles of perfluoroalkyl acids in airborne particulate matter in Chengdu City, China[J]. Science of the Total Environment, 2019, 689: 1235-1243. doi: 10.1016/j.scitotenv.2019.06.498 [4] GLÜGE J, SCHERINGER M, COUSINS I T, et al. An overview of the uses of per- and polyfluoroalkyl substances (PFAS)[J]. Environmental Science Processes & Impacts, 2020, 22(12): 2345-2373. [5] HU X Z, HU D C. Effects of perfluorooctanoate and perfluorooctane sulfonate exposure on hepatoma Hep G2 cells[J]. Archives of Toxicology, 2009, 83(9): 851-861. doi: 10.1007/s00204-009-0441-z [6] CAI M H, ZHAO Z, YANG H Z, et al. Spatial distribution of per- and polyfluoroalkyl compounds in coastal waters from the East to South China Sea[J]. Environmental Pollution, 2012, 161: 162-169. doi: 10.1016/j.envpol.2011.09.045 [7] LI J F, HE J H, NIU Z G, et al. Legacy per- and polyfluoroalkyl substances (PFASs) and alternatives (short-chain analogues, F-53B, GenX and FC-98) in residential soils of China: Present implications of replacing legacy PFASs[J]. Environment International, 2020, 135: 105419. doi: 10.1016/j.envint.2019.105419 [8] WANG Z Y, COUSINS I T, SCHERINGER M, et al. Fluorinated alternatives to long-chain perfluoroalkyl carboxylic acids (PFCAs), perfluoroalkane sulfonic acids (PFSAs) and their potential precursors[J]. Environment International, 2013, 60: 242-248. doi: 10.1016/j.envint.2013.08.021 [9] 丁达, 宋昕, 刘朝阳, 等. 某化工园区周边土壤中传统和新兴全氟化合物的赋存特征及潜在来源[J]. 土壤, 2021, 53(4): 779-787. DING D, SONG X, LIU Z Y, et al. Occurrence and possible source of legacy and emerging perfluoroalkyl substances in soil near a chemical industrial park[J]. Soils, 2021, 53(4): 779-787 (in Chinese).
[10] 温祥洁, 陈朝辉, 徐维新, 等. 青藏高原东北部地区表层土壤中全氟化合物的分布特征及来源解析[J]. 环境科学, 2022, 43(6): 3253-3261. WEN X J, CHEN Z H, XU W X, et al. Distribution characteristics and source apportionment of perfluoroalkyl substances in surface soils of the northeast Tibetan Plateau[J]. Environmental Science, 2022, 43(6): 3253-3261 (in Chinese).
[11] 谭少军, 刘洋, 朱小婕, 等. 长江上游平原丘陵区农业非点源污染输出特征和驱动机制[J]. 环境科学, 2022, 43(6): 3128-3139. TAN S J, LIU Y, ZHU X J, et al. Output characteristics and driving mechanism of agricultural non-point source (AGNPS) pollutant in plain and valley region of Upper Yangtze River, China[J]. Environmental Science, 2022, 43(6): 3128-3139 (in Chinese).
[12] 李杰, 翟亮, 桑会勇, 等. PM2.5浓度插值中不同空间插值方法对比[J]. 测绘科学, 2016, 41(4): 50-54, 101. LI J, ZHAI L, SANG H Y, et al. Comparison of different spatial interpolation methods for PM2.5[J]. Science of Surveying and Mapping, 2016, 41(4): 50-54, 101 (in Chinese).
[13] BRUSSEAU M L, ANDERSON R H, GUO B. PFAS concentrations in soils: Background levels versus contaminated sites[J]. Science of the Total Environment, 2020, 740: 140017. doi: 10.1016/j.scitotenv.2020.140017 [14] LIU Z Y, LU Y L, SHI Y J, et al. Crop bioaccumulation and human exposure of perfluoroalkyl acids through multi-media transport from a mega fluorochemical industrial park, China[J]. Environment International, 2017, 106: 37-47. doi: 10.1016/j.envint.2017.05.014 [15] 高燕, 傅建捷, 王亚韡, 等. 全氟化工厂土芯中全氟化合物的分布规律[J]. 环境化学, 2014, 33(10): 1686-1691. doi: 10.7524/j.issn.0254-6108.2014.10.006 GAO Y, FU J J, WANG Y W, et al. Spatial and vertical distribution of perfluoroalkyl substances in soil cores around manufacturing facilities in China[J]. Environmental Chemistry, 2014, 33(10): 1686-1691 (in Chinese). doi: 10.7524/j.issn.0254-6108.2014.10.006
[16] ZHANG G Z, PAN Z K, WU Y M, et al. Distribution of perfluorinated compounds in surface water and soil in partial areas of Shandong Province, China[J]. Soil and Sediment Contamination: an International Journal, 2019, 28(5): 502-512. doi: 10.1080/15320383.2019.1635079 [17] 郑宇, 路国慧, 邵鹏威, 等. 青藏高原东部过渡区水环境中全氟化合物的分布特征[J]. 环境化学, 2020, 39(5): 1192-1201. doi: 10.7524/j.issn.0254-6108.2019081506 ZHENG Y, LU G H, SHAO P W, et al. Level and distribution of perfluorinated compounds in snow and water samples from the transition zone in eastern Qinghai-Tibet[J]. Environmental Chemistry, 2020, 39(5): 1192-1201 (in Chinese). doi: 10.7524/j.issn.0254-6108.2019081506
[18] JIN H B, SHAN G Q, ZHU L Y, et al. Perfluoroalkyl acids including isomers in tree barks from a Chinese fluorochemical manufacturing park: Implication for airborne transportation[J]. Environmental Science & Technology, 2018, 52(4): 2016-2024. [19] ZHAO N, ZHAO M R, LIU W P, et al. Atmospheric particulate represents a source of C8-C12 perfluoroalkyl carboxylates and 10: 2 fluorotelomer alcohol in tree bark[J]. Environmental Pollution, 2021, 273: 116475. doi: 10.1016/j.envpol.2021.116475 [20] 武倩倩, 吴强, 宋帅, 等. 天津市主要河流和土壤中全氟化合物空间分布、来源及风险评价[J]. 环境科学, 2021, 42(8): 3682-3694. WU Q Q, WU Q, SONG S, et al. Distribution, sources, and risk assessment of polyfluoroalkyl substances in main rivers and soils of Tianjin[J]. Environmental Science, 2021, 42(8): 3682-3694 (in Chinese).
[21] 何宗健, 甘甜, 彭希珑, 等. 环鄱阳湖城市污水处理厂污泥中全氟化合物的污染特征[J]. 南昌大学学报(工科版), 2020, 42(2): 103-108. HE Z J, GAN T, PENG X L, et al. Pollution characteristics of perfluorinated compounds in sludge from urban wastewater treatment plants around Poyang Lake[J]. Journal of Nanchang University (Engineering & Technology), 2020, 42(2): 103-108 (in Chinese).
[22] LIN Y, JIANG J J, RODENBURG L A, et al. Perfluoroalkyl substances in sediments from the Bering Sea to the western Arctic: Source and pathway analysis[J]. Environment International, 2020, 139: 105699. doi: 10.1016/j.envint.2020.105699 [23] 曾士宜, 杨鸿波, 彭洁, 等. 贵州草海湖泊表层水与沉积物中全氟化合物的污染特征及风险评估[J]. 环境化学, 2021, 40(4): 1193-1205. doi: 10.7524/j.issn.0254-6108.2020072404 ZENG S Y, YANG H B, PENG J, et al. Pollution characteristics and risk assessment of perfluorinated compounds in surface water and sediments of Caohai Lake of Guizhou Province[J]. Environmental Chemistry, 2021, 40(4): 1193-1205 (in Chinese). doi: 10.7524/j.issn.0254-6108.2020072404
[24] NA S T, HAI R T, WANG X H, et al. Trends and levels of perfluorinated compounds in soil and sediment surrounding a cluster of metal plating industries[J]. Soil and Sediment Contamination: An International Journal, 2021, 30(4): 423-435. doi: 10.1080/15320383.2020.1863908 [25] FANG S H, SHA B, YIN H L, et al. Environment occurrence of perfluoroalkyl acids and associated human health risks near a major fluorochemical manufacturing park in southwest of China[J]. Journal of Hazardous Materials, 2020, 396: 122617. doi: 10.1016/j.jhazmat.2020.122617 [26] 孙慧, 郭治兴, 郭颖, 等. 广东省土壤Cd含量空间分布预测[J]. 环境科学, 2017, 38(5): 2111-2124. SUN H, GUO Z X, GUO Y, et al. Prediction of distribution of soil Cd concentrations in Guangdong Province, China[J]. Environmental Science, 2017, 38(5): 2111-2124 (in Chinese).
[27] 王菲, 吴泉源, 吕建树, 等. 山东省典型金矿区土壤重金属空间特征分析与环境风险评估[J]. 环境科学, 2016, 37(8): 3144-3150. WANG F, WU Q Y, LÜ J S, et al. Spatial characteristics and environmental risk of heavy metals in typical gold mining area of Shandong Province[J]. Environmental Science, 2016, 37(8): 3144-3150 (in Chinese).
[28] 白一茹, 张兴, 赵云鹏, 等. 基于GIS和受体模型的枸杞地土壤重金属空间分布特征及来源解析[J]. 环境科学, 2019, 40(6): 2885-2894. BAI Y R, ZHANG X, ZHAO Y P, et al. Spatial distribution characteristics and source apportionment of soil heavy metals in Chinese wolfberry land based on GIS and the receptor model[J]. Environmental Science, 2019, 40(6): 2885-2894 (in Chinese).
[29] 叶冬芬, 叶桥龙, 罗玮琛. 基于高斯扩散模型的化工危险品泄露区域计算及其实现[J]. 计算机与应用化学, 2012, 29(2): 195-199. doi: 10.3969/j.issn.1001-4160.2012.02.016 YE D F, YE Q L, LUO W C. A calculation approach and implementation of hazard chemical substance based on Gaussian diffusion model[J]. Computers and Applied Chemistry, 2012, 29(2): 195-199 (in Chinese). doi: 10.3969/j.issn.1001-4160.2012.02.016
[30] 倪健, 王占益. 基于高斯模型的城市大气污染物溯源模拟[J]. 电脑知识与技术, 2021, 17(29): 8-11. NI J, WANG Z Y. Simulation of air pollution dispersion in Handan city based on Gaussian model[J]. Computer Knowledge and Technology, 2021, 17(29): 8-11 (in Chinese).
[31] SINI J F, ANQUETIN S, MESTAYER P G. Pollutant dispersion and thermal effects in urban street canyons[J]. Atmospheric Environment, 1996, 30(15): 2659-2677. doi: 10.1016/1352-2310(95)00321-5 [32] 周广峰, 刘欣. 主成分分析法在水环境质量评价中的应用进展[J]. 环境科学导刊, 2011, 30(1): 75-78. doi: 10.3969/j.issn.1673-9655.2011.01.021 ZHOU G F, LIU X. Progress of principal component analysis method in water quality assessment[J]. Environmental Science Survey, 2011, 30(1): 75-78 (in Chinese). doi: 10.3969/j.issn.1673-9655.2011.01.021
[33] 于林松, 万方, 范海印, 等. 姜湖贡米产地土壤重金属空间分布、源解析及生态风险评价[J]. 环境科学, 2022, 43(8): 4199-4211. YU L S, WAN F, FAN H Y, et al. Spatial distribution, source apportionment, and ecological risk assessment of soil heavy metals in jianghugongmi producing area, Shandong Province[J]. Environmental Science, 2022, 43(8): 4199-4211 (in Chinese).
[34] 陈志凡, 化艳旭, 徐薇, 等. 基于正定矩阵因子分析模型的城郊农田重金属污染源解析[J]. 环境科学学报, 2020, 40(1): 276-283. doi: 10.13671/j.hjkxxb.2019.0380 CHEN Z F, HUA Y X, XU W, et al. Analysis of heavy metal pollution sources in suburban farmland based on positive definite matrix factor model[J]. Acta Scientiae Circumstantiae, 2020, 40(1): 276-283 (in Chinese). doi: 10.13671/j.hjkxxb.2019.0380
[35] SUN R, WU M H, TANG L, et al. Perfluorinated compounds in surface waters of Shanghai, China: Source analysis and risk assessment[J]. Ecotoxicology and Environmental Safety, 2018, 149: 88-95. doi: 10.1016/j.ecoenv.2017.11.012 [36] 刘宝林, 张鸿, 谢刘伟, 等. 东江流域表层土中全氟化合物的空间分布及来源解析[J]. 地球与环境, 2015, 43(3): 302-307. LIU B L, ZHANG H, XIE L W, et al. Spatial distribution and source of perfluorinated compounds in surface soils around the Dongjiang River[J]. Earth and Environment, 2015, 43(3): 302-307 (in Chinese).
[37] LIU W X, HE W, QIN N, et al. Temporal-spatial distributions and ecological risks of perfluoroalkyl acids (PFAAs) in the surface water from the fifth-largest freshwater lake in China (Lake Chaohu)[J]. Environmental Pollution, 2015, 200: 24-34. doi: 10.1016/j.envpol.2015.01.028 [38] OECD Guideline for the testing of chemicals, Section 1: adsorption-desorption using a batch equilibrium method [R]. Organization for Economic Co-operation and Development, 2000. [39] ZHONG H F, ZHENG M G, LIANG Y, et al. Legacy and emerging per- and polyfluoroalkyl substances (PFAS) in sediments from the East China Sea and the Yellow Sea: Occurrence, source apportionment and environmental risk assessment[J]. Chemosphere, 2021, 282: 131042. doi: 10.1016/j.chemosphere.2021.131042 [40] 王宗爽, 段小丽, 刘平, 等. 环境健康风险评价中我国居民暴露参数探讨[J]. 环境科学研究, 2009, 22(10): 1164-1170. WANG Z S, DUAN X L, LIU P, et al. Human exposure factors of Chinese people in environmental health risk assessment[J]. Research of Environmental Sciences, 2009, 22(10): 1164-1170 (in Chinese).
[41] BRAND E, OTTE P F, LIJZEN J P A, et al. CSOIL 2000 an exposure model for human risk assesment of soil contamination. A model description[R]. Bilthoven: National Institute of Public Health and the Environmen, 2007. [42] 宋从波, 刘茂, 姜珊珊, 等. 基于CSOIL模型的村镇土壤重金属人体暴露风险评估[J]. 安全与环境学报, 2014, 14(1): 248-252. SONG C B, LIU M, JIANG S S, et al. Assessment research on the human exposure risk to heavy metal pollutants from the soil in rural areas based on CSOIL[J]. Journal of Safety and Environment, 2014, 14(1): 248-252 (in Chinese).
[43] KNUTSEN H K, ALEXANDER J, et al. Risk to human health related to the presence of perfluorooctane sulfonic acid and perfluorooctanoic acid in food[J]. EFSA Journal, 2018, 16(12): 5194. [44] Food Standards Australia and New Zealand. Hazard assessment report - perfluorooctane sulfonate (PFOS), perfluorooctanoic acid (PFOA), perfluorohexane sulfonate (PFHxS) [R]. 2017. [45] Danish Environmental Protection Agency. Perfluoroalkylated substances: PFOA, PFOS and PFOSA. evaluation of health hazards and proposal of a health-based quality criterion for drinking water, soil and ground water [R]. 2015. [46] Minnesota Department of Health. Toxicological summary for: Perfluorooctanoate[R]. Minnesota, USA: Minnesota Department of Health, 2018a. [47] Minnesota Department of Health. Toxicological summary for: Perfluorobutanoate [R]. Minnesota, USA: Minnesota Department of Health, 2018b. [48] Minnesota Department of Health. Toxicological summary for: Perfluorooctane sulfonate [R]. Minnesota, USA: Minnesota Department of Health, 2019. [49] USEPA. Technical fact sheet – perfluorooctane sulfonate (PFOS) and perfluorooctanoic acid (PFOA) [R]. United States Environmental Protection Agency, 2017. -


 下载:
下载:


