-
温泉经常出现在世界各地活跃的火山地区,被认为是地热流体在地表的表现形式[1]. 同时,温泉水作为一种新型、宝贵的水资源,通常含有一些特殊的化学成分和对人类产生理疗作用的微量元素[2]. 在大多数地方,它们被用来洗浴和浴疗. 在一些干旱和半干旱地区,由于水资源的紧缺,温泉水被作为饮用水和家庭用水的主要来源[3]. 由于地热水在高温高压环境中发生强烈的水岩反应,相比于普通地下水,地热温泉中含有较多的氟化物、砷、镉和其他重金属元素,通常超出WHO安全指南规定的饮用水最大允许限度(F<1.5 mg·L−1,As<0.01 mg·L−1). 我国羊八井地热水中F和As的含量高达19.6 mg·L−1和5.7 mg·L−1[4] ,腾冲Rehai地热水中F浓度为1.52—18.3 mg·L−1[5];美国黄石公园地热泉中F浓度高达50 mg·L−1,As平均浓度达到2.47 mg·L−1,其余重金属元素也超标明显,污染了周围河流[6 − 7]. 这些世界上典型热泉中有害元素、重金属元素含量远远超过正常值,对周围环境造成严重污染. 如果人们直接使用这些温泉水或受地热水影响的地表水、地下水,将会给生产生活带来风险并对人体健康产生极大危害. 因此,研究温泉水中有害元素和重金属元素的地球化学特征,并进行温泉环境评价显得尤为重要.
目前,常用的水质评价方法有单因子指数法、人工神经网络法、水质综合指数法(WQI)等[8]. 水质综合指数法最早由Horton提出,相比其他方法,WQI是以多种水质指标综合的无量纲数,可综合反映水环境质量状况,已被广泛用于水环境质量评价[9]. 例如,在印度的Unai地区[10],西孟加拉邦地区[3],巴基斯坦Skardu地区[11],利用WQI指数法对当地的温泉水进行水质评估,确定了适宜的饮用水,为当地居民的生活用水提供了可行性建议;青藏高原河流作为亚洲水塔为当地和周边地区的十多亿居民提供了用水资源,WQI指数显示青藏高原河流水质较为原始,大部分有害元素和重金属元素未超标,仅有个别河流有一些潜在的重金属风险,给当地居民的生活用水提供了科学保障[12].
福建地区位于中国东南沿海地热带,全境温泉出露众多,大多都产于与花岗岩有关的断裂、裂隙系统中,以中低温热水系统为主[13 − 14]. 当地居民经常利用温泉洗浴并将它作为生活用水. 前人应用水文地球化学方法对漳州、厦门等地方地热水水化学特征,福建地区典型温泉成因以及水位水温对于地震的同震响应等方面做了较为详细的研究[15 − 17]. 但对温泉水中有害元素的地球化学特征及温泉水质情况鲜有报道. 本文将利用在福建地区断裂带附近采集的温泉水样,运用水文地球化学和统计方法,追溯温泉水中有害元素的来源,分析形成机理及影响因素,科学评价温泉水的质量状况,为温泉开发利用提供新的环境地球化学资料.
-
研究区位于北纬23°—27°, 东经115°—120°之间,盛行温暖湿润的亚热带季风气候,热量丰富,雨量丰富,年平均降雨量为1400—2000 mm,年平均蒸发量200—1500 mm[18]. 境内地表水含量丰富,溪流密布. 河谷和沿海平原地下水类型以松散岩孔隙水为主,含水岩性主要为砂土和海相黏土;基岩裂隙水发育在花岗岩、火山岩和火山熔岩中,主要分布在山区和高丘陵地区;东部低丘陵和红土台地区以风化带孔隙裂隙水为主,含水岩性主要为亚砂土或黏土[19],其补给来源主要为大气降水和地表水.
福建地区从构造分析位于中国东南沿海的武夷—戴云龙褶皱带[20]. 晚侏罗纪以来,发生了大规模的中酸性火山喷发和燕山期岩浆侵入,发育了玄武岩、安山岩等火山岩和花岗岩为主的侵入岩[21]. 中酸性岩浆岩富含U、Th等放射性元素,是研究区热水的主要热量来源之一[22]. 新生代以来该地区主要以剥蚀、压扁和风化为特征,断陷盆地内堆积了第三系—第四纪陆相沉积地层,沿海地区覆盖海相和陆相软土沉积[23]. 区域内断裂发育,对地热水出露有显著控制作用. 主要有长乐—诏安断裂带,政和—海丰断裂带,邵武—河源断裂带三条主要活动断裂带,这些断裂均向NNE向展布(图1). 区域内还分布各种次级断裂,断裂之间相互交错. 在断裂带区域,岩层破碎强烈,其赋水性和导水性良好,为地热水上升提供了有利的通道.
本文采集的温泉水样多数分布在长乐—诏安断裂带中部,受主断裂带控制明显. 其余区域温泉水样点分布稀疏,但都受到区域内断裂控制. 从花岗岩中出露的温泉占大多数,其次是火山岩、沉积岩. 但大部分温泉由第四系覆盖层中出露,少数直接从基岩裂隙中出露. 温泉水温一般较高,多在40℃以上. 不同地域温泉流量差别较大,福州地区温泉流量普遍较高[24],贵安温泉井流量可达到7000 m3·d−1;漳州地区温泉流量最低可到86.4 m3·d−1,最高大于3456 m3·d−1,汤坑温泉流量可达到4000 m3·d−1[25].
-
本次实验数据来自在福建断裂带附近温泉采集的30个温泉水样,检测了主量、微量元素. 样品收集后在30 d内完成检测. 样品使用250 mL容积聚乙烯瓶采集,用HNO3酸化至pH<2,并保存温度在4 °C直至实验室分析. 野外现场测定温泉水的温度和pH值. 检测仪器采用Wagtech CP1000便携式水质测试套件设备,测量精度分别为0.1 ℃和0.01 pH单位. 主量元素的测定在中国地震局地震预测研究所重点实验室完成,使用的仪器为Dionex ICS-900离子色谱仪和AS40自动进样器,检测限为0.01 mg·L−1[26]. HCO3−和CO32−浓度使用ZDJ-3D型电位滴定仪通过标准滴定程序进行测量. 微量元素的分析是在核工业地质研究所测试中心使用元素型电感耦合等离子体质谱仪ICP-MS完成的[27]. 砷元素浓度使用LC-6500原子荧光光度计测定,检测限为0.60 μg·L−1. 在测量每批水样之前测定标准样品,测量偏差在±2‰以内,离子平衡(ib)计算公式为:
本次采集的温泉水样中,29个水样参与分析. 22号水样平衡误差达到8.7%,数据不理想不参与分析. 参与分析的水样中,21号水样平衡误差为5.6%,23号水样平衡误差为5.5%,其主要可能的原因:海水入侵使水样中部分阴阳离子浓度较高或样品采集分析中产生的误差. 误差在本文分析接受范围内. 其余水样平衡相对误差均低于±5%.
-
水质评价采用水质综合指数法(WQI),该方法将各种水质参数整合成一个可以代表整体水质的无纲量数,可综合反映水质情况. 指数计算公式为:
式中,Ci是第i种参评元素的浓度,Qi是第i种参评元素的水质标准的极限值,n为参评元素数量. WQI指数包括4类:1类(WQI≤1,几乎未受污染);2类(1<WQI≤2,轻度污染);3类(2<WQI≤3,中度污染);4类(WQI>3,重度污染)[28]. 为了防止个别元素空间异常对整体水质评价的影响,将参评元素在每个水样中浓度用单因子指数做出评价[29],单因子评价法根据水环境功能区,将水质分为Ⅰ—Ⅴ五类. 在此基础上,采用WQI综合水质指数法进行环境评价. 水质评价均参照国家标准《生活饮用水卫生标准》(GB 5749—2022)和《地下水质量标准》(GB/T 14848—2017)规定的Ⅲ类标准.
-
研究区所采集的温泉水样的水化学组分见表1. 温泉水出露温度变化范围为25—90 ℃;pH值变化范围为7.01—8.23,平均值为7.77,表明温泉水为弱碱性水;TDS为186.3—5171.6 mg·L−1,平均值为805.6 mg·L−1. 其中26号漳浦井水样属于微咸水,21号清温泉水样和23号港尾大桶温泉水样属于咸水. 这几个温泉点靠近大海,海水入侵会导致温泉水中含有更多的溶解物质,其余温泉水样为淡水. 阳离子以Na+为主,平均值为217.58 mg·L−1,阴离子以HCO3−和SO42−为主,平均值分别为211.86 mg·L−1,118.68 mg·L−1. F−浓度变化范围为1.96—19.75 mg·L−1.
相关性分析常用来分析地下水组分来源及成因类型[31]. 研究区温泉水样中水化学组分相关性见图2. 从图2看出温泉水中Na+、K+、Ca2+、Cl−与TDS呈显著正相关,说明上述离子对研究区温泉水中TDS含量贡献较大. Cl−分别与Na+、K+、Ca2+有着显著正相关关系,表明Cl−与Na+、K+、Ca2+有共同的来源,可能来源于盐岩或硅酸盐矿物的溶解. Mg2+与SO42−呈正相关关系,可能来源于硫酸盐矿物的溶解.
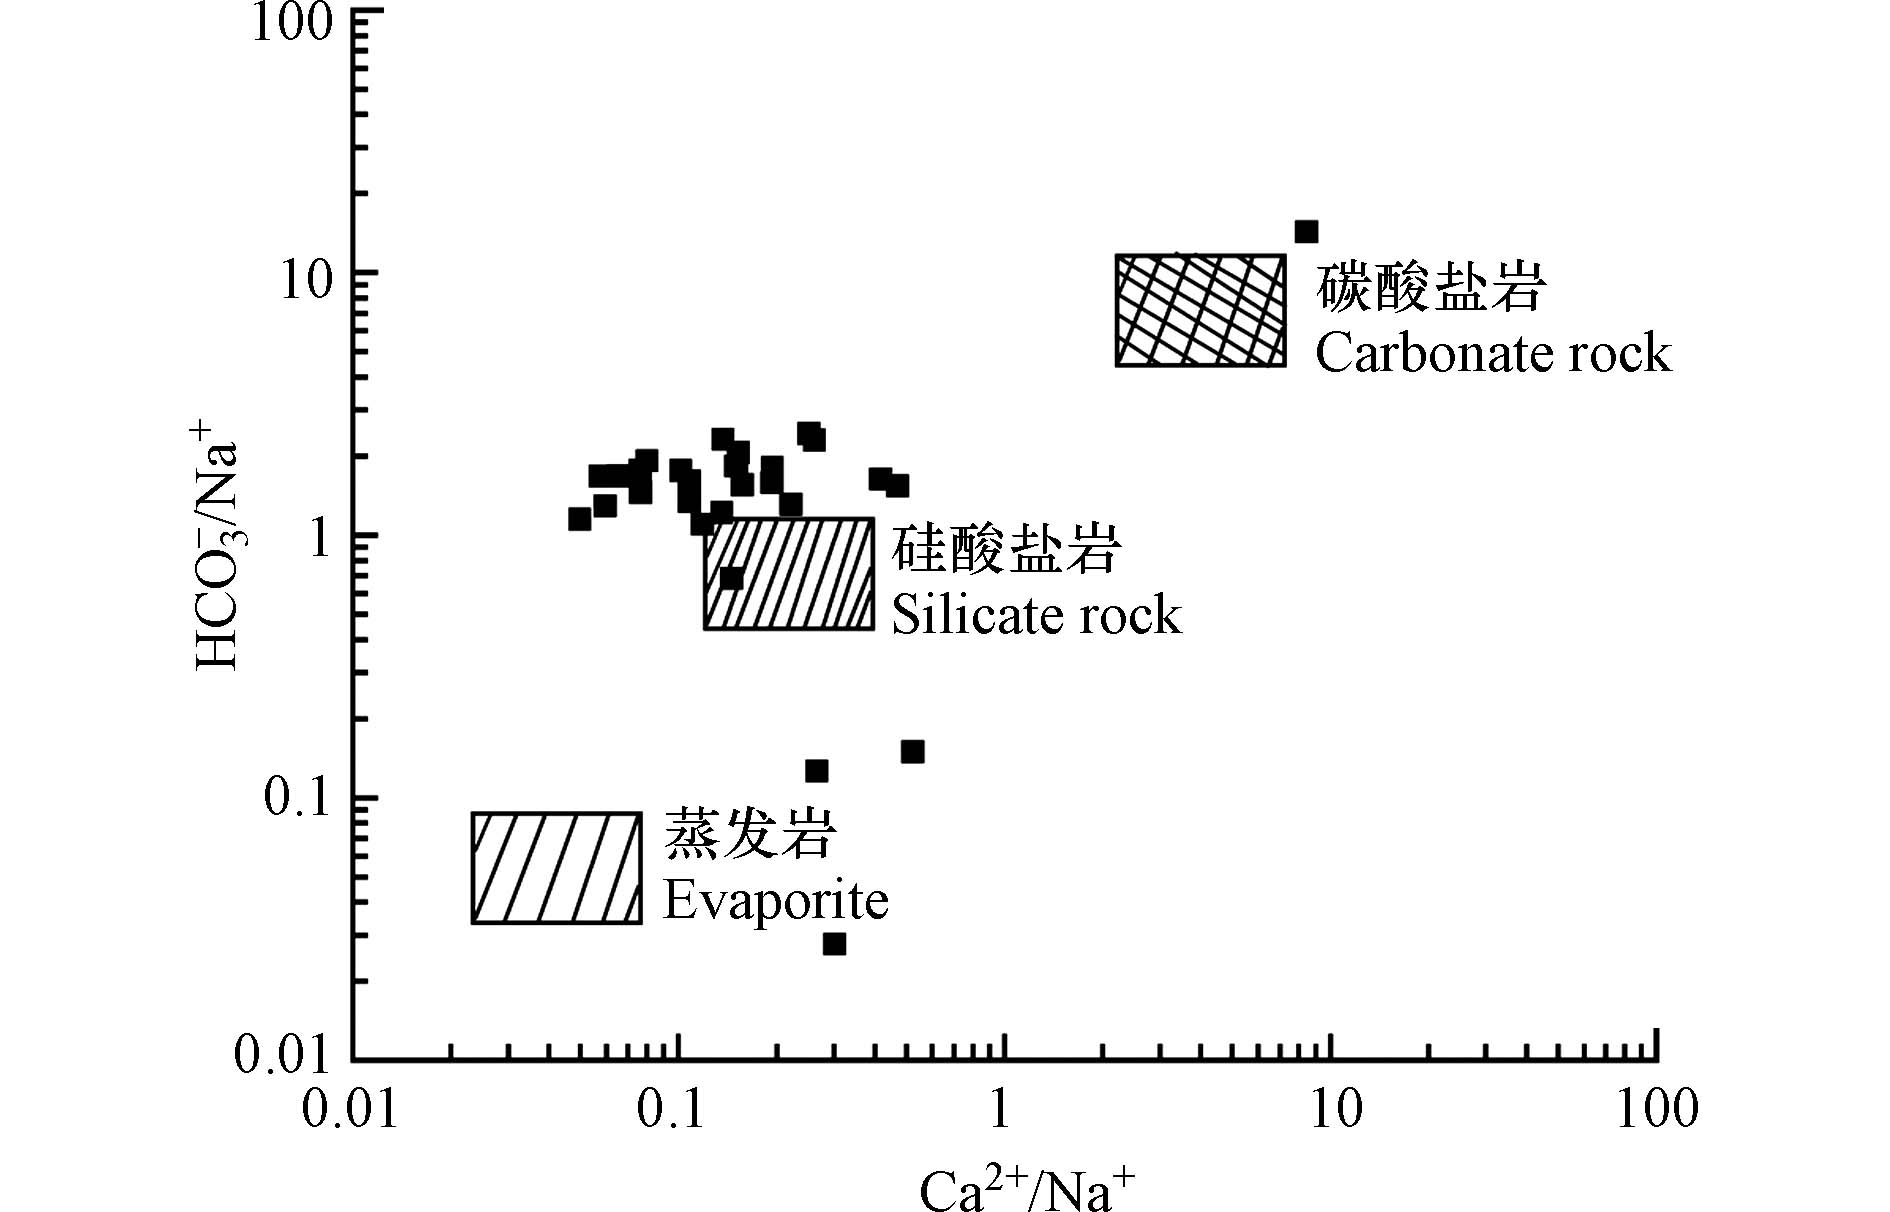
已有研究表明HCO3−/Na+与Ca2+/Na+关系图可分析不同岩石类型对地下水水化学演化过程的影响[32]. 由图3可知,研究区水样点大多分布在硅酸盐岩和碳酸盐岩端元之间,位于硅酸盐岩与蒸发岩端元间水样点较少,表明研究区温泉水离子组分主要来源于硅酸盐矿物的水解,这与研究区温泉点大都发育在中生代花岗岩相一致. 蒸发岩与碳酸盐岩矿物的水解对温泉水化学组成也有一定的贡献.
-
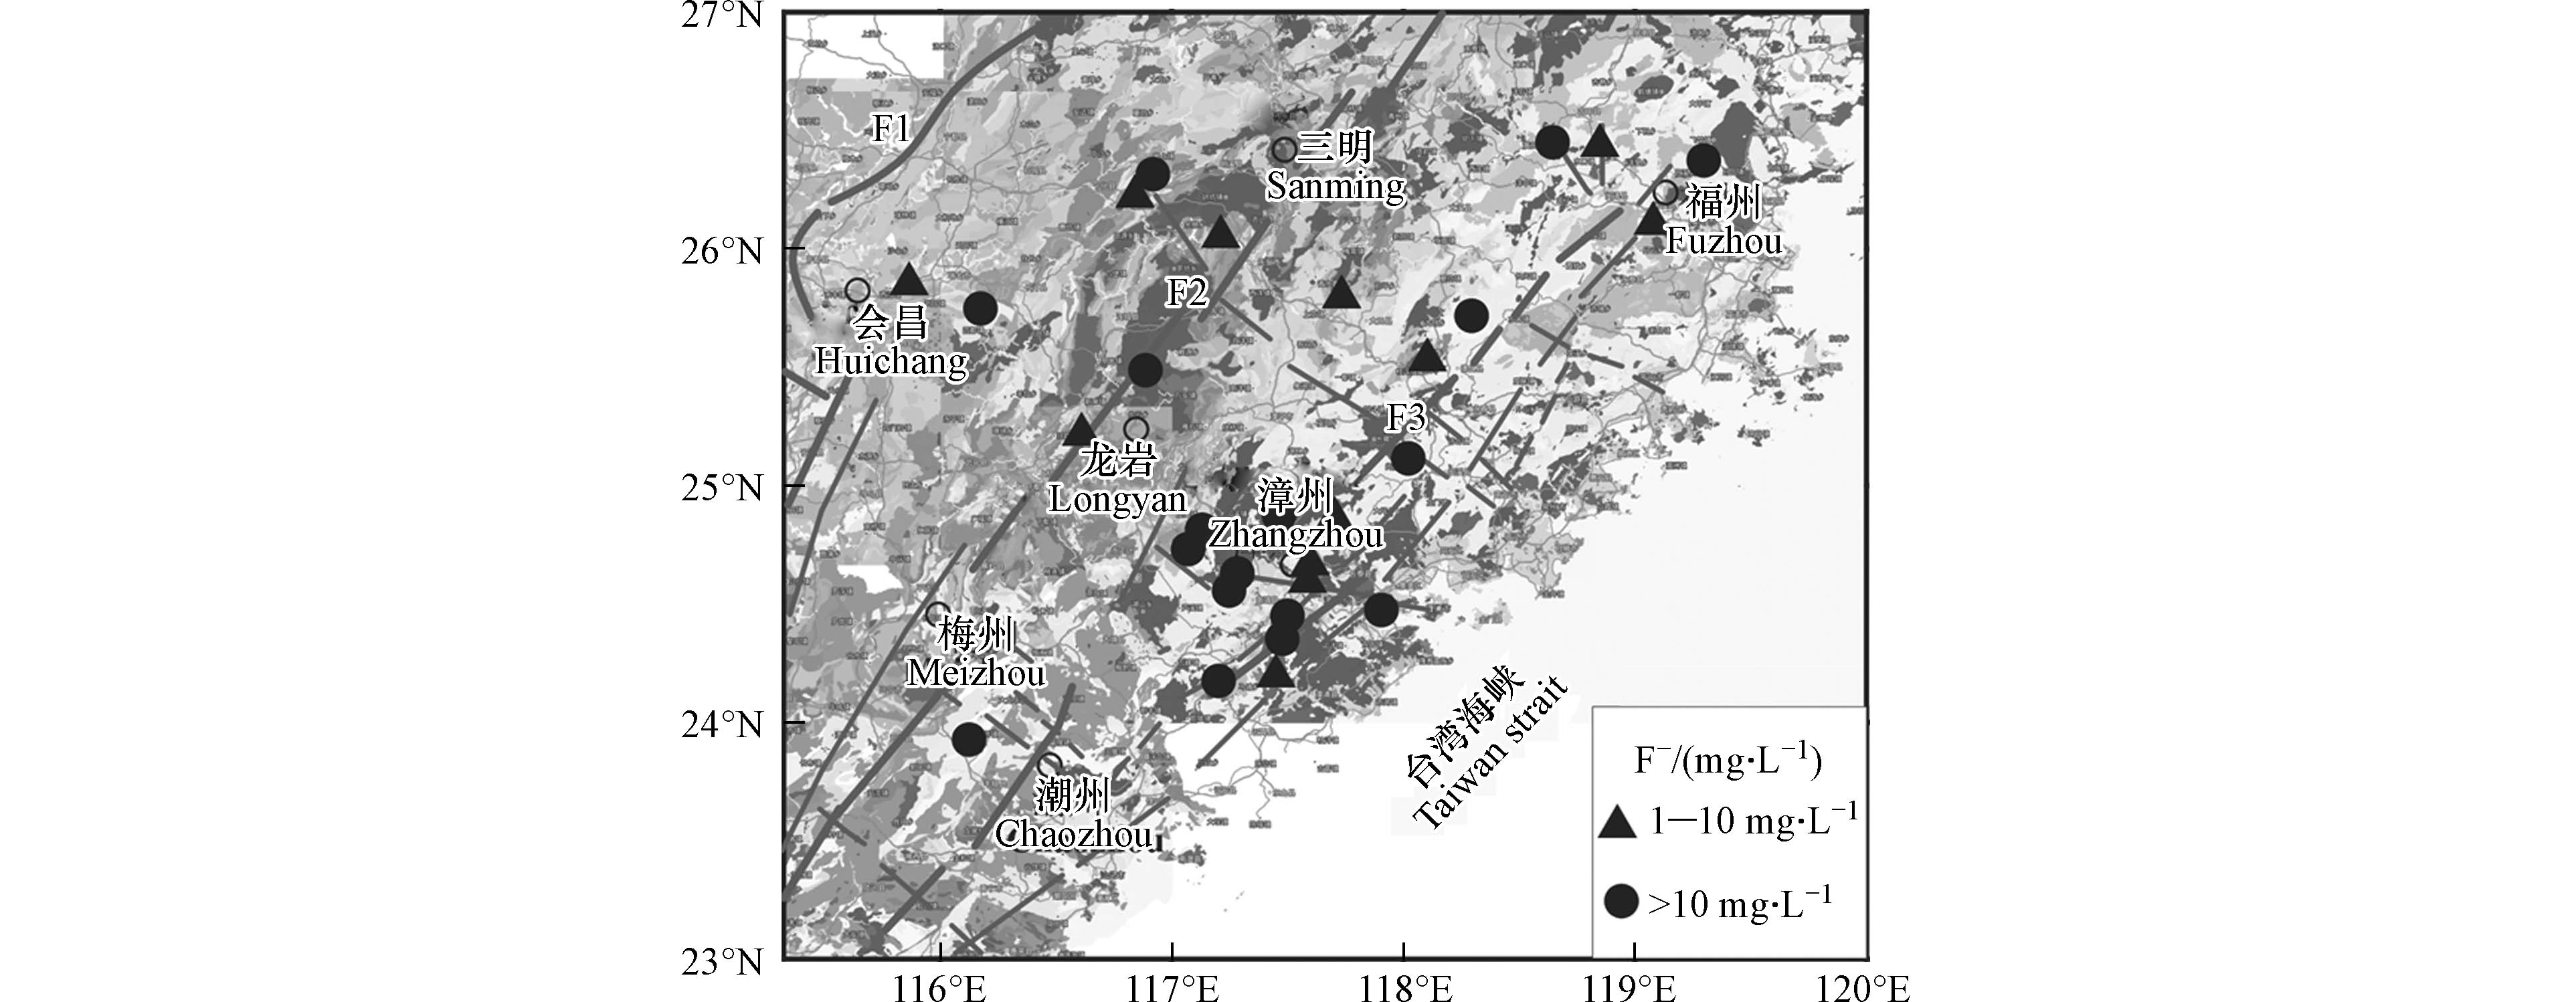
研究区温泉水中F−浓度普遍较高,平均值为9.32 mg·L−1,高于《生活饮用水卫生标准》(GB 5749—2022)规定的标准(<1 mg·L−1). 位于沿海区域温泉水中F−浓度普遍高于内陆地区(图4),福州、漳州地区温泉水中F−浓度大都超过10 mg·L−1. 研究区东南部平原是地下水流通和排泄的主要区域,这种低海拔和地下水循环流动情况可能促进温泉水中氟的富集. 并且沿海平原地区蒸发作用强烈,蒸发量大,蒸发浓缩也可能会导致温泉水中F−浓度过高.
自然条件下,温泉水中氟主要来源于地下围岩中的含氟矿物[33]. 研究区内中生代砂岩、砾岩、花岗岩和火山岩等大量分布,其含有的云母、萤石、磷灰石等含氟矿物,为研究区温泉水中氟的富集提供了物质来源. 沿海地区海相沉积物以粉砂、粘土为主,在水的作用下,含氟矿物通过溶滤作用进入温泉水,是高氟温泉水形成的物质基础.
Gibbs图利用水体中TDS与Na+/(Na++Ca2+)、Cl−/(Cl−+HCO3−)的比值判断水体中离子来源和成因,可直观反映出温泉水中氟富集的主要因素[34]. 研究区大部分水样点落在水岩相互作用区域内(图5),表明水岩相互作用是影响研究区温泉水中F−浓度的主要控制因素. 地下热水在断裂内发生深循环,与周围岩石发生水岩反应,含氟矿物(萤石、云母)通过溶滤作用进入温泉水,造成温泉水中氟元素富集. Na+/(Ma++Ca2+)介于0.8—1.0之间,说明可能受到阳离子交换作用影响. 温泉水中F−浓度与TDS呈负相关(图2),也证实了蒸发浓缩作用不是控制温泉水中氟富集主要因素.
采用氯碱指数分析温泉水中阳离子交换作用,进一步解释温泉水中氟富集的原因。相关计算公式如下:
若CAI1和CAI2都为正,温泉水中Na+、K+与围岩中的Ca2+、Mg2+发生阳离子交换反应,负数则反之,氯碱指数的绝对值越大,则交换反应越强[35]. 研究区除沿海区域21、23、26号温泉外,其余温泉水样中CAI1和CAI2均为负值(图6),表明含水介质中的Ca2+、Mg2+被Na+、K+置换出,间接地促进了萤石的溶解,提高了温泉水中F−浓度. 由此得出,Ca2+、Mg2+会抑制温泉水中氟富集,低Ca2+、高Na+水化学环境更有利于氟富集. F−浓度与Ca2+、Mg2+呈负相关也证实这一点(图2),大多数学者称它为钙氟的拮抗作用[36].
地质条件是温泉水中氟形成的环境背景,其中地层岩性是影响氟含量的决定性因素. 研究区F−浓度低于10 mg·L−1的温泉大都为松散岩孔隙水类型,含水介质为第四纪砂岩、黏土这类沉积岩. 沉积岩含氟量通常低于其他岩石类型,一般含氟量为240—500 mg·L−1. 相比于沉积岩,出露于花岗岩、火山岩的温泉水中F−浓度大都高于10 mg·L−1,这类岩石一般含氟量可达到800—1000 mg·L−1[37].
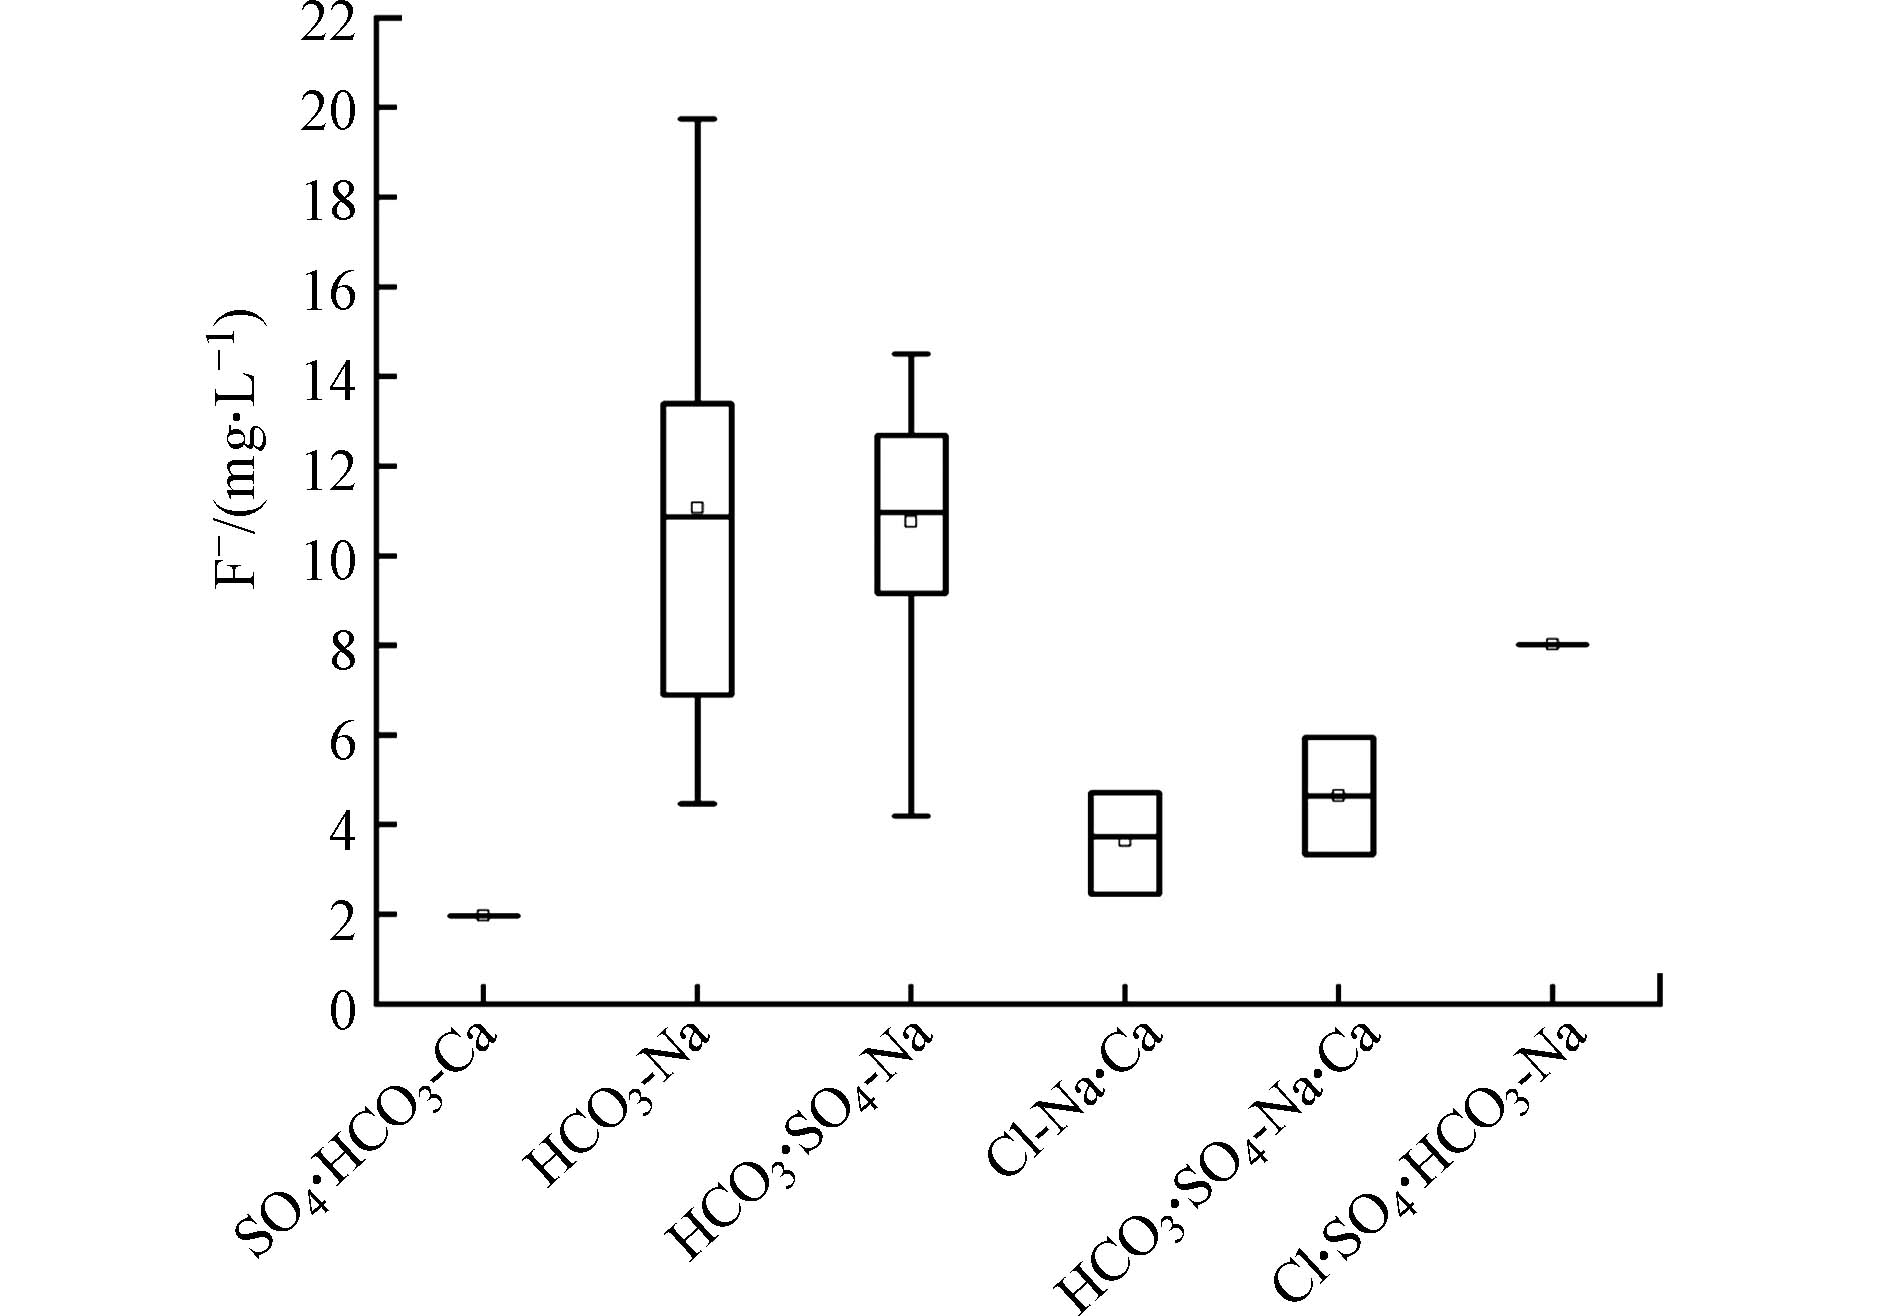
水化学环境也是影响地下水中氟浓度的重要因素。根据不同水化学类型与温泉水中氟含量,探究两者间的关系(图7),可见HCO3-Na、HCO3·SO4-Na型温泉水中氟元素较为富集. 弱碱性、高矿化度的HCO3-Na型水往往容易形成高氟水. 这类水化学类型中Na+含量较多,与F−相结合,形成易溶的NaF. 此外,在HCO3−含量多的碱性环境中,水中的OH−可置换围岩中的F−,造成水中氟含量升高[38]. 并且该种类型的水经常处于地下水流缓滞地带,有利于氟的稳定,较容易富集氟离子.
研究温泉水中F−浓度与水样温度呈正相关(图2). 温度上升F−活性增强,溶解度降低,吸附在黏土或矿物表面的F−会转变为游离态,进入水体中,使得水环境中F−浓度升高[39]. pH与F−也表现出正相关(图2),以CaF2为例,天然水体中存在如下反应:pH升高有利于Ca2+发生沉淀,水环境中Ca2+含量减少,使得平衡(6)向萤石溶解的方向进行,增加了温泉水中氟离子含量[40]. 由此看出,温度和pH升高会促进温泉水中F−浓度.
-
断裂循环型温泉微量元素的含量与元素特性,所处地层岩性,水岩相互作用等密切相关[41]. 研究区温泉水样中微量元素含量见表2. 其中Li、Sr、Ba、B含量相对较高,可以作为寻找高温地热水的指标. Mn、Fe在个别温泉中浓度较大,浓度变化波动较大,可能受地热水所处的围岩性质影响,其余微量元素含量相对较低. As元素作为地热系统典型有害元素,在下文也将讨论.
研究区温泉水样中Sr的含量最高,浓度为75.00—23620.00 μg·L−1,平均值为2007.56 μg·L−1;Li含量次之,平均值为417.70 μg·L−1;B平均浓度为89.76 μg·L−1. 温泉水中Sr含量较高与围岩中含Ca2+矿物溶滤作用有关,这是由于锶和钾元素之间也可以产生类质同象,并与钙离子容易发生离子交替吸附作用,在富钙、富钾的矿物中,Sr含量普遍较高[42].
Li元素化学性质活泼,水解能大. 研究区广泛发育燕山期侵入的花岗岩体,破碎岩体中的Li在硅酸盐矿物环境下,与围岩中的Fe、Na等元素会产生类质同象作用,在高温环境下通过溶滤作用进入温泉水[43].
B一般来源于海相沉积岩的溶滤作用与花岗岩的溶滤作用. 研究表明,地热水中B/Cl比值高且B的含量较高,则说明地热水中B主要来源于地热水对围岩的溶滤[44]. 研究区大部分温泉的B/Cl比值较高,说明这些温泉中B来源于花岗岩的淋滤. 但靠近大海的21、23、26号温泉中B/Cl比值较低,分别为0.05、0.02、0.04,说明这些温泉中B来源于海相沉积岩的淋滤.
-
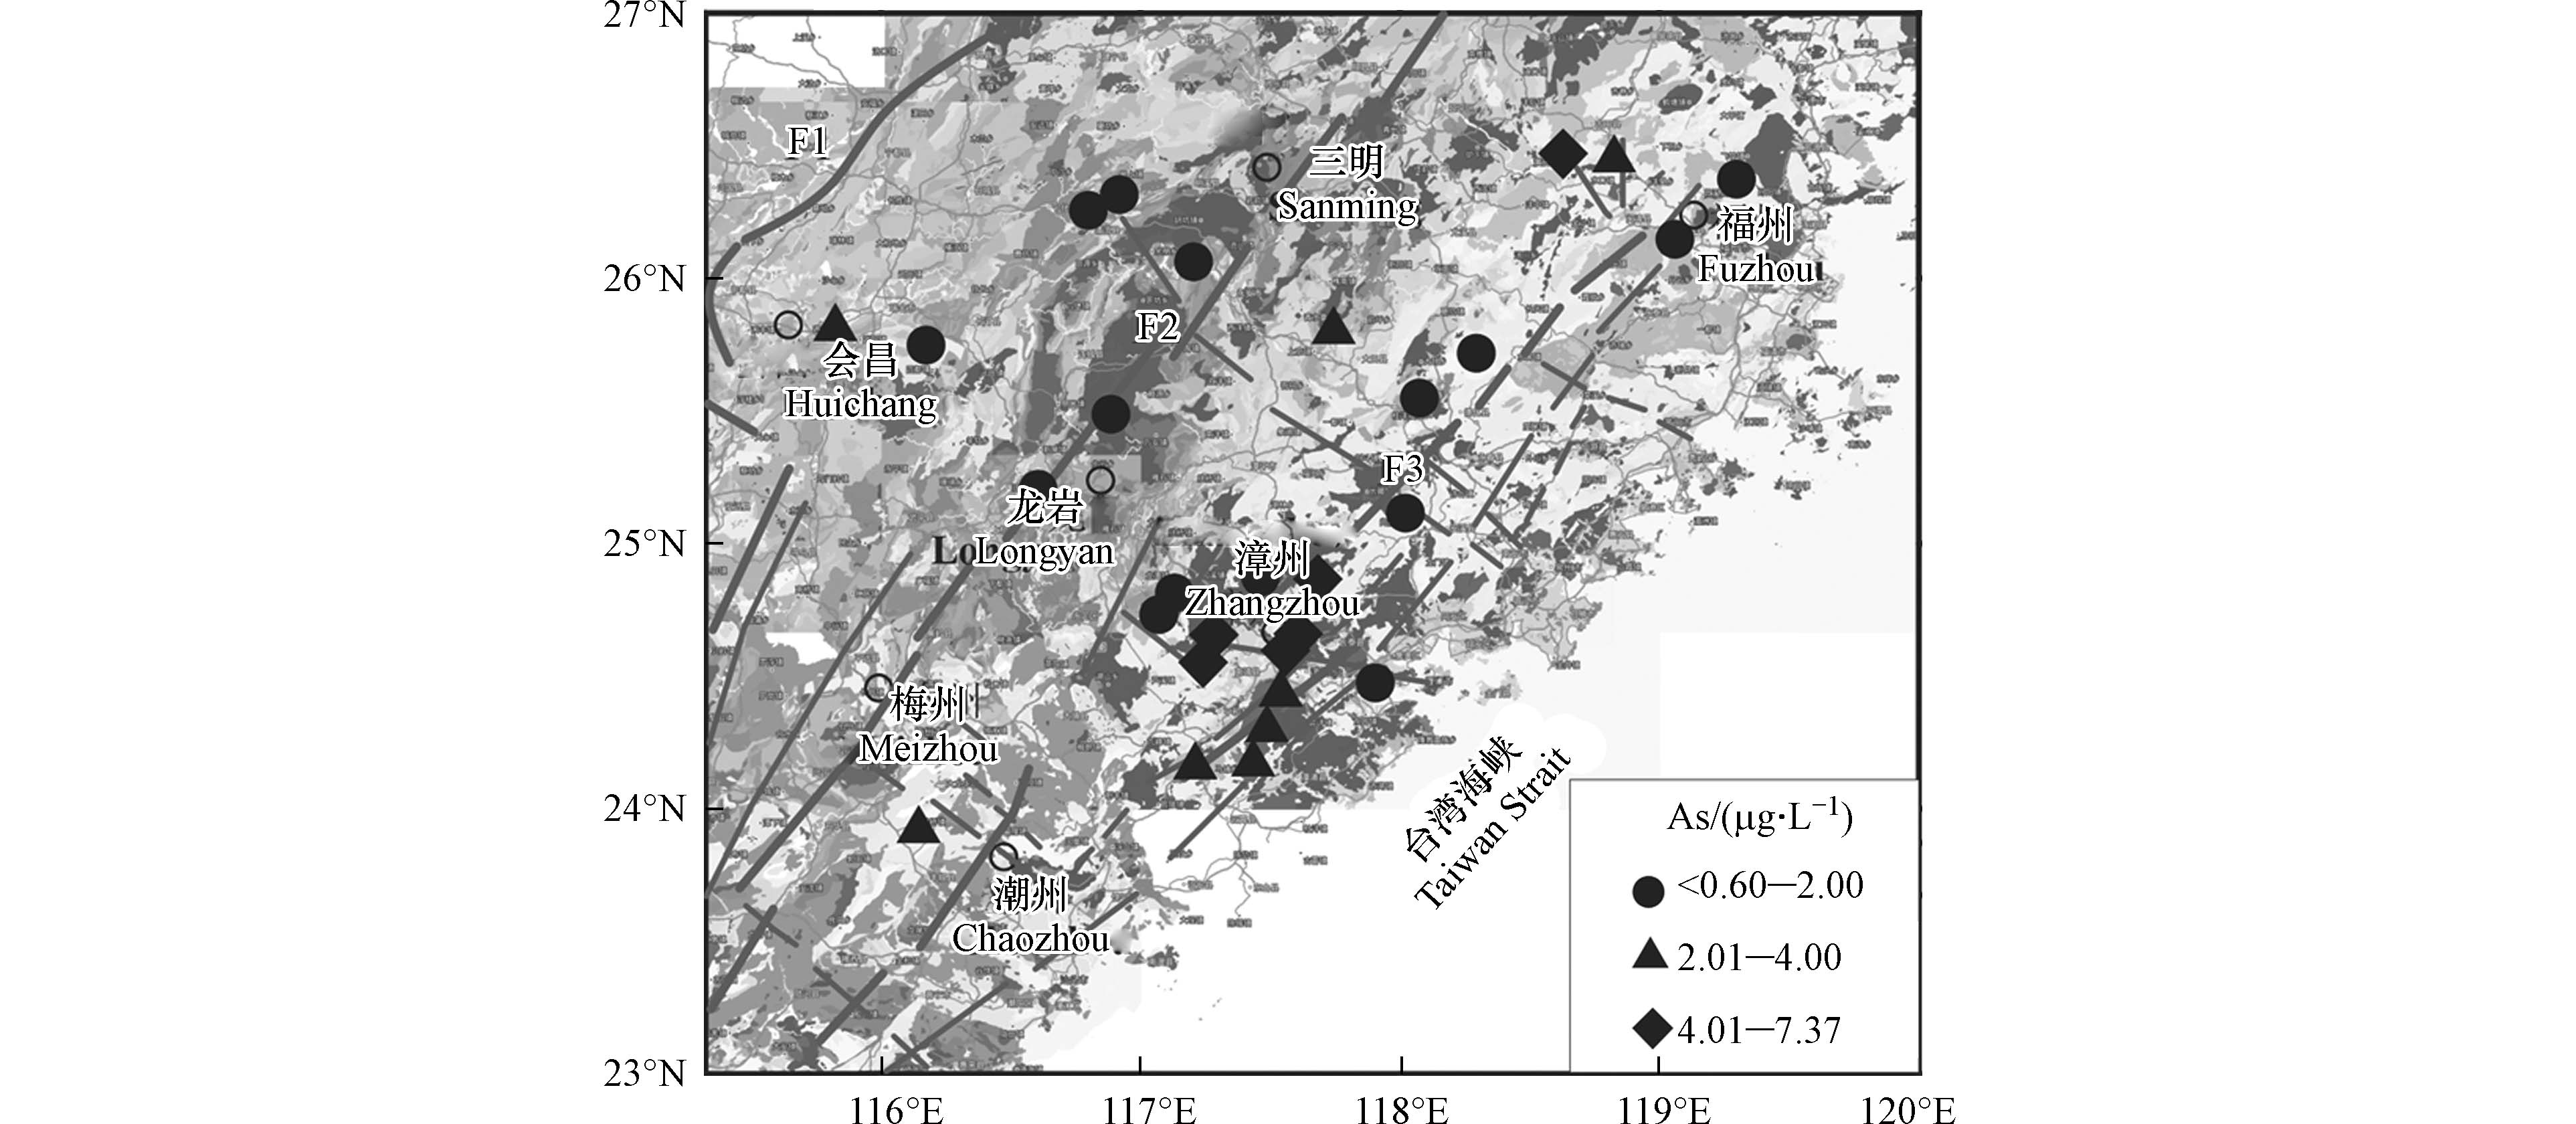
研究区温泉水中As的浓度为<0.60—7.37 μg·L−1,平均值为3.29 μg·L−1,均未超出《生活饮用水卫生标准》(GB 5749—2022)规定的标准(<10 μg·L−1),与我国典型地热泉中砷的浓度相比,研究区温泉水中砷浓度较低. 根据砷浓度空间分布图(图8)可以看出,本次采集的温泉水样中,漳州地区的温泉水中砷的含量明显高于其他区域,具有群体性. 该地区断裂多级衔接,分布密集. NNE向长乐—诏安断裂为地热流体的上升提供对流管道,NW向次级断裂与之交集增加了地热流体上升到地表的数量. 前人研究表明该处最高热流值为77.7 mW·m−2,平均值达到69 mW·m−2[45],地热流体的上涌会促进水岩反应程度,进而影响温泉水中砷含量. 同时,该地区分布的岩石也含有丰富的砷元素,如粉砂岩、黏土、花岗岩等,为温泉水中的砷元素提供了物质来源. 研究区其他区域温泉水中砷浓度较低,大多都低于检测限.
自然条件下,地下水中砷的释放机制与铁氧化物的还原溶解有关[46],但研究区温泉水中As与Fe相关性不强(图9),造成这种情况的可能原因有:(1)温泉水中的Fe2+可能被重新吸附到残余的铁氧化物表面,限制了温泉水中As含量;(2)温泉水中SO42−浓度较高,易发生脱硫酸作用,生成的S2−与Fe2+反应生成黄铁矿沉淀,影响温泉水中Fe浓度.
pH是影响地下水中砷浓度的重要参数. 高pH环境下,胶体或黏土矿物的正电荷会减少,砷酸盐的吸附会降低,导致地下水中砷的含量升高[47]. 研究区温泉中砷的浓度与pH相关关系并不明显(图9),可能是由于pH对砷含量的控制受到了其他水化学因素的影响. 温泉水中NO3−浓度较低时,砷的浓度越高(图9),说明还原环境对温泉水中砷含量升高起了重要作用. 在还原环境中,铁氧化物更易发生溶解,吸附在表面的砷元素也随之被释放[48]. 个别地方的NO3−偏高,可能有人类活动的影响,会抑制砷的浓度.
温泉水中砷的浓度和分布受储层温度和循环深度控制,循环深度越深,热储温度越高,水岩反应强度越大,溶滤出的砷元素就越多[49]. 前人已计算该地区温泉水循环深度为2.9—8.4 km,热储温度为90—226℃[30]. 根据研究区温泉水中砷浓度与循环深度和热储温度的关系(图9)可以看出,砷浓度随温泉水的热储温度与循环深度的增大而升高,说明地热水迁移过程中,砷浓度受地下温度变化影响. 地下热水在断裂内发生深度循环,由于温泉的环流深度,地热水与围岩在高温高压环境下,发生强烈的水岩反应,从而围岩中溶解出更多的砷元素,导致温泉中砷浓度升高. 另外,由于中国东南大陆边缘的碰撞和俯冲,导致研究区内中小型地震发育频繁[30],区域构造应力的变化也会改变地热水循环系统,促进水岩反应程度,由此改变温泉水中砷的含量.
-
地下水中砷氟共存的情况在世界各地经常被报道,但由于地质环境、气候条件、水化学环境和砷氟的多种释放机制等因素影响,导致两者之间的共存往往产生差异[50]. 先前研究表明,阿根廷等地地下水中碱性pH值使得砷氟浓度呈正相关[51];西藏地热区中热动力效应对砷与氟的富集起到控制作用,砷与氟呈正相关,高砷水与高氟水在地域上具有伴生型[40]. 根据研究区温泉中As与F−的关系可以看出(图9),两者的分布呈负相关,与上述研究有所不同. 高氟水中砷含量较低,砷含量高的温泉水中氟富集较少,这与含水介质的岩性分布有密切关系. 由花岗岩和火成岩形成的基岩裂隙型热水中F−离子浓度平均值达到9.99 mg·L−1,As浓度平均值为2.41 μg·L−1. 相反,在松散岩型孔隙水中F−浓度平均值为8.37 mg·L−1,As平均浓度为3.90 μg·L−1. 由此看出,岩性是影响研究区温泉水中砷氟分配关系的重要因素. 同时研究区温泉水中阳离子交换作用较强,对As和F−的浓度也有一定影响. Na+/Ca2+可以指示地下水中阳离子类型. 研究区温泉水中As与Na+/Ca2+之间存在负相关(图10),说明砷含量高的温泉水中,Na+相对减少,Ca2+相对增加,进而抑制F−浓度. 而F−与Na+/Ca2+之间呈正相关,与砷元素不同.
-
鉴于该地区温泉大多都为居民用水资源,本文分别从主量元素和微量元素两个方面对温泉水质量做出评价. 根据《生活饮用水卫生标准》(GB 5749—2022)规定的Ⅲ类标准阈值(表1),研究区温泉水TDS平均值为805.6 mg·L−1,26号漳浦井水样,21号清温泉水样和23号港尾大桶温泉水样超过了饮用水规定的Ⅲ类标准;10号谢坊温泉中硫酸盐超出饮用水规定的Ⅲ类标准;21、23、26号温泉水中氯化物超出饮用水规定的Ⅲ类标准. 所有温泉水中氟的含量均超标,长期使用会引起斑齿病和大骨节病,给人体造成极大危害.
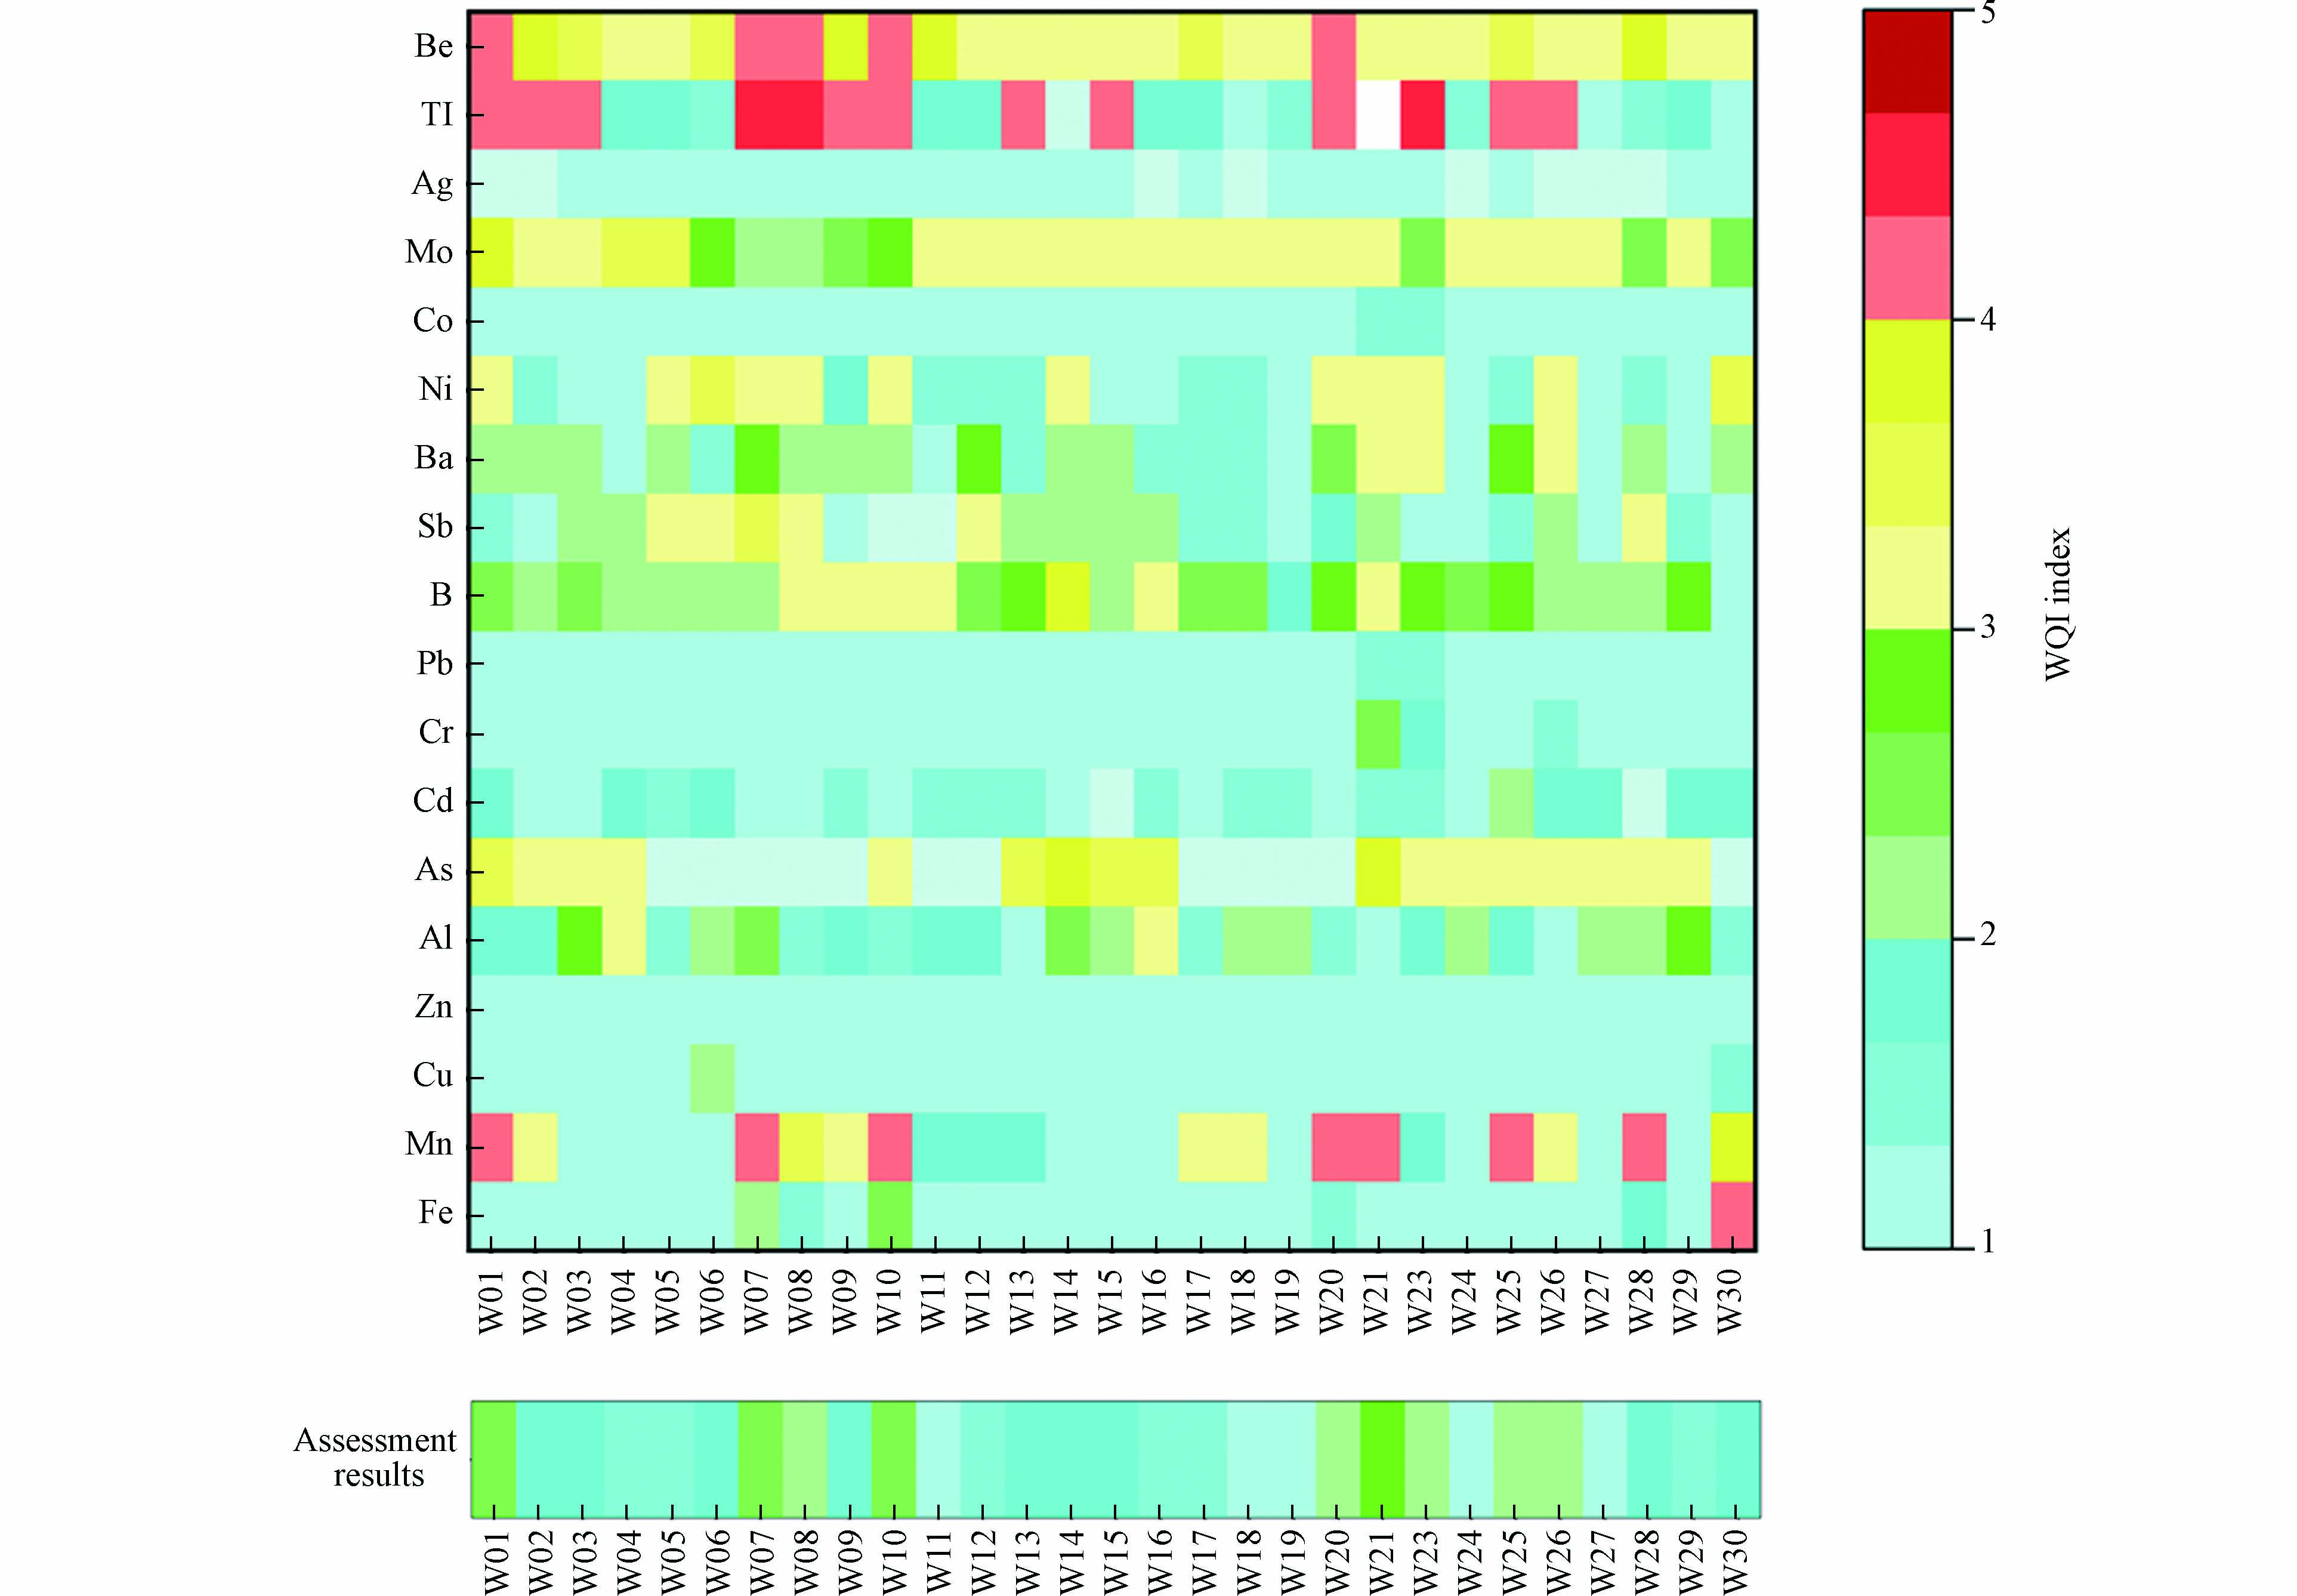
本文选择与人体健康相关的18种微量元素,水质评价结果见图11. 大多数温泉的水质指标都在安全值以下,个别元素出现异常,温泉WQI综合水质标识指数在1类和3类之间,说明温泉整体水质较为原始. 4种元素在单因子评价结果中出现超标情况:Fe元素在30号温泉水中含量为413 μg·L−1,超出Ⅲ类标准(<300 μg·L−1),为Ⅳ类水;Mn元素在第1、7、10、20、21、25、28号温泉水中含量均超出Ⅲ类标准(<100 μg·L−1)为Ⅳ类水;Be元素在第1、7、8、10、20号温泉水中含量均超出Ⅲ类标准(<2 μg·L−1)为Ⅳ类水;Tl元素在所有元素中超标最严重中,在21号温泉中含量为1.11 μg·L−1,超出Ⅲ类标准(<0.1 μg·L−1)为劣Ⅴ类水,在1—3,7—10,13、15、20、23、25、26号温泉中为Ⅳ类水. 除此之外,其余温泉水中微量元素含量均未超过国家饮用水规定的Ⅲ类标准(表2). 综合温泉水中主量、微量元素评价结果:本次采集的温泉水样均不适合作为生活饮用水和农业用水.
-
研究区温泉WQI综合水质标识指数在1类和3类之间,温泉整体水质原始,但部分温泉中Fe、Mn、Be、Tl出现超标情况. F−浓度均超过生活饮用水规定的Ⅲ类标准,这些温泉均不适合作为生活饮用水和农业用水.
根据《地热资源地质勘查规范》除30号温泉外,其余温泉水温都大于40 ℃,属于中温地热资源(40—90 ℃),可用于采暖、洗浴、温室. F−浓度达到对人体健康有益标准(>1 mg·L−1),Li在月汤温泉、天芳悦潭、清温泉等温泉中浓度达到医疗水质标准(1 mg·L−1),Sr在清温泉、港尾大桶温泉浓度也达到医疗水质标准(10 mg·L−1),这些温泉可以作为理疗温泉使用.
研究区温泉水中携带F、Li、Sr组分对人体具有理疗功效,对于还没有开发利用的温泉,可以考虑改造为医疗温泉. 但部分温泉中有害元素超标,在开发利用过程中应采取管理措施保证水质.
-
1)研究区采集的温泉水样整体呈碱性,TDS平均值为805.6 mg·L−1. 阳离子主要为Na+,阴离子以HCO3−和SO42−为主,部分离子浓度与TDS呈正相关. 硅酸盐矿物的溶解是温泉水中离子组分的主要来源. 温泉水中F−浓度均超标,平均值为9.32 mg·L−1,沿海区域温泉水F−浓度普遍高于内陆地区. 高氟温泉水以HCO3-Na,HCO3·SO4-Na型水为主. 研究区地层中含氟矿物为温泉水中氟富集提供了物质基础,水岩相互作用、Na+—Ca2+离子交换作用是控制氟富集的主要地球化学因素. pH、温度和含氟岩石类型对温泉水中氟富集过程有重要影响.
2)温泉水中微量元素来源于水—岩相互过程中不同矿物的溶解. Li、Sr等微量元素含量较高,其余大部分微量元素含量较低. As的浓度为<0.60—7.37 μg·L−1,平均值为2.69 μg·L−1. 特殊的地质环境使得漳州地区温泉中砷的含量较高,具有群体性. 还原环境对温泉水中砷含量升高起了重要作用. 地热水的循环深度、热储温度以及中小型地震的发生会促进水岩反应,进而影响温泉水中砷含量. 研究区温泉水中As与F−呈负相关,含水介质的岩性分布起到重要作用;阳离子交换作用也使得砷含量高的温泉水中Ca2+较高,不利于F−富集.
3)水质评价结果表明,本次采集的温泉水均不适合作为生活饮用水和农业用水. 硫酸盐、氯化物、F−均出现不同程度超标;微量元素WQI综合指数在1类和3类之间,但Fe、Mn、Be、Tl元素在部分温泉中超出Ⅲ类标准. F、Li、Sr组分在部分温泉中达到医疗水质标准,具有理疗和保健的功效.
福建地区断裂带温泉环境地球化学特征
Environmental geochemical characteristics of hot springs in fault zone in Fujian
-
摘要: 通过对福建地区断裂带附近温泉水样中主量元素和微量元素测定,采用水文地球化学和统计方法重点讨论了温泉水中有害元素地球化学特征,并利用WQI综合水质标识指数法进行水质评价. 分析结果表明:(1)温泉水主量元素主要来源于硅酸盐矿物水解. F−浓度均超标,平均值为9.32 mg·L−1,沿海地区温泉水F−浓度普遍高于内陆地区. 水—岩相互作用、Na+—Ca2+阳离子交换作用是控制温泉水中氟富集的主要地球化学因素. HCO3-Na,HCO3·SO4-Na型水中氟含量较高,pH、温度和含氟岩石类型对温泉水中氟富集过程有重要影响. (2)研究区温泉水中砷浓度平均值为3.29 μg·L−1,特殊的地质环境使得漳州地区砷浓度分布在空间上具有群体性. 还原性—弱碱性环境、地热水的循环深度与热储温度和中小型地震的频繁发生会影响温泉水中砷的含量. (3)研究区温泉水中As与F−呈负相关,这与含水介质的岩性分布密切相关. 同时由于阳离子交换作用也使得砷含量高的温泉水中Ca2+较高,不利于F−富集. (4)温泉水质评价表明本次采集的温泉水均不适合作为生活饮用水和农业用水:SO42−、Cl−、F−均出现不同程度超标,微量元素WQI综合水质标识指数在1类和3类之间,但个别温泉中Fe、Mn、Be、Tl元素出现超标情况. 部分温泉中Li、Sr、F含量及水温达到理疗热泉标准,具有理疗保健的功效. 研究结果为福建地区温泉开发提供了新的环境地球化学资料.Abstract: The geochemical characteristics of harmful elements was discussed by means of hydrogeochemical and statistical methods in this paper, supported by the determination of major elements and trace elements in hot spring water samples near the fault zone in Fujian, and the water quality was evaluated by comprehensive water quality index (WQI) method. The results indicate that (1) The main elements of hot water are mainly derived from silicate mineral hydrolysis. The concentration of F− in hot spring water exceeds the recommended standard with an average of 9.32 mg·L−1, and the F− concentration of hot spring water in coastal areas was generally higher than inland areas. Water-rock interaction and Na+—Ca2+ cation exchange are the main geochemical factor controlling the enrichment of fluorine from hot spring water. HCO3-Na, HCO3-SO4-Na type water has higher fluorine content, and pH, temperature and fluoride-bearing rock type have important effects on the fluorine enrichment process in hot spring water. (2) The average arsenic concentration in hot spring water in the study area is 3.29 μg·L−1, and the special geological environment makes the spatial distribution of arsenic concentration in the Zhangzhou area grouped. The reductive-weakly alkaline environment, the depth of geothermal water circulation and thermal storage temperature, and the frequent occurrence of small and medium-sized earthquakes affect the arsenic content in hot spring water.(3) The correlation between arsenic and fluoride in the hot spring water of the study area are negative, which is closely related to the lithological distribution of the water-bearing medium. At the same time, cation exchange also makes the Ca2+ higher in the hot spring water with high arsenic concentration, which is not conducive to F− enrichment. (4)The water quality evaluation results of the hot springs shows that the hot spring water samples collected are not suitable for drinking water and agricultural water. SO42−, Cl− and F− all exceed the standard to varying degrees. Although the water quality index (WQI) indicates the water quality index is between Category 1 and Category 3, the concentration of Fe, Mn, Be, and Tl have exceeded the standard in some hot spring. The content of Li, Sr, and F and the water temperature has reached the medical hot spring standard with physiotherapy and health care effects in some hot springs. These results provide new environmental geochemical data for the development of hot springs in Fujian.
-
Key words:
- hot spring /
- fluorine /
- arsenic /
- water- rock reaction /
- water quality assessment /
- Fujian.
-

-
表 1 温泉样品的水化学参数(mg·L−1)
Table 1. Hydrochemical parameters of Thermal spring samples
采样点
Sample温泉名
Thermal springT/℃* pH* TDS Na+* K+* Mg2+* Ca2+* F− Cl−* SO42−* NO3−* CO32−* HCO3−* 水化学类型*
Typeib 1 黄楮林温泉 49.2 7.79 489.1 161.69 5.13 1.28 24.34 6.74 6.12 75.68 0.09 59.68 296.64 HCO3-Na −1.35% 2 中平村坪坡温泉 60.4 8.04 387.3 133.35 4.78 0.32 20.32 10.28 5.75 45.43 0.19 29.47 274.91 HCO3Na −0.63% 3 塔兜温泉 90.0 7.89 337.3 124.18 6.02 0.09 9.49 19.75 8.82 51.45 0.00 27.26 180.53 HCO3Na −0.78% 4 龙门上汤温泉 82.1 7.9 238.9 89.25 3.07 0.06 5.12 12.69 8.33 45.45 0.00 0.00 149.82 HCO3·SO4Na −0.50% 5 蓬壶镇魁都温泉 66.6 7.61 414.9 90.61 4.32 0.25 42.53 5.95 14.83 186.77 0.00 0.00 139.33 HCO3·SO4Na·Ca −2.70% 6 下汤泉 59.0 8 388.4 123.57 5.00 2.82 30.98 6.90 4.64 23.89 0.30 39.79 301.13 HCO3Na 0.09% 7 热西温泉 71.9 7.49 756.7 218.00 12.46 3.29 56.81 4.47 5.24 155.76 0.00 50.10 501.13 HCO3Na −1.14% 8 月汤温泉 54.2 7.75 911.9 242.23 12.96 4.61 53.48 4.20 8.18 418.93 0.00 8.84 316.86 HCO3·SO4Na −1.30% 9 天芳悦潭 76.2 8.07 567.9 183.25 9.21 0.71 21.66 10.49 6.89 187.76 0.00 47.16 201.50 HCO3·SO4Na −0.50% 10 谢坊温泉 36.7 7.54 965.8 228.40 9.95 0.91 95.12 3.34 14.65 426.57 0.00 0.00 373.79 HCO3·SO4Na·Ca −0.96% 11 热汤哩温泉 54.8 7.7 490.5 149.50 4.93 0.26 20.25 10.97 8.10 205.27 0.19 0.00 182.03 HCO3·SO4Na −1.30% 12 汰内温泉 57.7 7.8 334.8 103.94 3.79 0.14 20.07 10.08 8.46 105.90 0.00 0.00 164.80 HCO3·SO4Na −0.20% 13 莲氏古村温泉 59.0 7.61 289.1 93.61 3.53 0.69 13.96 8.37 11.21 69.28 2.69 0.00 171.54 HCO3·SO4Na −0.70% 14 下庵温泉 48.2 7.64 593.4 188.38 4.59 0.13 27.36 8.02 126.88 173.39 0.05 0.00 128.84 Cl·SO4·HCO3Na −0.09% 15 五星温泉 59.4 7.83 323.2 116.65 4.62 0.09 7.60 14.50 11.94 69.60 0.10 0.00 196.26 HCO3·SO4Na −0.84% 16 汤坑温泉 75.2 7.84 380.5 135.36 3.20 0.10 6.72 12.43 21.67 123.11 0.00 0.00 155.81 SO4·HCO3Na −0.28% 17 上汤温泉 58.7 8.01 359.5 127.78 4.49 0.27 13.78 13.39 10.45 55.80 0.00 30.95 205.25 HCO3Na −0.68% 18 西坑温泉 60.6 7.85 355.0 121.36 2.89 0.21 13.07 11.72 10.79 113.58 0.15 0.00 162.55 HCO3·SO4Na 0.28% 19 下车温泉 54.9 7.97 186.3 74.09 2.55 0.07 5.91 12.35 3.23 16.95 0.00 0.00 142.33 HCO3Na 1.14% 20 湖里温泉 68.3 8.23 606.8 194.77 9.08 0.35 30.50 9.17 9.49 172.26 0.00 29.47 303.38 HCO3·SO4Na −0.10% 21 清温泉 48.0 7.36 5041.8 1052.04 67.40 3.21 548.95 2.45 3172.96 102.91 0.49 0.00 157.31 Cl-Na·Ca −5.62% 22** 东泗温泉井 65.7 7.21 14358.4 2320.00 79.80 10.30 1913.00 180.40 9405.20 368.43 5.59 0.00 83.15 Cl-Na·Ca −8.71% 23 港尾大桶温泉 65.1 7.01 5171.6 1296.17 41.95 1.74 389.49 3.73 3342.67 64.17 1.27 0.00 35.96 Cl-Na·Ca −5.55% 24 汤兜温泉 70.0 7.97 498.2 173.92 5.01 0.11 33.64 14.29 23.48 75.70 0.00 14.74 314.61 HCO3Na 2.06% 25 东山温泉 63.5 8.13 534.1 187.36 6.89 0.49 18.99 10.77 13.66 98.32 0.00 32.42 330.34 HCO3Na −0.49% 26 漳浦井 45.0 7.31 1502.0 409.17 14.72 0.24 108.44 4.72 873.56 62.59 0.08 0.00 51.69 Cl-Na −3.36% 27 云霄温泉 60.0 7.61 213.1 79.96 2.21 0.07 6.08 11.90 17.10 25.36 0.00 0.00 140.83 HCO3Na −0.65% 28 千江温泉井 83.0 7.98 273.0 96.74 4.64 0.32 13.22 10.87 7.73 8.02 0.33 19.16 223.97 HCO3Na −1.26% 29 贵安 温泉井 81.0 7.95 286.3 99.61 3.83 0.08 5.92 13.66 12.58 72.96 0.00 13.26 128.84 HCO3·SO4Na −2.10% 30 森林公园温泉 25.0 7.54 465.8 14.84 0.83 3.52 125.37 1.96 4.42 208.86 0.00 0.00 211.99 SO4·HCO3−Ca −2.70% 最大值max 90.0 8.23 5171.6 1296.17 67.4 4.61 548.95 19.75 3342.67 426.57 2.69 59.68 501.13 最小值min 25.0 7.01 186.3 14.84 0.83 0.06 5.12 1.96 3.23 8.02 0.00 0.00 35.96 平均值mean 62.0 7.77 805.6 217.58 9.11 0.91 61.00 9.32 268.06 118.68 0.20 13.87 211.86 阈值threshold 1000 1.0 250 250 20 注:*数据来源于文献[30];**表示不参与分析;“—”表示未测得.
Note: *Data from literature[30];** indicates Non-participation in analysis;“—”indicates not test.表 2 温泉样品中的微量元素 (μg·L−1 )
Table 2. Trace Elements in Thermal spring samples (μg·L−1 )
采样点
SampleLi Be V Mn Cr Co Ni Cu Zn Mo Cd 1 125.00 2.46 0.48 410.00 0.39 0.17 2.16 0.54 3.45 63.50 0.09 2 253.00 1.77 0.20 61.70 0.24 0.05 0.96 0.39 1.64 29.40 0.02 3 445.00 1.05 0.26 9.21 0.23 0.04 0.55 0.32 1.28 17.60 0.02 4 133.00 0.23 0.63 0.78 0.16 0.02 0.31 0.46 4.17 43.80 0.07 5 112.00 0.23 0.43 6.91 0.26 0.19 3.13 0.88 2.33 38.50 0.05 6 376.00 1.25 1.06 1.09 0.22 0.17 9.99 10.10 11.10 8.00 0.07 7 799.00 11.2 0.38 487.00 0.28 0.36 6.02 1.22 3.78 1.93 0.02 8 1115.00 2.28 0.52 81.70 0.33 0.37 5.75 2.17 3.37 1.77 0.02 9 1109.00 1.51 0.41 58.70 0.34 0.09 1.33 1.07 2.03 5.82 0.05 10 629.00 9.64 1.18 456.00 0.46 0.54 8.07 2.32 2.29 8.11 0.02 11 487.00 1.44 0.54 39.50 0.27 0.09 1.26 1.49 1.23 11.20 0.04 12 138.00 0.44 0.50 44.70 0.30 0.09 1.24 1.04 1.00 14.40 0.05 13 106.00 0.53 0.57 45.00 0.32 0.02 0.95 0.79 4.21 14.00 0.04 14 281.00 0.11 4.18 3.28 0.38 0.10 2.13 0.86 3.01 17.90 0.02 15 112.00 0.33 0.47 3.02 0.26 0.04 0.38 1.25 1.28 22.80 <0.002 16 110.00 0.11 0.85 6.69 0.06 0.02 0.29 0.93 1.08 23.50 0.05 17 246.00 0.88 0.34 50.20 0.11 0.02 0.96 0.57 1.18 12.00 0.02 18 217.00 0.35 0.38 54.10 0.18 0.04 0.81 0.64 1.81 15.60 0.05 19 174.00 0.56 0.11 11.10 0.02 0.03 0.25 0.12 1.19 26.70 0.05 20 658.00 2.63 0.22 120.00 0.55 0.15 2.04 1.02 1.42 16.80 0.02 21 1540.00 0.38 112.0 412.00 8.15 2.78 35.90 2.55 1.11 13.10 0.05 22 1364.00 0.63 96.40 658.00 2.71 6.35 101.00 4.96 1.96 3.79 0.17 23 1575.00 0.12 61.50 48.40 3.25 1.93 31.60 2.15 15.10 5.65 0.05 24 128.00 0.42 2.48 0.52 0.53 0.05 0.44 0.61 1.36 18.60 0.02 25 205.00 0.79 1.62 124.00 0.44 0.10 1.16 1.23 7.80 18.60 0.14 26 401.00 0.11 28.30 66.10 2.64 0.50 7.92 1.32 0.41 17.80 0.09 27 96.30 0.22 1.16 0.39 0.32 0.01 0.27 0.32 1.53 18.90 0.09 28 281.00 1.46 0.75 174.00 0.40 0.08 0.98 0.54 0.94 4.82 <0.002 29 237.00 0.12 1.22 1.37 0.17 0.02 0.30 0.60 0.42 15.30 0.07 30 25.10 0.3 0.48 94.60 0.33 0.76 12.90 4.56 4.35 5.22 0.07 最大值 1575.00 11.20 112.0 487.00 8.15 2.78 35.90 10.1 15.10 63.50 0.14 最小值 25.10 0.11 0.11 0.39 0.02 0.01 0.25 0.12 0.41 1.77 <0.002 平均值 417.70 1.48 7.70 99.04 0.75 0.30 4.83 1.45 2.96 17.63 0.05 阈值 2 100 50 50 20 1000 1000 70 5 采样点
SampleSb Ba Tl Pb U Ag B Fe Al As Sr 1 0.04 24.80 0.10 0.10 0.26 <0.002 52.40 8.63 8.55 4.30 679.00 2 0.10 25.50 0.12 0.11 0.14 <0.002 33.00 7.93 8.98 2.28 424.00 3 0.16 29.60 0.20 0.14 0.02 0.01 55.70 1.63 45.40 1.62 181.00 4 0.12 2.27 0.07 0.14 0.02 0.01 36.90 4.65 67.10 1.61 77.60 5 1.90 11.30 0.08 0.04 0.01 0.01 32.10 9.60 5.74 <0.60 551.00 6 1.85 5.85 0.05 0.22 0.39 0.01 46.50 14.20 11.90 — 245.00 7 2.42 79.10 0.46 0.07 0.01 0.01 47.00 132.00 26.30 <0.60 1359.00 8 1.41 35.70 0.52 0.03 0.06 0.01 225.00 54.80 5.31 <0.60 1840.00 9 0.02 38.80 0.35 0.05 0.02 0.01 209.00 16.00 8.35 <0.60 571.00 10 <0.002 24.40 0.24 0.09 0.86 0.004 189.00 161.00 3.88 3.31 2514.00 11 <0.002 9.72 0.07 0.04 0.49 0.01 132.00 0.56 8.47 <0.60 531.00 12 1.54 69.10 0.08 0.06 0.00 0.01 51.40 2.64 6.76 <0.60 542.00 13 0.19 4.26 0.15 0.07 0.06 0.01 87.10 3.53 9.99 4.55 304.00 14 0.17 17.50 <0.002 0.67 0.01 0.01 415.00 7.73 24.60 6.88 1009.00 15 0.23 13.00 0.12 0.11 0.00 0.01 97.60 4.47 16.60 4.31 227.00 16 0.15 5.31 0.08 0.08 0.01 <0.002 139.00 1.96 55.60 4.53 250.00 17 0.05 3.81 0.08 0.06 0.02 0.01 70.60 11.80 5.21 <0.60 252.00 18 0.04 5.93 0.03 0.05 0.01 <0.002 67.00 1.17 14.20 <0.60 297.00 19 0.03 0.63 0.05 0.10 0.06 0.01 14.80 2.09 12.00 <0.60 75.00 20 0.08 47.20 0.31 0.12 0.04 0.01 72.00 46.80 4.06 <0.60 617.00 21 0.16 287.00 1.11 2.44 1.70 0.01 152.00 7.96 1.32 7.37 23620.00 22 0.34 324.00 1.18 2.51 0.00 <0.002 85.40 79.30 28.10 1.68 44365.00 23 0.10 115.00 0.65 2.60 0.00 0.02 77.20 1.15 6.97 1.43 14391.00 24 0.03 1.41 0.05 0.22 0.01 <0.002 53.10 3.94 23.70 2.90 195.00 25 0.04 80.70 0.12 0.12 0.16 0.01 75.00 1.96 7.22 2.55 467.00 26 0.11 224.00 0.24 1.67 0.03 <0.002 34.50 5.68 2.25 2.59 5128.00 27 0.02 1.38 0.03 0.07 0.01 <0.002 24.70 0.90 21.10 2.71 98.70 28 0.93 19.90 0.05 0.08 0.02 <0.002 28.00 86.50 15.20 2.22 339.00 29 0.06 1.08 0.09 0.07 0.02 0.01 80.20 1.87 42.60 0.72 109.00 30 0.01 21.2 0.01 0.45 1.40 0.01 5.16 413.00 3.54 <0.60 1326.00 最大值 2.42 287.00 1.11 2.60 1.70 0.02 415.00 413.00 67.10 7.37 23620.00 最小值 <0.002 0.63 <0.002 0.03 0.00 <0.002 5.16 0.56 1.32 <0.60 75.00 平均值 0.44 41.57 0.20 0.35 0.20 0.01 89.76 35.04 16.31 3.29 2007.56 阈值 5 700 0.1 10 50 500 300 200 10 -
[1] WU Y Q, ZHOU X, ZHOU L Y, et al. Structural controls of the northern Red River Fault Zone on the intensity of hydrothermal activity and distribution of hot springs in the Yunnan-Tibet geothermal belt[J]. Geothermics, 2023, 109: 102641. doi: 10.1016/j.geothermics.2022.102641 [2] 周训. 地下水科学专论[M]. 北京: 地质出版社, 2010. ZHOU X. Monograph on groundwater science[M]. Beijing: Publishing House, 2010(in Chinese).
[3] SHUKLA A, MANIAR K, PILLAI A, et al. Geothermal water in Bakreshwar-Tantoli region in West Bengal, India: implications on water quality for irrigation and drinking purposes[J]. Groundwater for Sustainable Development, 2022, 18: 100773. doi: 10.1016/j.gsd.2022.100773 [4] GUO Q H, WANG Y X, LIU W. B, As, and F contamination of river water due to wastewater discharge of the Yangbajing geothermal power plant, Tibet, China[J]. Environmental Geology, 2008, 56(1): 197-205. doi: 10.1007/s00254-007-1155-2 [5] WANG M M, ZHOU X, LIU Y, et al. Major, trace and rare earth elements geochemistry of geothermal waters from the Rehai high-temperature geothermal field in Tengchong of China[J]. Applied Geochemistry, 2020, 119: 104639. doi: 10.1016/j.apgeochem.2020.104639 [6] DENG Y M, NORDSTROM D K, BLAINE MCCLESKEY R. Fluoride geochemistry of thermal waters in Yellowstone National Park: I. Aqueous fluoride speciation[J]. Geochimica et Cosmochimica Acta, 2011, 75(16): 4476-4489. doi: 10.1016/j.gca.2011.05.028 [7] MORALES-SIMFORS N, BUNDSCHUH J. Arsenic-rich geothermal fluids as environmentally hazardous materials–A global assessment[J]. Science of the Total Environment, 2022, 817: 152669. doi: 10.1016/j.scitotenv.2021.152669 [8] 周默. 几种水质评价方法在地表水评价中的应用及比较研究[J]. 水资源开发与管理, 2022, 8(9): 50-55 ZHOU M. Application and comparative study of several evaluation methods for water quality in surface water evaluation[J]. The Global Seabuckthorn Research and Development, 2022, 8(9): 50-55(in Chinese).
[9] ZHANG Q Y, XU P P, QIAN H. Groundwater quality assessment using improved water quality index (WQI) and human health risk (HHR) evaluation in a semi-arid region of northwest China[J]. Exposure and Health, 2020, 12(3): 487-500. doi: 10.1007/s12403-020-00345-w [10] SHAH M, SIRCAR A, VARSADA R, et al. Assessment of geothermal water quality for industrial and irrigation purposes in the Unai geothermal field, Gujarat, India[J]. Groundwater for Sustainable Development, 2019, 8: 59-68. doi: 10.1016/j.gsd.2018.08.006 [11] AHSAN W A, AHMAD H R, FAROOQI Z U R, et al. Surface water quality assessment of Skardu springs using Water Quality Index[J]. Environmental Science and Pollution Research, 2021, 28(16): 20537-20548. doi: 10.1007/s11356-020-11818-5 [12] QU B, ZHANG Y L, KANG S C, et al. Water quality in the Tibetan Plateau: Major ions and trace elements in rivers of the “Water Tower of Asia”[J]. Science of the Total Environment, 2019, 649: 571-581. doi: 10.1016/j.scitotenv.2018.08.316 [13] HU S B, HE L J, WANG J Y. Heat flow in the continental area of China: A new data set[J]. Earth and Planetary Science Letters, 2000, 179(2): 407-419. doi: 10.1016/S0012-821X(00)00126-6 [14] 庄庆祥. 福建地热资源勘查研究[J]. 能源与环境, 2015(1): 2-4. ZHUANG Q X. Study on geothermal resources exploration in Fujian[J]. Energy and Environment, 2015(1): 2-4(in Chinese).
[15] 魏斯禹, 刘绍成, 敖光华, 等. 福建省陆缘地热活动及地球物理场特征[J]. 西北地震学报, 1988(3): 74-81. WEI S Y, LIU S C, AO G H, et al. The Geothermal Activity and the Characteristics of Geophysics Field in Continental Margin of Fujian Province[J]. Northwestern Seismological Journal, 1988(3): 74-81(in Chinese).
[16] 庞忠和, 樊志成, 汪集旸. 漳州盆地水热系统的氢氧稳定同位素研究[J]. 岩石学报, 1990, 6(4): 75-84. PANG Z H, FAN Z C, WANG J Y. The study on stable oxygen and hydrogen isotopes in the Zhangzhou Basin hydrothermal system[J]. Acta Petrologica Sinica, 1990, 6(4): 75-84 (in Chinese).
[17] 廖丽霞, 秦双龙. 福建流体台网对日本9级巨震的响应特征分析[J]. 内陆地震, 2014, 28(4): 298-304. LIAO L X, QIN S L. Responding characteristics of Fujian fluid network for Japan earthquake with Ms9.0[J]. Inland Earthquake, 2014, 28(4): 298-304(in Chinese).
[18] ZHANG Y, ZHANG Y J, YU H, et al. Geothermal resource potential assessment of Fujian Province, China, based on geographic information system (GIS)-supported models[J]. Renewable Energy, 2020, 153: 564-579. doi: 10.1016/j.renene.2020.02.044 [19] 王琼. 福建东南沿海地区地下水质量与防治对策探析[J]. 福建建筑, 2022, (11): 141-144. WANG Q. Studies about the underground water quality in southeastern coastal areas of Fujian and preventive countermeasures[J]. Fujian Architecture & Construction, 2022, (11): 141-144(in Chinese).
[20] 韦德光, 揭育金, 黄廷淦. 福建省区域地质构造特征[J]. 中国区域地质, 1997(2): 51-59. WEI D G, JIE Y J, HUANG T G. Regional geological structure of Fujian[J]. Regional Geology of China, 1997(2): 51-59(in Chinese).
[21] 谢其锋, 蔡元峰, 董云鹏, 等. 福建上杭地区燕山期花岗岩锆石U-Pb年代学及Hf同位素组成[J]. 地质学报, 2017, 91(10): 2212-2230. XIE Q F, CAI Y F, DONG Y P, et al. LA-ICP-MS zircon U-Pb geochronology and Hf isotopic compositions of yanshanian granites in the Shanghang area, Fujian Province[J]. Acta Geologica Sinica, 2017, 91(10): 2212-2230(in Chinese).
[22] 贺振宇, 颜丽丽, 褚平利, 等. 中国东南沿海晚白垩世长屿火山的活动过程与古环境意义[J]. 岩石学报, 2022, 38(5)1419-1442. doi: 10.18654/1000-0569/2022.05.10 HE Z Y, YAN L L, CHU P L, et al. Volcanological evolution and paleoenvironment of the late cretaceous changyu volcano in the coastal SE China[J]. Acta Petrologica Sinica, 2022, 38(5): 1419-1442(in Chinese). doi: 10.18654/1000-0569/2022.05.10
[23] HUANG Q T, ZHENG S P. Micro-relief research on active fault in the coast of southeast Fujian and adjacent area[J]. Progress in Geophysics, 2006: 1099-1107. [24] 林小平, 林木好. 福州市地热资源勘查开发利用现状及建议[J]. 上海地质, 2010(B11): 251-253, 257. LIN X P, LIN M H. Fuzhou geothermal resources exploration&exploitation situation and proposal[J]. Shanghai Geology, 2010, 31(B11): 251-253, 257(in Chinese).
[25] 张远城. 漳州地区地下热水的水文地质特征及映震效应[J]. 台湾海峡, 1993(3): 272-279. ZHANG Y C. Hydrogeogical characteristics of underground hot water from Zhangzhou region and its response to earthquake[J]. Journal of Oceanography in Taiwan Strait, 1993(3): 272-279(in Chinese).
[26] YAN Y C, ZHOU X C, LIAO L X, et al. Hydrogeochemical characteristic of geothermal water and precursory anomalies along the Xianshuihe fault zone, southwestern China[J]. Water, 2022, 14(4): 550. doi: 10.3390/w14040550 [27] ZHOU R L, ZHOU X C, LI Y, et al. Hydrogeochemical and isotopic characteristics of the hot springs in the Litang fault zone, southeast Qinghai–Tibet Plateau[J]. Water, 2022, 14(9): 1496. doi: 10.3390/w14091496 [28] BORA M, GOSWAMI D C. Water quality assessment in terms of water quality index (WQI): Case study of the Kolong River, Assam, India[J]. Applied Water Science, 2017, 7(6): 3125-3135. doi: 10.1007/s13201-016-0451-y [29] 徐祖信. 我国河流单因子水质标识指数评价方法研究[J]. 同济大学学报(自然科学版), 2005, 33(3)321-325. XU Z X. Single factor water quality identification index for environmental quality assessment of surface water[J]. Journal of Tongji University (Natural Science), 2005, 33(3): 321-325(in Chinese).
[30] WANG B, ZHOU X C, ZHOU Y S, et al. Hydrogeochemistry and precursory anomalies in thermal springs of Fujian (southeastern China) associated with earthquakes in the Taiwan strait[J]. Water, 2021, 13(24): 3523. doi: 10.3390/w13243523 [31] 范祖金, 魏兴, 李佳文, 等. 重庆市万州区浅层地下水化学特征及控制因素[J]. 环境化学, 2023, 42(1): 113-124. FAN Z J, WEI X, LI J W, et al. Chemical characteristics and controlling factors of shallow groundwater in Wanzhou district of Chongqing[J]. Environmental Chemistry, 2023, 42(1): 113-124 (in Chinese).
[32] 陈京鹏, 闫燕, 冯颖, 等. 黄河流域下游德州地区地下水水化学成因及生态环境影响[J]. 环境化学, 2023, 42(1): 125-137. doi: 10.7524/j.issn.0254-6108.2022081103 CHEN J P, YAN Y, FENG Y, et al. Hydrochemical genesis and ecological environment influence of groundwater in Dezhou city at lower Yellow River Basin[J]. Environmental Chemistry, 2023, 42(1): 125-137 (in Chinese). doi: 10.7524/j.issn.0254-6108.2022081103
[33] SRACEK O, WANKE H, NDAKUNDA N N, et al. Geochemistry and fluoride levels of geothermal springs in Namibia[J]. Journal of Geochemical Exploration, 2015, 148: 96-104. doi: 10.1016/j.gexplo.2014.08.012 [34] 欧浩, 卢国平, 胡晓农, 等. 广东省信宜-廉江地区地热水中氟的富集过程[J]. 环境化学, 2019, 38(5): 1128-1138. doi: 10.7524/j.issn.0254-6108.2018092303 OU H, LU G P, HU X N, et al. Fluoride enrichment in geothermal waters in Xinyi-Lianjiang region, Guangdong[J]. Environmental Chemistry, 2019, 38(5): 1128-1138(in Chinese). doi: 10.7524/j.issn.0254-6108.2018092303
[35] 李英, 吴平, 张勃, 等. 灵武市北部高氟地下水的分布特征及影响因素[J]. 环境化学, 2020, 39(9): 2520-2528. doi: 10.7524/j.issn.0254-6108.2019063002 LI Y, WU P, ZHANG B, et al. Distribution characteristics and formation factors of high fluoride groundwater in the north of Lingwu City[J]. Environmental Chemistry, 2020, 39(9): 2520-2528(in Chinese). doi: 10.7524/j.issn.0254-6108.2019063002
[36] 胡云虎. 皖北地下水源地水环境地球化学特征研究[D]. 淮南:安徽理工大学, 2015. Huainan:HU Y H. Study on geochemical features of groundwater source in north Anhui Province[D]. Anhui University of Science& Technology, 2015(in Chinese).
[37] 乌丽罕. 衡水地区高氟地下水化学特征及其成因[D]. 北京: 中国地质大学(北京), 2015. WU L H. Characteristics and genesis of high-fluoride groundwater in Hengshui city, the north China Plain[D]. Beijing: China University of Geosciences (Beijing), 2015(in Chinese).
[38] 吕晓立, 刘景涛, 周冰, 等. 塔城盆地地下水氟分布特征及富集机理[J]. 地学前缘, 2021, 28(2): 426-436. L X L, LIU J T, ZHOU B, et al. Distribution characteristics and enrichment mechanism of fluoride in the shallow aquifer of the Tacheng Basin[J]. Earth Science Frontiers, 2021, 28(2): 426-436(in Chinese).
[39] 梁礼革, 朱明占, 朱思萌, 等. 桂东地区地热水中氟的分布及其富集过程研究[J]. 安全与环境工程, 2015, 22(1): 1-6. LIANG L G, ZHU Z M, ZHU S M, et al. Spatial distribution and enrichment of fluoride in geothermal water from eastern guangxi, China[J]. Safety and Environmental Engineering, 2015, 22(1): 1-6(in Chinese).
[40] 孙红丽, 马峰, 刘昭, 等. 西藏高温地热显示区氟分布及富集特征[J]. 中国环境科学, 2015, 35(1): 251-259. SUN H L, MA F, LIU Z, et al. The distribution and enrichment characteristics of fluoride in geothermal active area in tibet[J]. China Environmental Science, 2015, 35(1): 251-259(in Chinese).
[41] ZHANG Y F, TAN H B, ZHANG W J, et al. Geochemical constraint on origin and evolution of solutes in geothermal springs in western Yunnan, China[J]. Geochemistry, 2016, 76(1): 63-75. doi: 10.1016/j.chemer.2015.11.002 [42] 谭梦如, 周训, 张彧齐, 等. 云南勐海县勐阿街温泉水化学和同位素特征及成因[J]. 水文地质工程地质, 2019, 46(3): 70-80. TAN M R, ZHOU X, ZHANG Y Q, et al. Hydrochemical and isotopic characteristics and formation of the Mengajie hot spring in Menghai County of Yunnan[J]. Hydrogeology & Engineering Geology, 2019, 46(3): 70-80(in Chinese).
[43] 李晓露. 云南洱源县牛街温泉的水化学特征与成因[D]. 北京: 中国地质大学(北京), 2017. LI X L. Hydrochemical characteristics and formation of the niujie hot springs in eryuan County of Yunnan[D]. Beijing: China University of Geosciences (Beijing), 2017(in Chinese).
[44] LIU M L, GUO Q H, WU G, et al. Boron geochemistry of the geothermal waters from two typical hydrothermal systems in Southern Tibet (China): Daggyai and Quzhuomu[J]. Geothermics, 2019, 82: 190-202. doi: 10.1016/j.geothermics.2019.06.009 [45] TIAN J, LI Y M, ZHOU X C, et al. Geochemical characteristics of hydrothermal volatiles from southeast China and their implications on the tectonic structure controlling heat convection[J]. Frontiers in Earth Science, 2021, 9: 786051. doi: 10.3389/feart.2021.786051 [46] RAHMAN M S, REZA A H M S, AHSAN M A, et al. Arsenic in groundwater from Southwest Bangladesh: Sources, water quality, and potential health concern[J]. HydroResearch, 2023, 6: 1-15. doi: 10.1016/j.hydres.2022.12.001 [47] ZHOU Y Z, TU Z, ZHOU J L, et al. Distribution, dynamic and influence factors of groundwater arsenic in the Manas River Basin in Xinjiang, PR China[J]. Applied Geochemistry, 2022, 146: 105441. doi: 10.1016/j.apgeochem.2022.105441 [48] 颜港归, 张庆华, 张鹏, 等. 高砷地下水分布特征与形成机理研究[J]. 地下水, 2022, 44(5): 16-18, 23. doi: 10.19807/j.cnki.DXS.2022-05-006 YAN G G, ZHANG Q H, ZHANG P, et al. Study on distribution characteristics and formation mechanism of high arsenic groundwater[J]. Ground Water, 2022, 44(5): 16-18, 23(in Chinese). doi: 10.19807/j.cnki.DXS.2022-05-006
[49] ZHANG H X, ZHANG W, WANG G L, et al. Distribution and genetic mechanism of high arsenic geothermal water in the Batang area, Western Sichuan[J]. Geothermics, 2021, 97: 102232. doi: 10.1016/j.geothermics.2021.102232 [50] JHA P K, TRIPATHI P. Arsenic and fluoride contamination in groundwater: A review of global scenarios with special reference to India[J]. Groundwater for Sustainable Development, 2021, 13: 100576. doi: 10.1016/j.gsd.2021.100576 [51] BHATTACHARYA P, CLAESSON M, BUNDSCHUH J, et al. Distribution and mobility of arsenic in the Río Dulce alluvial aquifers in Santiago del Estero Province, Argentina[J]. Science of the Total Environment, 2006, 358(1/2/3): 97-120. -


 下载:
下载:

