2022 Volume 41 Issue 1
Article Contents

YU Tao, LIU Yani, REN Lihong, YANG Xiaoyang, GAO Yuanguan, LI Gang, ZHANG Jiahao, CHEN Zhuojiong. Pollution characteristics and sources analysis of carbon components in PM2.5 in winter at typical coastal cities of China[J]. Environmental Chemistry, 2022, 41(1): 113-124. doi: 10.7524/j.issn.0254-6108.2020091503
Citation: YU Tao, LIU Yani, REN Lihong, YANG Xiaoyang, GAO Yuanguan, LI Gang, ZHANG Jiahao, CHEN Zhuojiong. Pollution characteristics and sources analysis of carbon components in PM2.5 in winter at typical coastal cities of China[J]. Environmental Chemistry, 2022, 41(1): 113-124. doi: 10.7524/j.issn.0254-6108.2020091503

Pollution characteristics and sources analysis of carbon components in PM2.5 in winter at typical coastal cities of China

  • Corresponding author: REN Lihong, renlh@craes.org.cn
  • Received Date: 15/09/2020
    Available Online: 27/01/2022
    Fund Project: Basic Scientific Research Funds in Nation Nonprofit Institutes of the Chinese Research Academy of Environmental Sciences (2019YSKY-025, JY-41375133) and National Natural Science Foundation of China (41705136)
  • To investigate the pollution characteristics and sources of carbonaceous species in PM2.5, samples were collected at three sites simultaneously from Dec.5, 2018 to Jan.30, 2019 in Tianjin (TJ), Shanghai(SH) and Qingdao(QD). The result showed that the average mass concentrations of PM2.5 were (116.96± 66.93), (31.21±25.62)μg·m−3 and (74.93 ±54.60 )μg·m−3. The spatial distribution of OC and EC shows the order of TJ (18.69 ±7.65)μg·m−3, (4.98 ±2.08 )μg·m−3) > QD (16.45 ±8.94)μg·m−3, (2.01 ±1.04) μg·m−3)> SH (7.28 ±3.11)μg·m−3, (1.05 ±1.25) μg·m−3). The good correlation between OC and EC indicated the similar OC and EC sources. The OC/EC ratios were 2.37—7.53, 5.47—46.41 and 4.77—13.36 at TJ, SH and QD, respectively, showing that SOC exists at all sampling sites. The SOC concentration was estimated by MRS (minimum r squared method). The average mass concentrations of SOC at three sampling sites were (5.09±4.68), (3.90±1.65) and (4.21±4.31) μg·m−3, accounting for 27.2%, 55.8% and 19.5% of the OC, respectively. Among them, the secondary carbonaceous pollution in SH is the most serious, and which is caused by severe pollution emissions and favorable meteorological conditions benefitting the secondary organic carbon formation, while carbon components in TJ and QD mainly comes from the primary emission. PCA analysis shows that the carbon components of PM2.5 at TJ are mainly from coal combustion, biomass combustion and motor vehicle exhaust, while at SH they are mainly from biomass combustion, road dust and motor vehicle exhaust. The carbon components at QD mainly come from road dust, motor vehicle exhaust and diesel vehicle exhaust. The backward trajectory analysis shows that the air mass from the northwest has a great influence on TJ, and the concentrations of PM2.5 and carbon components are the largest, while for the sties at SH and QD, the concentrations of carbon components and PM2.5 originating from the air mass in the middle of Hebei Province are the highest, indicating that the two cities are more affected by the transport of the surrounding areas.
  • 加载中
  • [1] 胡起超, 胡恭任, 于瑞莲, 等. 厦门市冬季大气PM2.5中有机碳和元素碳的污染特征 [J]. 地球与环境, 2016, 44(3): 336-341. HU Q C, HU G R, YU R L, et al. Pollution characteristics of organic carbon and elemental carbon in atmospheric PM2.5 in Xiamen in winter [J]. Earth and Environment, 2016, 44(3): 336-341(in Chinese).

    Google Scholar Pub Med

    [2] LI Q F, LING J, et al. Organic and elemental carbon in atmospheric fine particulate matter in an animal agriculture intensive area in North Carolina: Estimation of secondary organic carbon concentrations [J]. Open Journal of Air Pollution, 2013, 2(1): 7-18. doi: 10.4236/ojap.2013.21002

    CrossRef Google Scholar Pub Med

    [3] HUANG L, BROOK J, ZHANG W, et al. Stable isotope measurements of carbon fractions (OC/EC) in airborne particulate: A new dimension for source characterization and apportionment [J]. Atmospheric Environment, 2006, 40(15): 2690-2705. doi: 10.1016/j.atmosenv.2005.11.062

    CrossRef Google Scholar Pub Med

    [4] 关辽, 杨卓然, 马彤, 等. 成都市PM10中碳质气溶胶长期来源特点 [J]. 环境科学研究, 2018, 31(3): 435-441. GUAN L, YANG Z R, MA T, et al. Long-term source characteristics of carbonaceous aerosol in PM10 of Chengdu City, China [J]. Research of Environmental Sciences, 2018, 31(3): 435-441(in Chinese).

    Google Scholar Pub Med

    [5] MICHAEL S, JAN S, CLAUDIA C, et al. Comparative analysis of black carbon in soils [J]. Global Biogeochemical Cycles, 2001, 15(1): 163-167. doi: 10.1029/2000GB001284

    CrossRef Google Scholar Pub Med

    [6] ZHANG Y L, LIU D, SHEN C D, et al. Development of a preparation system for the radiocarbon analysis of organic carbon in carbonaceous aerosols in China [J]. Nuclear Instruments and Methods in Physics Research Section B:Beam Interactions with Materials and Atoms, 2010, 268(17): 2831-2834.

    Google Scholar Pub Med

    [7] YU S C, LI R L, DENNIS, et al. Primary and secondary organic aerosols over the United States: estimates on the basis of observed organic carbon (OC) and elemental carbon (EC), and air quality modeled primary OC/EC ratios [J]. Atmospheric Environment, 2004, 38(31): 5257-5268. doi: 10.1016/j.atmosenv.2004.02.064

    CrossRef Google Scholar Pub Med

    [8] 郑玫, 闫才青, 李小滢, 等. 二次有机气溶胶估算方法研究进展 [J]. 中国环境科学, 2014, 34(3): 555-564. ZHENG M, YAN C Q, LI X F, et al. Advances in estimation methods of secondary organic aerosols [J]. China Environmental Science, 2014, 34(3): 555-564(in Chinese).

    Google Scholar Pub Med

    [9] LIN J C C. Particle size distribution of aerosol carbons in ambient air [J]. Environment International, 1997, 23(4): 475-488. doi: 10.1016/S0160-4120(97)00029-9

    CrossRef Google Scholar Pub Med

    [10] PATHAK R K, WANG T, HO K F, et al. Characteristics of summertime PM2.5 organic and elemental carbon in four major Chinese cities: Implications of high acidity for water-soluble organic carbon (WSOC) [J]. Atmospheric Environment, 2011, 45(2): 318-325. doi: 10.1016/j.atmosenv.2010.10.021

    CrossRef Google Scholar Pub Med

    [11] LI Y C, YU J Z, HO S S H, et al. Chemical characteristics of PM2.5 and organic aerosol source analysis during cold front episodes in Hong Kong, China [J]. Atmospheric Research, 2012, 118(1): 41-51.

    Google Scholar Pub Med

    [12] 刘兴瑞, 马嫣, 崔芬萍, 等. 南京北郊一次重污染事件期间PM2.5理化特性及其对大气消光的影响 [J]. 环境化学, 2016, 35(6): 1164-1171. doi: 10.7524/j.issn.0254-6108.2016.06.2015111004 LIU X R, MA Y, CUI F P, et al. Physicochemical characteristics of PM2.5 and impacts on light extinction during the heavy pollution period at North Suburban Nanjing [J]. Environmental Chemistry, 2016, 35(6): 1164-1171(in Chinese). doi: 10.7524/j.issn.0254-6108.2016.06.2015111004

    CrossRef Google Scholar Pub Med

    [13] WATSON J G, CHOW J C. Comparison and evaluation of in situ and filter carbon measurements at the Fresno Supersite [J]. Journal of Geophysical Research Atmospheres, 2002, 107(D21): 8341.

    Google Scholar Pub Med

    [14] TAO J, ZHANG L M, LING G E, et al. Chemical composition of PM2.5 in an urban environment in Chengdu, China: Importance of springtime dust storms and biomass burning [J]. Atmospheric Research, 2013, 122(1): 270-283.

    Google Scholar Pub Med

    [15] 段凤魁, 贺克斌, 刘咸德, 等. 含碳气溶胶研究进展: 有机碳和元素碳 [J]. 环境工程学报, 2007, 1(8): 1-8. doi: 10.3969/j.issn.1673-9108.2007.08.001 DUAN F K, HE K B, LIU X D, et al. Research progress of carbonaceous aerosols: organic carbon and elemental carbon [J]. Journal of Environmental Engineering, 2007, 1(8): 1-8(in Chinese). doi: 10.3969/j.issn.1673-9108.2007.08.001

    CrossRef Google Scholar Pub Med

    [16] 李立伟, 戴启立, 毕晓辉, 等. 杭州市冬季环境空气 PM2.5中碳组分污染特征及来源 [J]. 环境科学研究, 2017, 30(3): 340-348. LI L W, DAI Q L, BI X H, et al. Characteristics and sources of carbonaceous species in atmospheric PM2.5 during winter in Hangzhou City [J]. Research of Environmental Sciences, 2017, 30(3): 340-348(in Chinese).

    Google Scholar Pub Med

    [17] 徐少才, 王静, 吴建会, 等. 青岛市PM2.5化学组分特征及综合来源解析 [J]. 中国环境监测, 2018, 34(4): 44-53. XU S C, WANG J, WU J H, et al. Analysis of chemical composition characteristics and comprehensive sources of PM2.5 in Qingdao [J]. China Environmental Monitoring, 2018, 34(4): 44-53(in Chinese).

    Google Scholar Pub Med

    [18] 张懿华, 王东方, 赵倩彪, 等. 上海城区PM2.5中有机碳和元素碳变化特征及来源分析 [J]. 环境科学, 2014, 35(9): 3263-3270. ZHANG Y H, HENRY W, ZHAO Q B, et al. Analysis on the variation characteristics and sources of organic carbon and elemental carbon in PM2.5 in urban areas of Shanghai [J]. Environmental Science, 2014, 35(9): 3263-3270(in Chinese).

    Google Scholar Pub Med

    [19] RYOU H G, HEO J, KIM S Y. Source apportionment of PM10 and PM2.5 air pollution, and possible impacts of study characteristics in South Korea [J]. Environmental Pollution, 2018, 240: 963-972. doi: 10.1016/j.envpol.2018.03.066

    CrossRef Google Scholar Pub Med

    [20] PARK E H, HEO J, HIRAKURA S, et al. Characteristics of PM2.5 and its chemical constituents in Beijing, Seoul, and Nagasaki [J]. Air Quality Atmosphere & Health, 2018, 11(10): 1167-1178.

    Google Scholar Pub Med

    [21] MORENO N, VIANA M, PANDOLFI M, et al. Determination of direct and fugitive PM emissions in a Mediterranean harbour by means of classic and novel tracer methods [J]. Journal of Environmental, Management, 2009, 91(1): 133-141. doi: 10.1016/j.jenvman.2009.07.009

    CrossRef Google Scholar Pub Med

    [22] 史国良, 陈刚, 田瑛泽, 等. 天津大气PM2.5中碳组分特征和来源分析 [J]. 环境污染与防治, 2016, 38(1): 1-7. SHI G L, CHEN G, TIAN M Z, et al. Analysis on the characteristics and sources of carbon components in atmospheric PM2.5 in Tianjin [J]. Environmental Pollution and Prevention, 2016, 38(1): 1-7(in Chinese).

    Google Scholar Pub Med

    [23] 高雅琴, 王红丽, 景盛翱, 等. 上海夏季PM2.5中有机物的组分特征、空间分布和来源 [J]. 环境科学, 2018, 39(5): 1978-1986. GAO Y Q, WANG H L, JING S X et al. Chemical characterization, spatial distribution, and source of organic identification of organic matter in PM2.5 in summertime Shanghai, China [J]. Environmental Science, 2018, 39(5): 1978-1986(in Chinese).

    Google Scholar Pub Med

    [24] 惠洪宽, 王敏, 潘晓杰, 等. 青岛市大气颗粒物PM2.5污染特征动态分析 [J]. 科学与管理, 2018, 38(2): 74-81. HUI H K, WANG M, PAN X J, et al. Dynamic analysis of PM2.5 pollution characteristics of atmospheric particulates in Qingdao [J]. Science and Management, 2018, 38(2): 74-81(in Chinese).

    Google Scholar Pub Med

    [25] ZHAO P, DONG F, YANG Y, et al. Characteristics of carbonaceous aerosol in the region of Beijing, Tianjin, and Hebei, China [J]. Atmospheric Environment, 2013, 71(3): 389-398.

    Google Scholar Pub Med

    [26] TAN J H, DUAN J, MA Y, et al. Long-term trends of chemical characteristics and sources of fine particle in Foshan City, Pearl River Delta: 2008–2014 [J]. Science of the Total Environment, 2016, 565(15): 519-528.

    Google Scholar Pub Med

    [27] XU J, WAND Q, DENG C, et al. Insights into the characteristics and sources of primary and secondary organic carbon: High time resolution observation in urban Shanghai [J]. Environmental Pollution, 2018, 233: 1177-1187. doi: 10.1016/j.envpol.2017.10.003

    CrossRef Google Scholar Pub Med

    [28] 霍静, 李彭辉, 韩斌, 等. 天津秋冬季PM2.5碳组分化学特征与来源分析 [J]. 中国环境科学, 2011, 31(12): 1937-1942. HUO J, LI P H, HAN B, et al. Chemical characteristics and source analysis of carbon components of PM2.5 in autumn and winter in Tianjin [J]. China Environmental Science, 2011, 31(12): 1937-1942(in Chinese).

    Google Scholar Pub Med

    [29] 高素莲, 范国兰, 侯鲁健, 等. 山东省沿海和内陆城市PM2.5中碳组分污染特征[C]. 中国环境科学学会学术年会论文集, 2016 (第三卷). GAO S L, FAN G L, HOU L J, et al. Pollution characteristics of carbon components in PM2.5 in coastal and inland cities of Shandong Province [C]. Proceedings of the Annual meeting of the Chinese Society of Environmental Science 2016 (Volume 3) (in Chinese).

    Google Scholar Pub Med

    [30] 庞博, 吉东生, 刘子锐, 等. 大气细颗粒物中有机碳和元素碳监测方法对比 [J]. 环境科学, 2016, 37(4): 1230-1239. PANG B, JI D S, LIU Z R, et al. Comparison of monitoring methods of organic carbon and element carbon in atmospheric fine particles [J]. Environmental Science, 2016, 37(4): 1230-1239(in Chinese).

    Google Scholar Pub Med

    [31] 李礼, 翟崇治, 王军, 等. 重庆市主城区大气水溶性离子在线观测分析 [J]. 中国环境监测, 2017, 33(57): 22-27. LI L, ZHAI C Z, WANG J, et al. On-line observation and analysis of atmospheric water-soluble ions in the main urban area of Chongqing [J]. Environmental Monitoring in China, 2017, 33(57): 22-27(in Chinese).

    Google Scholar Pub Med

    [32] KHAN B, HAYS M D, JETTER C G, et al. Differences in the OC/EC ratios that characterize ambient and source aerosols due to thermal-optical analysis [J]. Aerosol Ence & Technology, 2012, 46(2): 127-137.

    Google Scholar Pub Med

    [33] CHOW J C, WASTON J G, PRITCHETT L C, et al. The dri thermal/optical reflectance carbon analysis system: description, evaluation and applications in U. S. Air quality studies [J]. Atmospheric Environment Part A General Topics, 1993, 27(8): 1185-1201. doi: 10.1016/0960-1686(93)90245-T

    CrossRef Google Scholar Pub Med

    [34] HAN Y, CAO J, CHOW J C, et al. Evaluation of the thermal/optical reflectance method for discrimination between char- and soot-EC [J]. Chemosphere, 2007, 69(4): 569-574. doi: 10.1016/j.chemosphere.2007.03.024

    CrossRef Google Scholar Pub Med

    [35] 沙丹丹, 王红磊, 朱彬, 等. 冬季PM2.5中含碳气溶胶的污染特征——长江三角洲地区一次区域重污染过程分析 [J]. 中国环境科学, 2017, 37(10): 3611-3622. doi: 10.3969/j.issn.1000-6923.2017.10.002 SHA D D, WANG H L, ZHU B, et al. Pollution characteristics of carbonaceous aerosols in PM2.5 in winter—Analysis of a regional heavy pollution process in the Yangtze River Delta [J]. China Environmental Science, 2017, 37(10): 3611-3622(in Chinese). doi: 10.3969/j.issn.1000-6923.2017.10.002

    CrossRef Google Scholar Pub Med

    [36] 元洁, 刘保双, 程渊, 等. 2017年1月天津市区PM2.5化学组分特征及高时间分辨率来源解析研究 [J]. 环境科学学报, 2018, 38(3): 1090-1101. YUAN J, LIU B S, CHENG Y, et al. Study on characteristics of PM2.5 and chemical components and source apportionment of high temporal resolution in January 2017 in Tianjin urban area [J]. Acta Scientiae Circumstantiae, 2018, 38(3): 1090-1101(in Chinese).

    Google Scholar Pub Med

    [37] 程渊, 刘保双, 毕晓辉, 等. 天津市区夏冬季环境空气PM2.5中碳组分污染特征及来源研究 [J]. 环境科学学报, 2018, 38(9): 3394-3405. CHENG Y, LIU B S, BI X H, et al. Character and source analysis of carbonaceous aerosol in PM2.5 during summer-winter period, Tianjin urban area [J]. Acta Scientiae Circumstantiae, 2018, 38(9): 3394-3405(in Chinese).

    Google Scholar Pub Med

    [38] 周敏. 上海大气PM2.5来源解析对比: 基于在线数据运用3种受体模型[J]. 环境科学, 2020, 40(5): 1978-1986. ZHOU M. Source analysis and comparison of atmospheric PM2.5 in Shanghai: Three receptor models were used based on online data [J]. Environmental Science , 40(5): 1978-1986(in Chinese).

    Google Scholar Pub Med

    [39] 刘子贺, 常运华, 鲍孟盈, 等. 上海重霾期PM2.5碳质组分污染特征及来源分析 [J]. 科学技术与工程, 2019, 19(11): 333-343. LIU Z H, CANG Y H, BAO M Y, et al. Analysis on pollution characteristics and sources of carbonaceous components of PM2.5 in Shanghai during heavy season [J]. Science, Technology and Engineering, 2019, 19(11): 333-343(in Chinese).

    Google Scholar Pub Med

    [40] MING L, JIN L, LI J, et al. PM2.5 in the Yangtze River Delta, China: Chemical compositions, seasonal variations, and regional pollution events [J]. Environmental Pollution, 2017, 223: 200-212. doi: 10.1016/j.envpol.2017.01.013

    CrossRef Google Scholar Pub Med

    [41] WU R D, ZHOU X H, WANG L P, et al. PM2.5 Characteristics in Qingdao and across coastal cities in China [J]. Atmosphere, 2017, 8(4): 77.

    Google Scholar Pub Med

    [42] SCHAUER J J, MICHAEL J K, GLEN R C, et al. Measurement of emissions from air pollution sources. 5. C1-C32 organic compounds from gasoline-powered motor vehicles. [J]. Environmental ence & Technology, 2002, 35(9): 1716-28.

    Google Scholar Pub Med

    [43] CHEN Y, ZHI G, FENG Y, et al. Measurements of emission factors for primary carbonaceous particles from residential raw-coal combustion in China [J]. Geophysical Research Letters, 2006, 33(20): 382-385.

    Google Scholar Pub Med

    [44] SCHAUER J J, KLEEMAN M J, CASS G R, et al. Measurement of emissions from air pollution sources. 3. C-1-C-29 organic compounds from fireplace combustion of wood [J]. Environ, Technol, 2001, 2001,35(9): 1716-1728.

    Google Scholar Pub Med

    [45] HE L Y, HU M, HUANG X F, et al. Measurement of emissions of fine particulate organic matter from Chinese cooking [J]. Atmospheric Environment, 2004, 38(38): 6557-6564. doi: 10.1016/j.atmosenv.2004.08.034

    CrossRef Google Scholar Pub Med

    [46] CHOW J C, WATSON J G, LU Z Q, et al. Descriptive analysis of PM2.5 and PM10 at regionally representative locations during Sjvaqs/Auspex [J]. Atmospheric Environment, 1996, 30(12): 2079-2112. doi: 10.1016/1352-2310(95)00402-5

    CrossRef Google Scholar Pub Med

    [47] CHENG W, ZHEN T J. Determination of primary combustion source organic carbon-to-elemental carbon (OC/EC) ratio using ambient OC and EC measurements: secondary OC-EC correlation minimization method [J]. Atmospheric Chemistry & Physics, 2016, 16(8): 1-25.

    Google Scholar Pub Med

    [48] JI, D GAO S M, WILLY M, et al. The carbonaceous aerosol levels still remain a challenge in the Beijing-Tianjin-Hebei region of China: Insights from continuous high temporal resolution measurements in multiple cities. [J]. Environment International, 2019, 126: 171-183. doi: 10.1016/j.envint.2019.02.034

    CrossRef Google Scholar Pub Med

    [49] TURPIN B J, CARY R A, HUNTZICKER J J. An in situ, time-resolved analyzer for aerosol organic and elemental carbon [J]. Aerosol Science and Technology, 1990, 12(1): 161-171. doi: 10.1080/02786829008959336

    CrossRef Google Scholar Pub Med

    [50] CAO J J, LEE S C, CHOW J C, et al. Spatial and seasonal distributions of carbonaceous aerosols over China [J]. Journal of Geophysical Research Atmospheres, 2007, 112(D22): D22S11.

    Google Scholar Pub Med

    [51] LI W F, BAI Z P. Characteristics of organic and elemental carbon in atmospheric fine particles in Tianjin, China [J]. Particuology, 2009, 7(6): 432-437. doi: 10.1016/j.partic.2009.06.010

    CrossRef Google Scholar Pub Med

    [52] XU H M, CAO J J, CHOW J C, et al. Inter-annual variability of wintertime PM2.5 chemical composition in Xi'an, China: Evidences of changing source emissions [J]. Science of the Total Environment, 2016, 545: 546-555.

    Google Scholar Pub Med

    [53] HOW J C, WATSON J G, KUHNS H, et al. Source profiles for industrial, mobile, and area sources in the big bend regional aerosol visibility and observational study [J]. Chemosphere, 2004, 54(2): 185-208. doi: 10.1016/j.chemosphere.2003.07.004

    CrossRef Google Scholar Pub Med

    [54] KIM E, HOPKEB P K, EDGERTONC E S. Improving source identification of Atlanta aerosol using temperature resolved carbon fractions in positive matrix factorization [J]. Atmospheric Environment, 2004, 38(20): 3349-3362. doi: 10.1016/j.atmosenv.2004.03.012

    CrossRef Google Scholar Pub Med

    [55] WATSON J G, CHOW J C, LOWENTHAL D H, et al. Differences in the carbon composition of source profiles for diesel-and gasoline powered vehicles [J]. Atmospheric Environment, 1994, 28(15): 2493-2505. doi: 10.1016/1352-2310(94)90400-6

    CrossRef Google Scholar Pub Med

  • 加载中
通讯作者: 陈斌, bchen63@163.com
  • 1. 

    沈阳化工大学材料科学与工程学院 沈阳 110142

  1. 本站搜索
  2. 百度学术搜索
  3. 万方数据库搜索
  4. CNKI搜索

Figures(5)  /  Tables(4)

Article Metrics

Article views(3233) PDF downloads(45) Cited by(0)

Access History

Pollution characteristics and sources analysis of carbon components in PM2.5 in winter at typical coastal cities of China

Fund Project: Basic Scientific Research Funds in Nation Nonprofit Institutes of the Chinese Research Academy of Environmental Sciences (2019YSKY-025, JY-41375133) and National Natural Science Foundation of China (41705136)

Abstract: To investigate the pollution characteristics and sources of carbonaceous species in PM2.5, samples were collected at three sites simultaneously from Dec.5, 2018 to Jan.30, 2019 in Tianjin (TJ), Shanghai(SH) and Qingdao(QD). The result showed that the average mass concentrations of PM2.5 were (116.96± 66.93), (31.21±25.62)μg·m−3 and (74.93 ±54.60 )μg·m−3. The spatial distribution of OC and EC shows the order of TJ (18.69 ±7.65)μg·m−3, (4.98 ±2.08 )μg·m−3) > QD (16.45 ±8.94)μg·m−3, (2.01 ±1.04) μg·m−3)> SH (7.28 ±3.11)μg·m−3, (1.05 ±1.25) μg·m−3). The good correlation between OC and EC indicated the similar OC and EC sources. The OC/EC ratios were 2.37—7.53, 5.47—46.41 and 4.77—13.36 at TJ, SH and QD, respectively, showing that SOC exists at all sampling sites. The SOC concentration was estimated by MRS (minimum r squared method). The average mass concentrations of SOC at three sampling sites were (5.09±4.68), (3.90±1.65) and (4.21±4.31) μg·m−3, accounting for 27.2%, 55.8% and 19.5% of the OC, respectively. Among them, the secondary carbonaceous pollution in SH is the most serious, and which is caused by severe pollution emissions and favorable meteorological conditions benefitting the secondary organic carbon formation, while carbon components in TJ and QD mainly comes from the primary emission. PCA analysis shows that the carbon components of PM2.5 at TJ are mainly from coal combustion, biomass combustion and motor vehicle exhaust, while at SH they are mainly from biomass combustion, road dust and motor vehicle exhaust. The carbon components at QD mainly come from road dust, motor vehicle exhaust and diesel vehicle exhaust. The backward trajectory analysis shows that the air mass from the northwest has a great influence on TJ, and the concentrations of PM2.5 and carbon components are the largest, while for the sties at SH and QD, the concentrations of carbon components and PM2.5 originating from the air mass in the middle of Hebei Province are the highest, indicating that the two cities are more affected by the transport of the surrounding areas.

  • 大气细颗粒物(PM2.5)对全球空气质量和人类健康都有重要的作用。碳组分是PM2.5的主要组成成分之一[1] ,主要包括有机碳(OC)和元素碳(EC)及少量的碳酸盐酸(CC),其中 CC 含量不超过总碳(TC)的5%,故不考虑[2-3]。一般认为EC为惰性污染物,主要来自燃料的不完全燃烧,由污染源直接排放,环境中的EC主要分为焦炭(Char-EC)和烟炱(Soot-EC) 2个部分 [4-5],Char-EC定义为燃料燃烧后固体残渣中的EC,Soot-EC定义为燃烧后气相挥发物质再凝结形成的EC。OC包括一次有机碳(POC)和二次有机碳(SOC)[6-8]。有研究表明,大气中85%的EC和82%的OC均富集于PM2.5[9]。OC和EC对大气消光和人体健康等都产生重要影响[10-12]。其中EC具有石墨样的结构,是光吸收的主要贡献者[13];OC可以散射光,并与EC一起对云的性质产生影响,从而对辐射强迫产生影响[14],因此对碳组分的研究一直是国内外研究热点[15]。李立伟等[16]研究了京津冀区域PM2.5中碳组分污染特征,发现京津冀区域有显著的SOC生成。徐少才等[17]对青岛市PM2.5化学组分特征研究发现PM2.5中占比较高的是碳组分且存在SOC污染。张懿华等[18]对上海城区PM2.5中OC和EC进行了研究,发现生物质燃烧、燃煤排放以及道路尘是上海城区PM2.5中碳组分的主要来源。Ryou等[19]对韩国PM10和PM2.5的来源研究发现机动车和二次气溶胶是韩国PM2.5影响最大的来源。Park等[20]对北京、首尔和长崎PM2.5及其化学成分特征研究发现要在东亚地区实施有效的PM2.5减排计划,应同时考虑PM2.5的长距离输送来源和本地来源。

    由于人类在沿海地区进行如海上运输、港口作业和建筑活动等频繁活动,许多关于PM2.5组成和来源的研究已在沿海城市进行[21]。天津不仅是华北地区的超大城市之一,也是重要的港口城市,近些年天津作为“京津冀一体化”大气污染联防联控的重要一环,大气污染状况一直是关注的热点[22];而位于长江三角洲入海口的上海既是中国南方特大商业和工业城市,也是世界上最大的港口之一[23]。青岛是东部沿海地区重要的度假旅游城市,虽然主城区的PM2.5颗粒物研究时间较早[24]。但总体而言,目前,对中国沿海地区的研究均只集中在其中某一区域(如京津冀、长三角和珠三角),或只是单纯的针对某一个城市的浓度、来源解析以及对人体健康影响等方面的研究[25-26],对北方和南方城市进行多点位同步观测研究十分有限[27-29],不能完全反映PM2.5中碳组分整体污染特征,对碳组分来源及形成机制的认识还不够充分。本次研究的3个典型沿海城市分别为北方的天津和青岛以及南方的上海,天津和青岛是我国北方重要的工业城市,近年来随着城市经济和交通运输快速发展,大气环境压力增大。上海是一个人口稠密且经济发达的超大型城市,其环境空气质量的变化与人们的生活密切相关,备受关注。

    本研究于2018年12月5日—2019年1月30日,对中国典型沿海城市(天津、上海和青岛)3个站点PM2.5滤膜样品同步进行采集和分析,对比研究PM2.5中OC、EC的浓度水平及污染特征、结合SOC的污染特征,同时利用PCA、后向轨迹对碳组分的来源及传输路径进行分析。研究结果将有助于全面地了解中国典型沿海城市PM2.5中碳组分的演变特征,对大气污染防治工作提供参考依据。

    • 本研究于2018年12月5日—2019年1月30日,在中国3个典型沿海城市天津、上海和青岛城市的3个采样点对PM2.5同步开展滤膜采样,采样时段为每日10:00—次日 09:00,每日各采集1个样品,共采集有效 PM2.5 样品113个,其中天津33个、上海30个和青岛50个。各采样点的详细描述见表1

    • 采样仪器选用国产武汉天虹TH16-A型四通道采样器进行采样,采样流量为每个通道16.7 L·min−1。在每个受体采样点位放置1台采样器采样,一台采样器有4个通道,同时采集2个PM2.5和2个PM10样品,其中两张特氟龙膜(P膜)采集PM2.5和PM10的无机元素,两张石英滤膜(Q膜)采集PM2.5和PM10的碳组分和水溶性离子。采样前将Q膜以 800 ℃在马弗炉中烘焙2 h,冷却至室温后放入恒温恒湿箱中平衡72 h。采样前后滤膜的称重使用精度为十万分之一(10 μg)的电子天平进行称量,且天平室温度应维持在15—35 ℃之间,相对湿度<40%。滤膜称量前须经过静电消除器去除静电,并做到快速称重滤膜,称量1次后,再次放入干燥器内,隔24 h进行第2次称重,每次称重滤膜至衡重,结果精确至0.1 mg并保证2次称量之差不大于0.5 mg即为衡重。样品采集完毕后将采完样品的滤膜先放置玻璃干燥器中,当需称重时重复空白滤膜的称重程序,计算两次的称重差,做浓度的计算。

      碳组分分析使用热/光碳气溶胶分析仪(Sunset Laboratory Inc,美国),采用热光透射法(Thermal-optical transmission,TOT),遵循美国EPA推荐的NIOSH 4050分析方法[30-31],分别得到OC的4个组分(OC1、OC2、OC3、OC4)和EC的3个组分(EC1、EC2、EC3),其中OC被定义为 OC1+OC2+OC3+OC4+OPC, EC 定义为 EC1+EC2+EC3-OPC[32-33]。Han等[34]的研究,将EC分为Char-EC和Soot-EC,Char-EC 定义为 EC1-OPC,Soot-EC定义为EC2+EC3。

    • (1)样品分析前后,采用 CH4/CO2标准气体对仪器进行校正;

      (2)每15个样品中随机抽出 1个进行平行分析,每周进行2次标准样品的测量,标准样品的回收率为98%—102%;

      (3) 每周测量仪器的系统空白以及实验室空白。

    2.   结果与讨论 (Results and discussion)
    • 图1可知,采样期间天津、上海和青岛的3个站点PM2.5的日浓度变化范围分别为50.66—280.79、8.15—113.07、12.19—273.53 μg·m−3,均值分别为(116.96±66.93)、(31.21±25.62)、(74.93±54.60)μg·m−3(表2)。3个站点中天津和青岛PM2.5平均质量浓度均超过我国二级日均标准值(75 μg·m−3)的1.6倍和1.0倍,其中天津污染最为严重。采样期间3个站点日浓度PM2.5的超标率分别为66.7%、6.7%和34.0%。整体来看,中国典型沿海城市冬季大气污染较为严重。

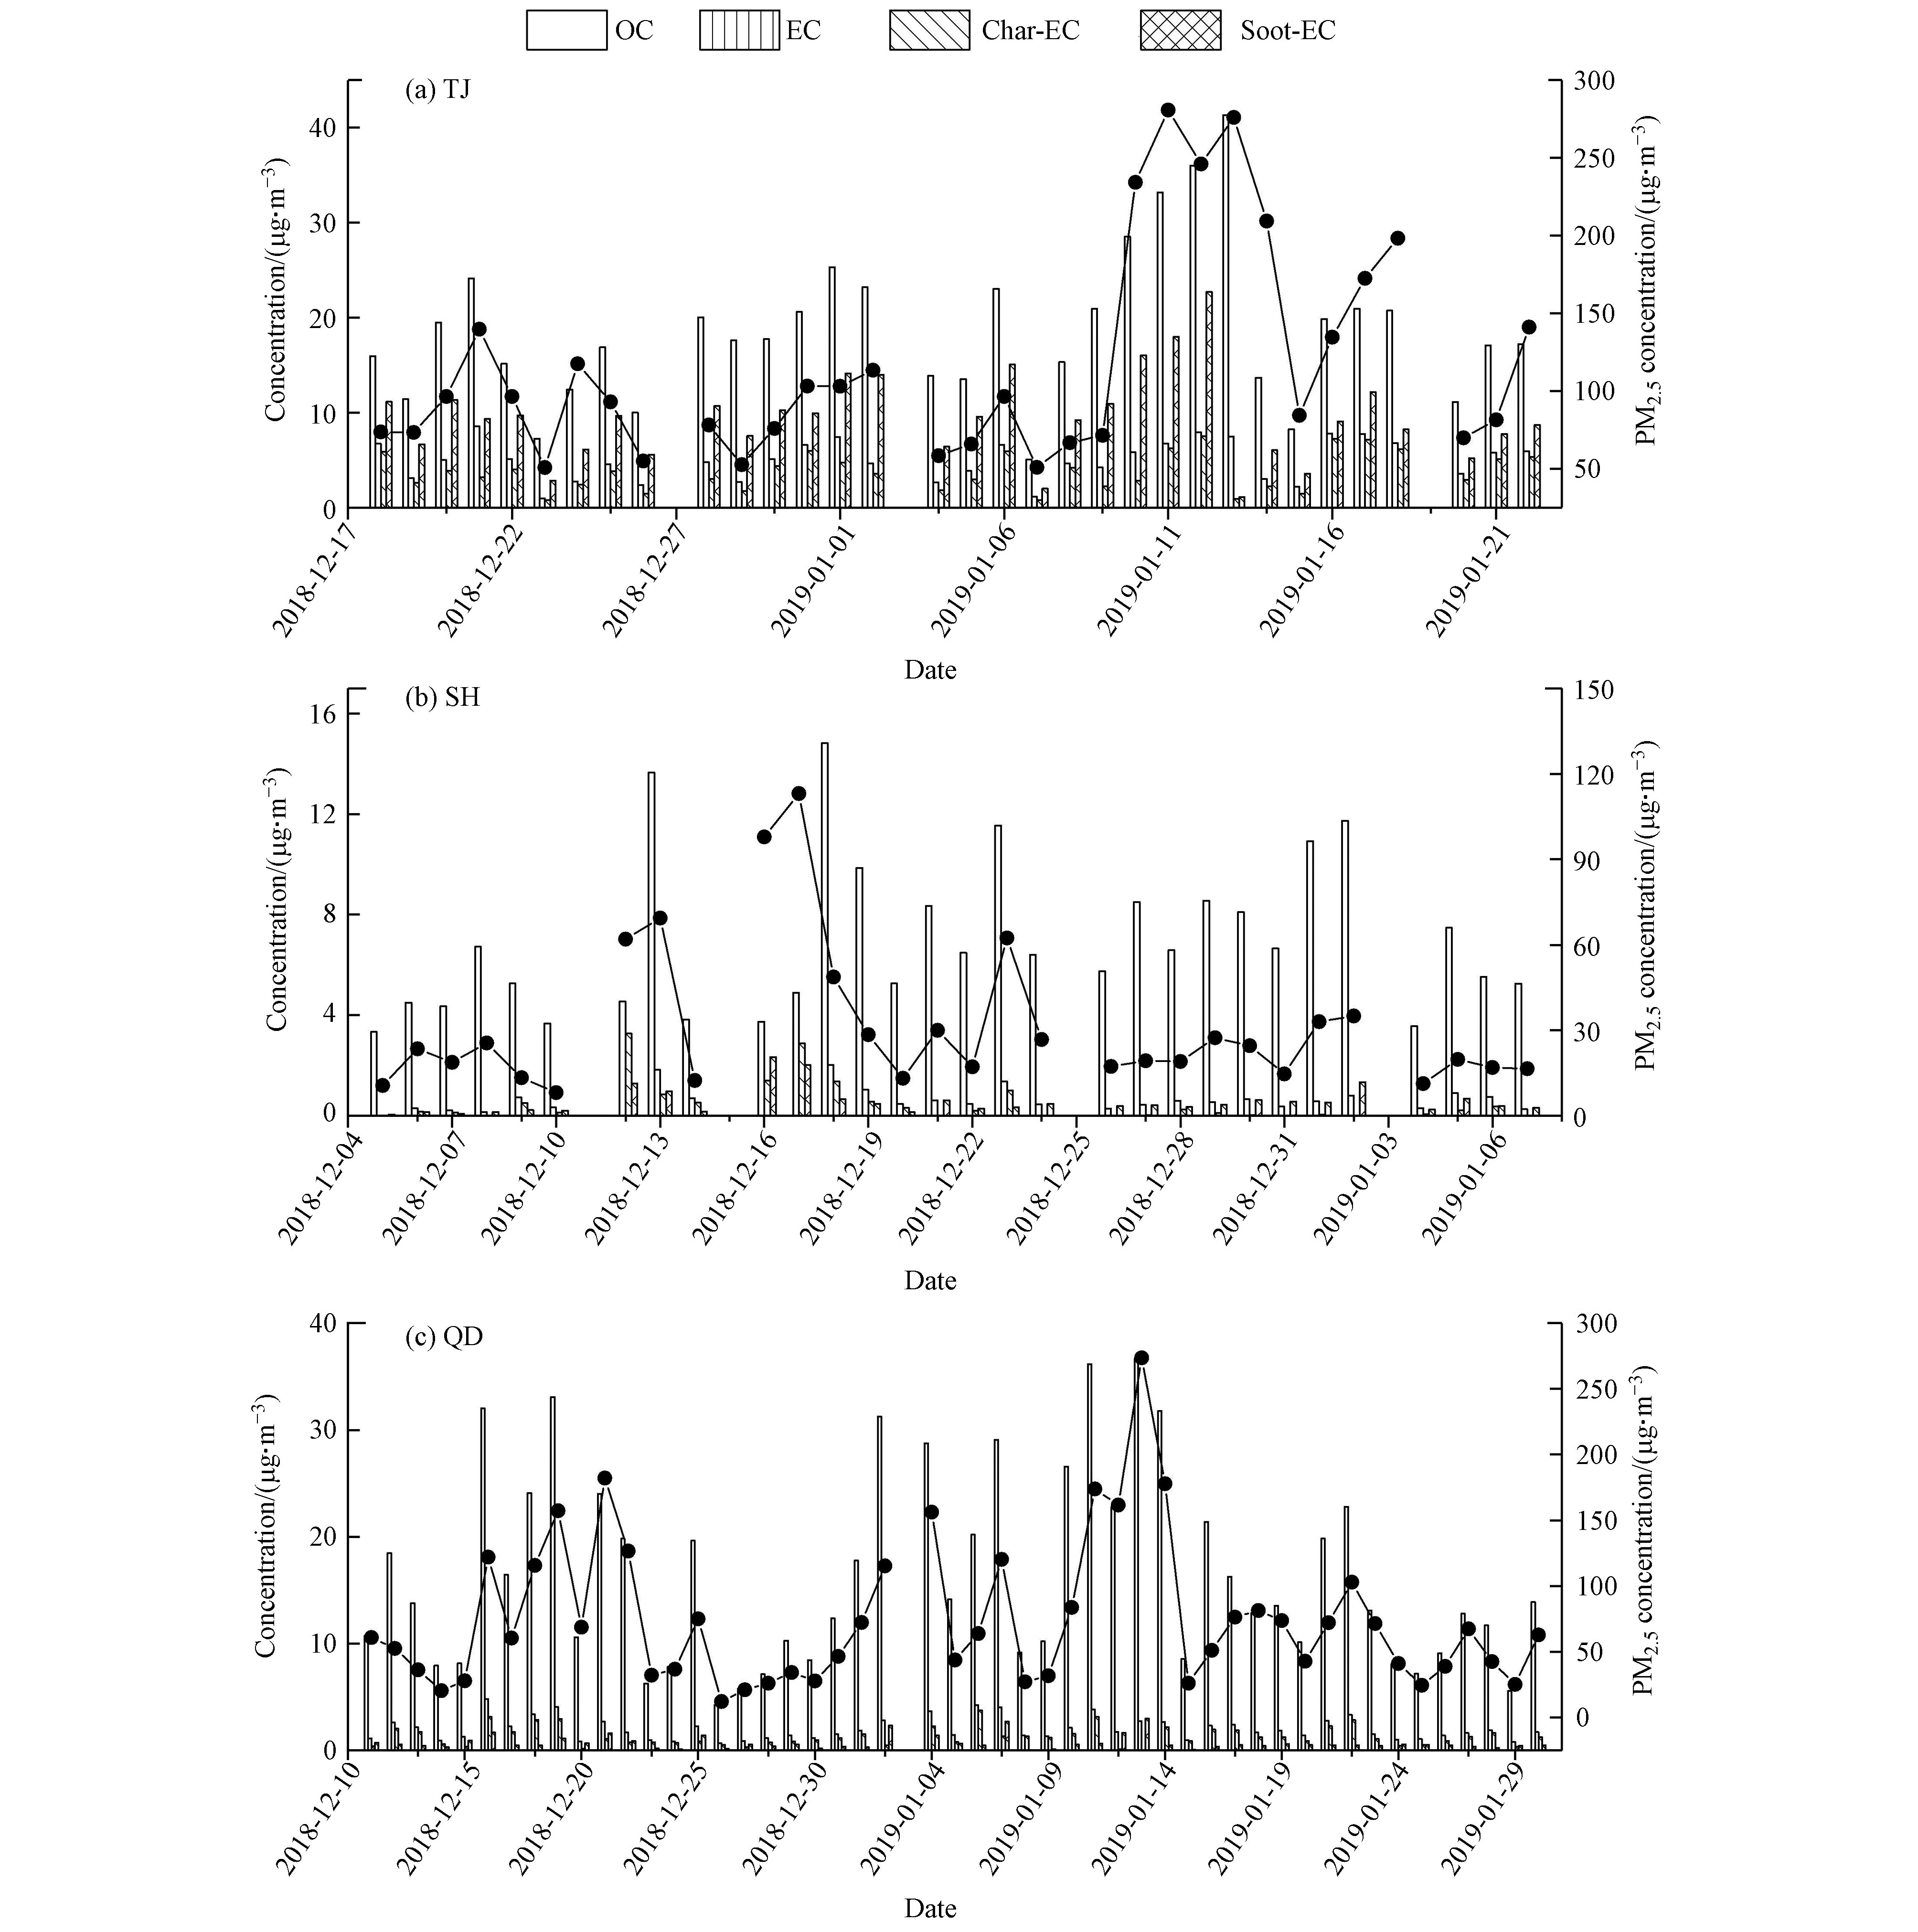
      天津、上海和青岛3个站点的OC质量浓度分别为(18.69±7.95)、(7.28±3.11)、(16.45±8.94)μg·m−3,EC的质量浓度分别为(4.98±2.08)、(1.05±1.25)、(2.01±1.04)μg·m−3,OC和EC浓度空间变化相似,均为天津>青岛>上海。天津、上海和青岛的3个站点Char-EC的质量浓度分别为(3.77±1.97)、(0.60±0.87)、(1.33±0.88)μg·m−3,Soot-EC的质量浓度分别为(9.41±4.57)、(0.56±0.54)、(0.71±0.63)μg·m−3。char-EC和Soot-EC的浓度均与各自的EC浓度变化趋势一致 [35]。整个采样期间,天津、上海和青岛PM2.5中TC(TC=OC+EC)的平均质量浓度为(23.66±9.65)、(7.57±3.49)、(18.47±9.85)μg·m−3,占PM2.5的比例分别为24.8%、22.1%和31.3%。由此可见,碳组分是PM2.5的重要组成部分。

      表2可知,与之前对这3个城市PM2.5碳组分研究结果相比,本研究的OC和EC浓度都有所下降,天津OC下降了4.8 μg·m−3,EC下降了1.1 μg·m−3,浓度下降比例分别为20.4%和13.5%;上海OC下降了5.2 μg·m−3,EC下降了2 μg·m−3,下降比例分别为37.9%和66.7%;青岛OC下降了4.8 μg·m−3,EC下降了0.6 μg·m−3,下降比例分别为22.5%和23.1%,表明天津、上海和青岛冬季PM2.5中碳组分浓度较同期有所降低,这与近年来这3个城市开展的一系列大气污染防治工作如机动车限行、清洁取暖和污染企业整治等管控措施密切相关。

    • OC/EC的比值可以初步判断PM2.5中碳组分的来源,研究表明,当OC/EC值为1.0—4.2时,表明污染源为机动车尾气的排放[42];当OC/EC为2.5—10.5时,表明污染源为燃煤[43];当OC/EC为4.1—14.5时,表明污染源为生物质燃烧[44];当OC/EC为32.9—81.6时,表明污染源主要由烹调排放造成[45]

      中国典型沿海城市3个站点天津、上海和青岛OC/EC比值分别为4.03、14.13和8.20,根据OC/EC比值可初步判断天津受到机动车尾气的影响,上海受生物质燃烧的影响,青岛主要受燃煤的影响。研究表明[33],OC/EC比值大于2,表明二次有机碳SOC存在[46]。天津、上海和青岛OC/EC远大于2,表明这3个城市冬季存在二次有机碳污染。

      大气中挥发性有机物(VOCs)通过气粒反应形成的有机碳即为SOC。Turpin等最先提出将EC作为POC的示踪物,得到SOC的浓度。提出的经验公式如下:

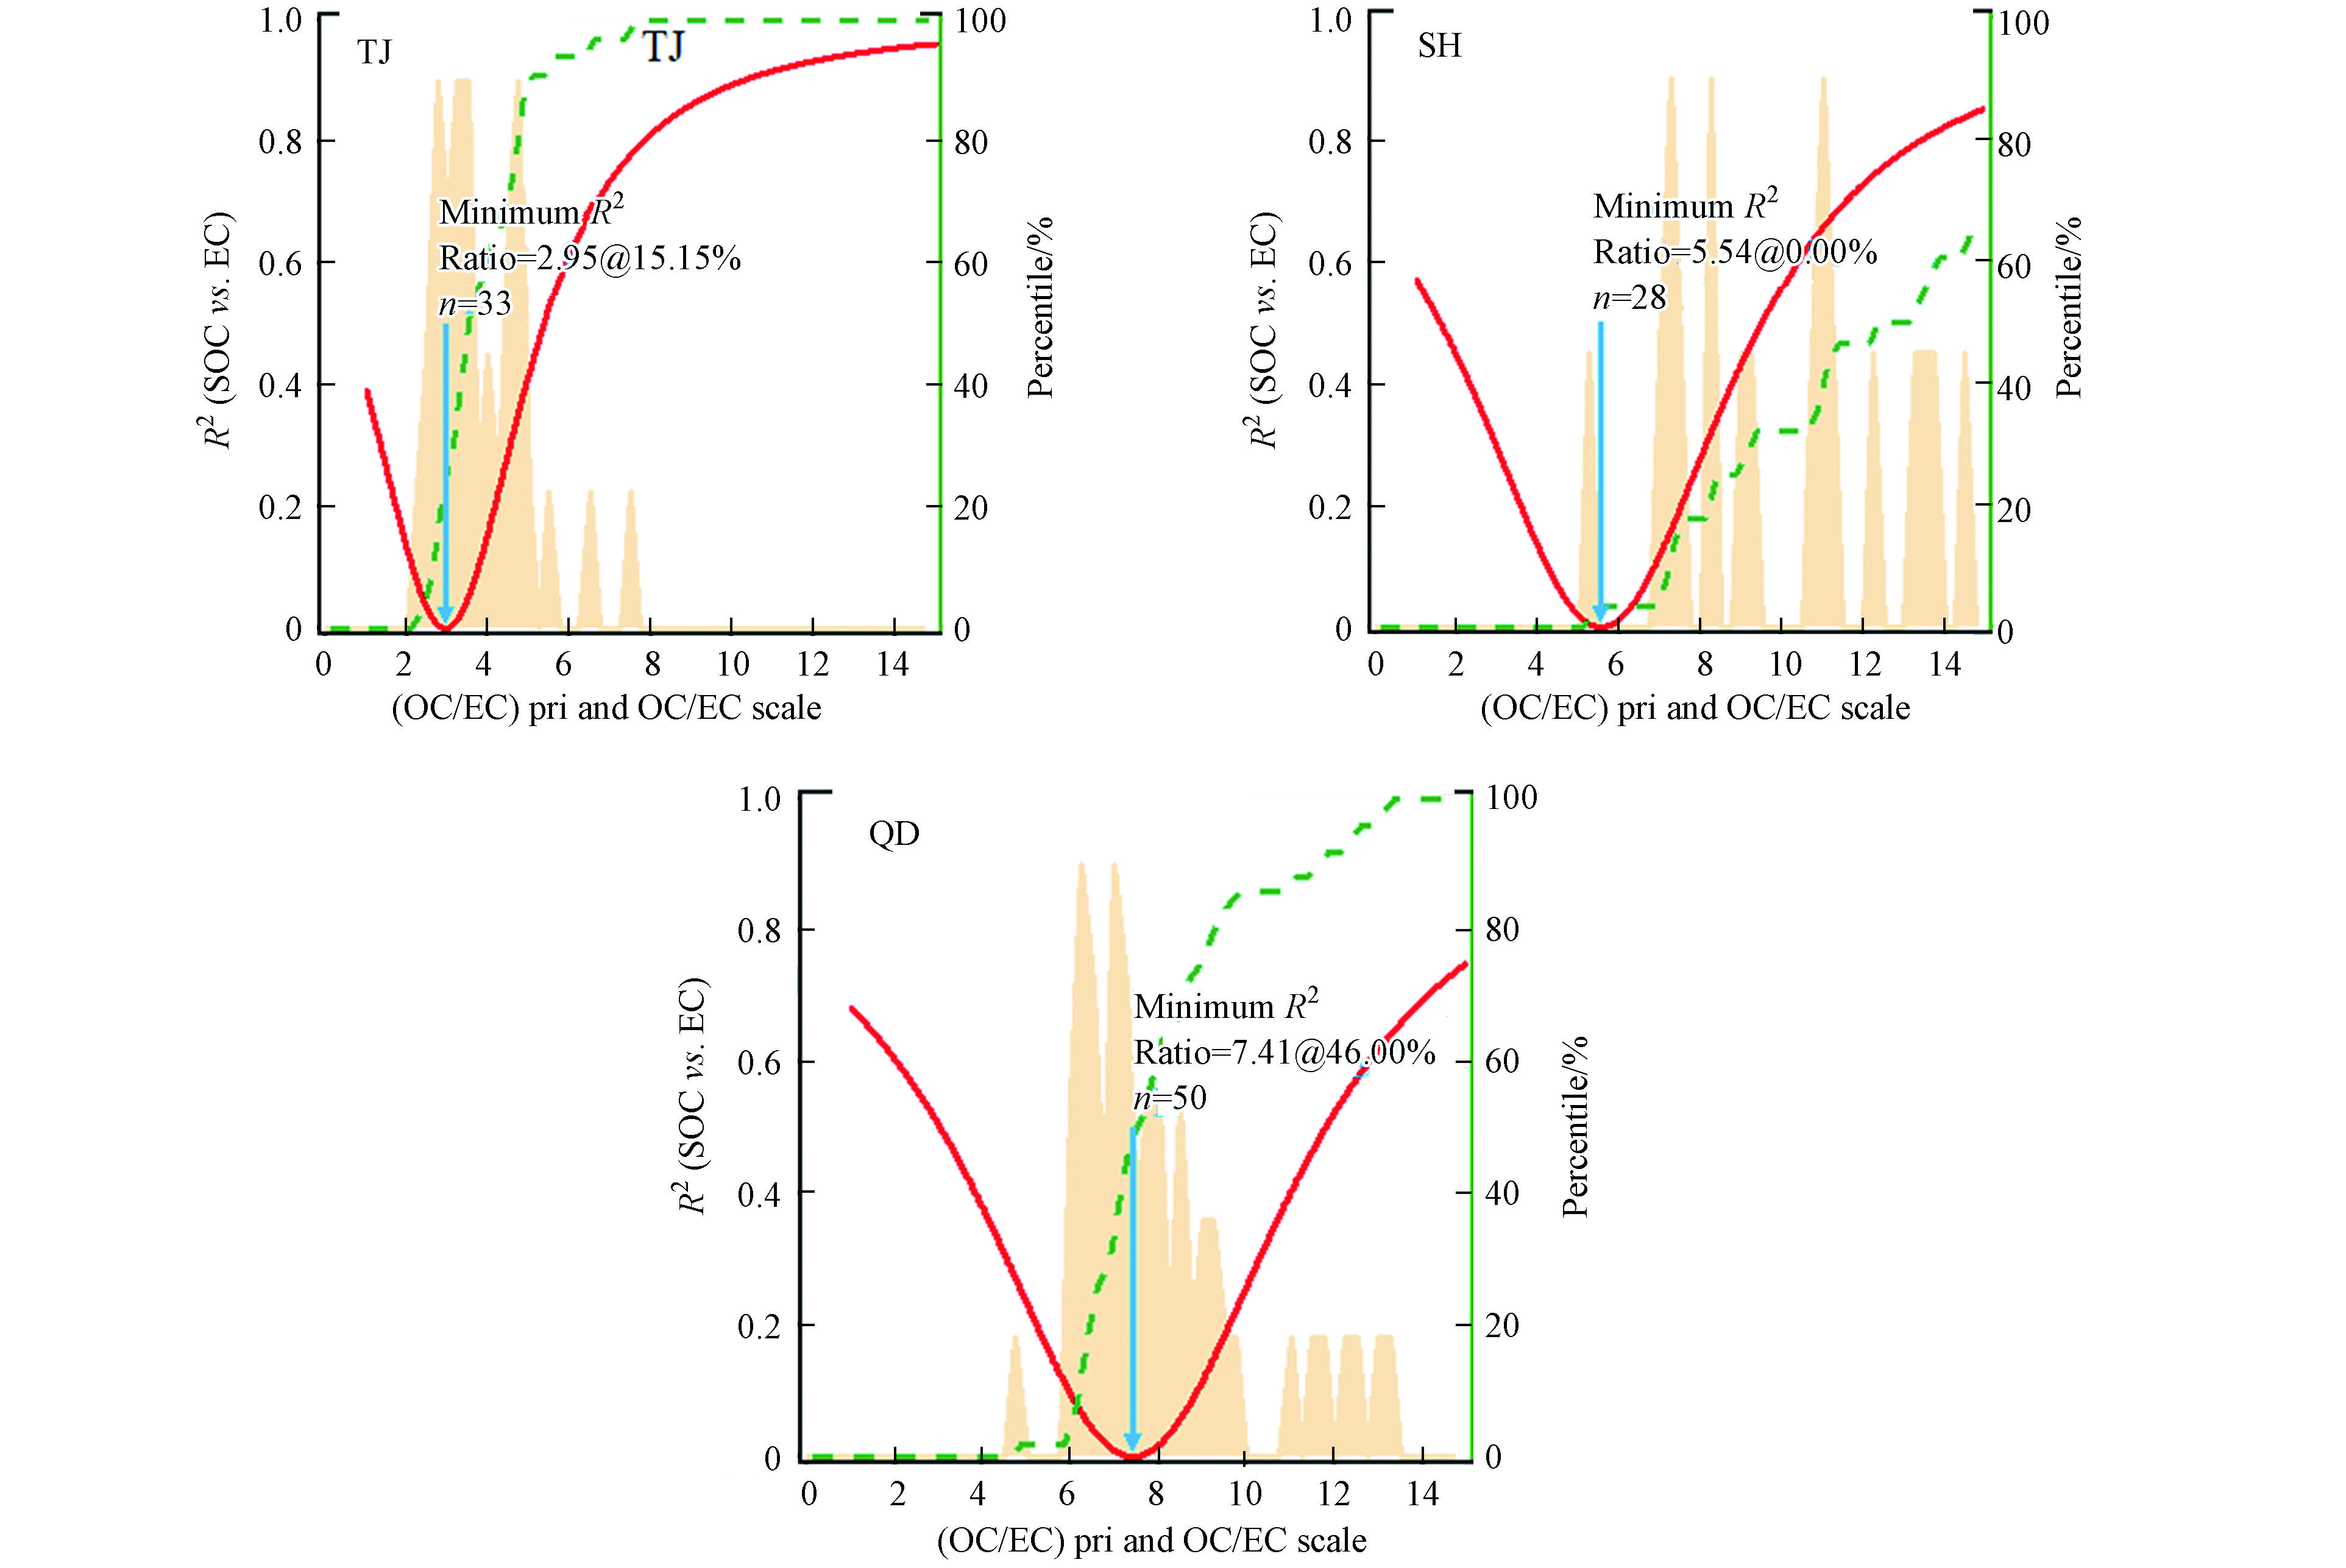
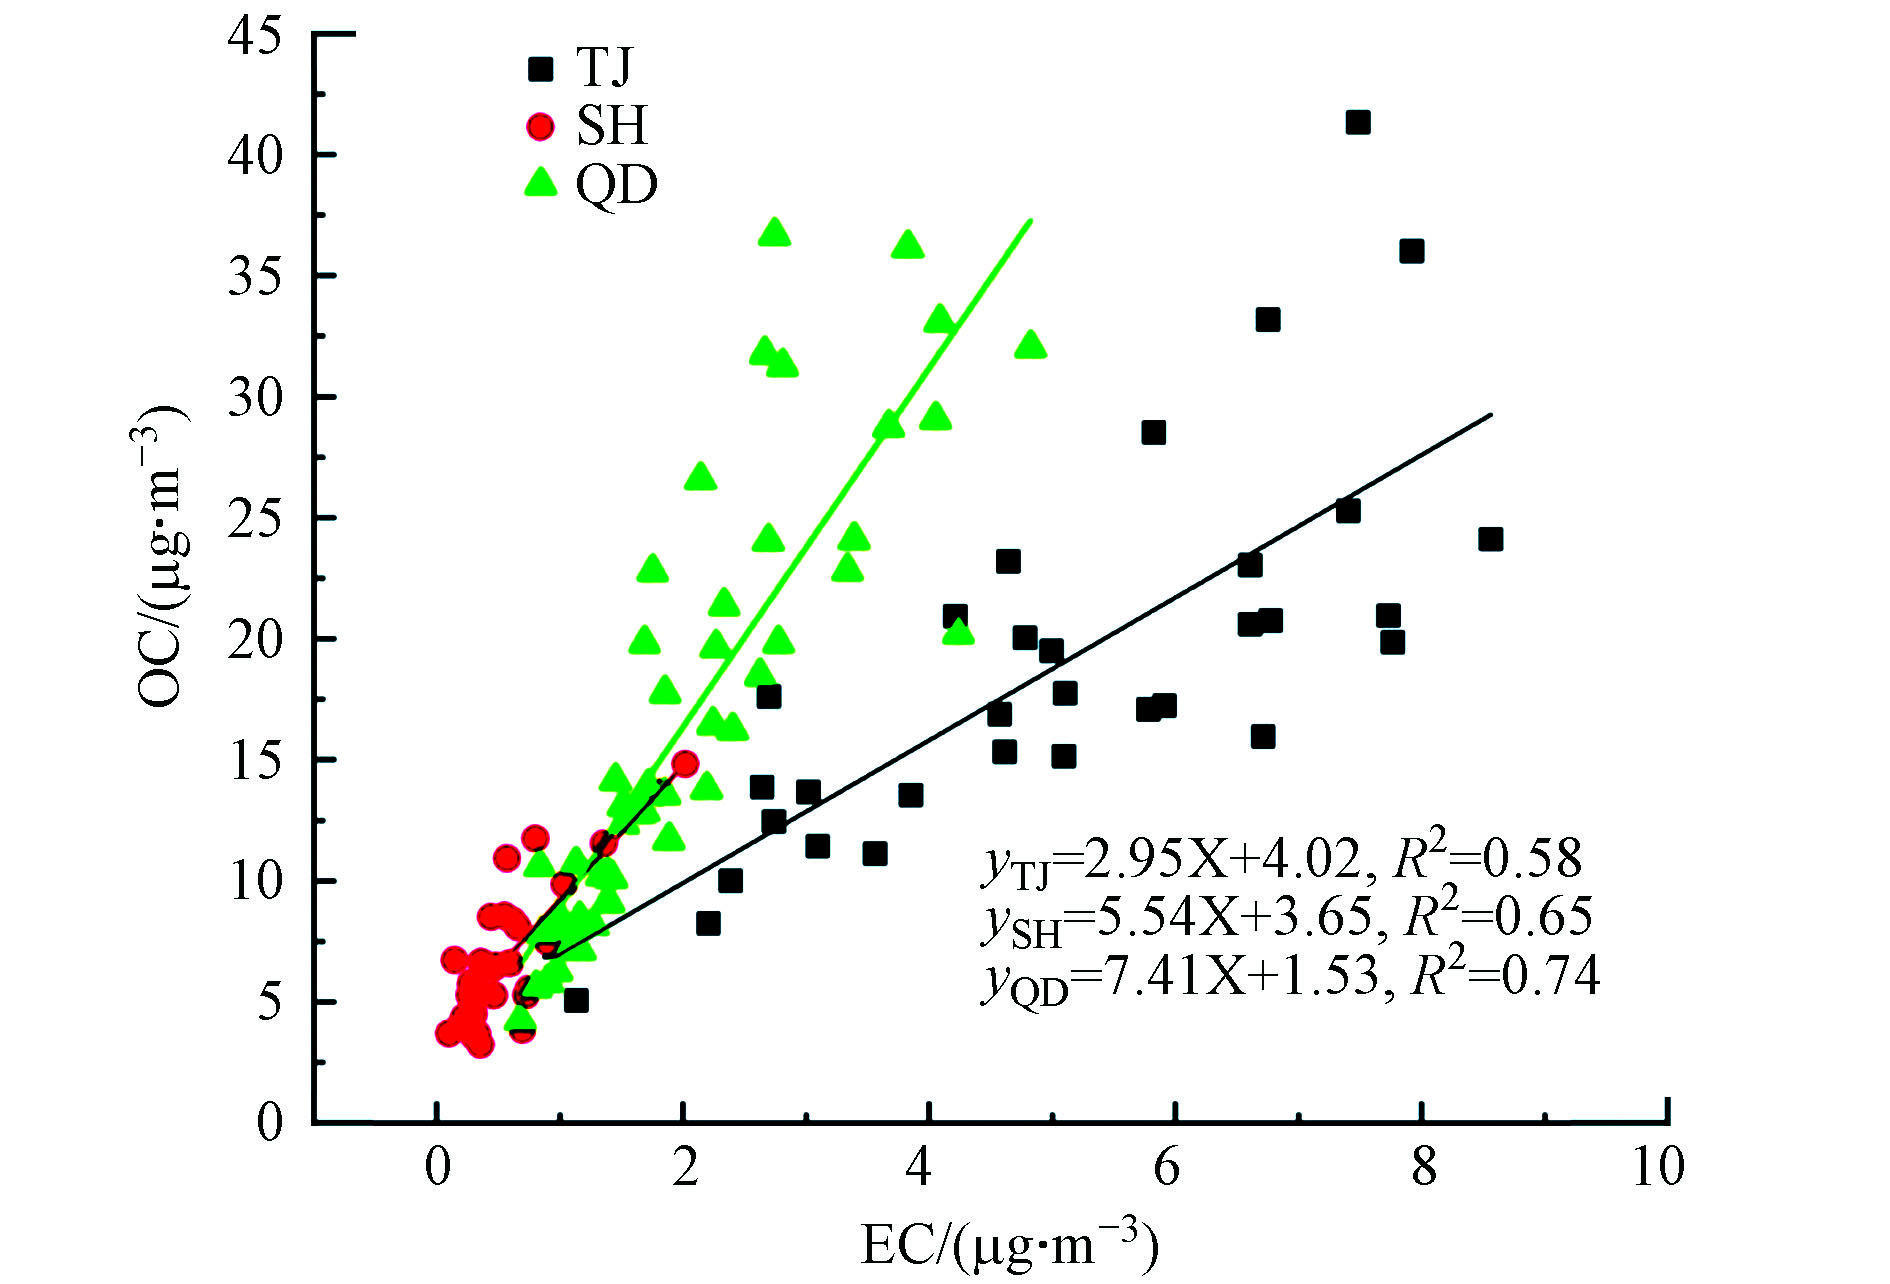
      式中,POC、SOC分别为一次和二次有机碳的质量浓度,μg·m−3;OC和EC分别表示采样期间OC和EC的日均浓度值,μg·m−3;(OC/EC)pri指一次排放到大气中的OC/EC的比值。关于(OC/EC)pri的确定,通常采用OC/EC最小值法和MRS(最小R平方法) [47]确定。本文采用MRS(minimum r squared method,MRS)法对SOC进行估算。该方法假设连续的(OC/EC)pri值计算SOC,计算得到的SOC与EC做相关性分析,得到最小R2值对应的(OC/EC)pri值为所需的(OC/EC)pri值,此时SOC与EC相关性最差,说明二次污染影响最弱,可以更好地反映SOC的污染特征。如图2所示,用MRS法估算的天津、上海和青岛的(OC/EC)pri值分别为2.95、5.54和7.41。代入式(1),3个点位的SOC浓度为(5.09±4.68)、(3.90±1.65)和(4.21±4.31)μg·m−3,分别占OC总量的27.2%、55.8%和19.5%。

      为了验证本研究中该方法的适用性,同时用OC/EC最小值法估算了SOC。用最小比值法计算出来的天津、上海和青岛的站点SOC浓度分别为(6.89±5.19)、(4.19±2.00)、(6.99±5.27)μg·m−3,占OC总量的36.2%、59.3%和39.7%。尽管有文献报道由于冬季较低的温度有利于半挥发性有机物(SVOCs)凝结到既有颗粒中虽然会导致用MRS法计算时高估(OC/EC)pri值[48],但在本研究中MRS方法的结果与OC/EC最小值法所获取的结果较为接近,表明用MRS计算的结果可信。SOC在OC中的占比顺序为上海>天津>青岛。这两种方法计算出来的SOC在OC中的占比情况差距不大。这3个站点SOC在OC中的占比为36.2%—59.3%,表明二次污染较为严重。3个城市SOC的浓度差异可能还与其他许多因素有关,包括挥发性有机化合物(VOCs)的类型和浓度以及大气氧化能力的差异。在前人对这3个城市的PM2.5研究中,SOC对OC的贡献率分别为35.7%、38.9%和38.0%[28-29,18],可以发现本研究SOC对OC的贡献率与先前的研究结果类似。

    • OC与EC的相关性在一定程度上能够区分碳组分的来源,强的相关性表明二者具有相似的污染源[49]。如图3所示天津、上海和青岛PM2.5中OC与EC的相关系数R2分别为0.58(P<0.01)、0.65(P<0.01)和0.74(P<0.01),说明这3个采样点冬季PM2.5中OC和EC二者相关性均较强,表明OC和EC的来源一致。根据经验[50],OC与 EC的回归方程OC = b×EC+a中,b×EC项代表了燃烧源直接排放的OC,a项表明非燃烧源产生的OC。在图3中,天津、上海和青岛点位的a项分别为4.02、3.65和1.53,其中天津和上海明显高于青岛,表明天津和上海可能受到非燃烧源的影响比青岛大。

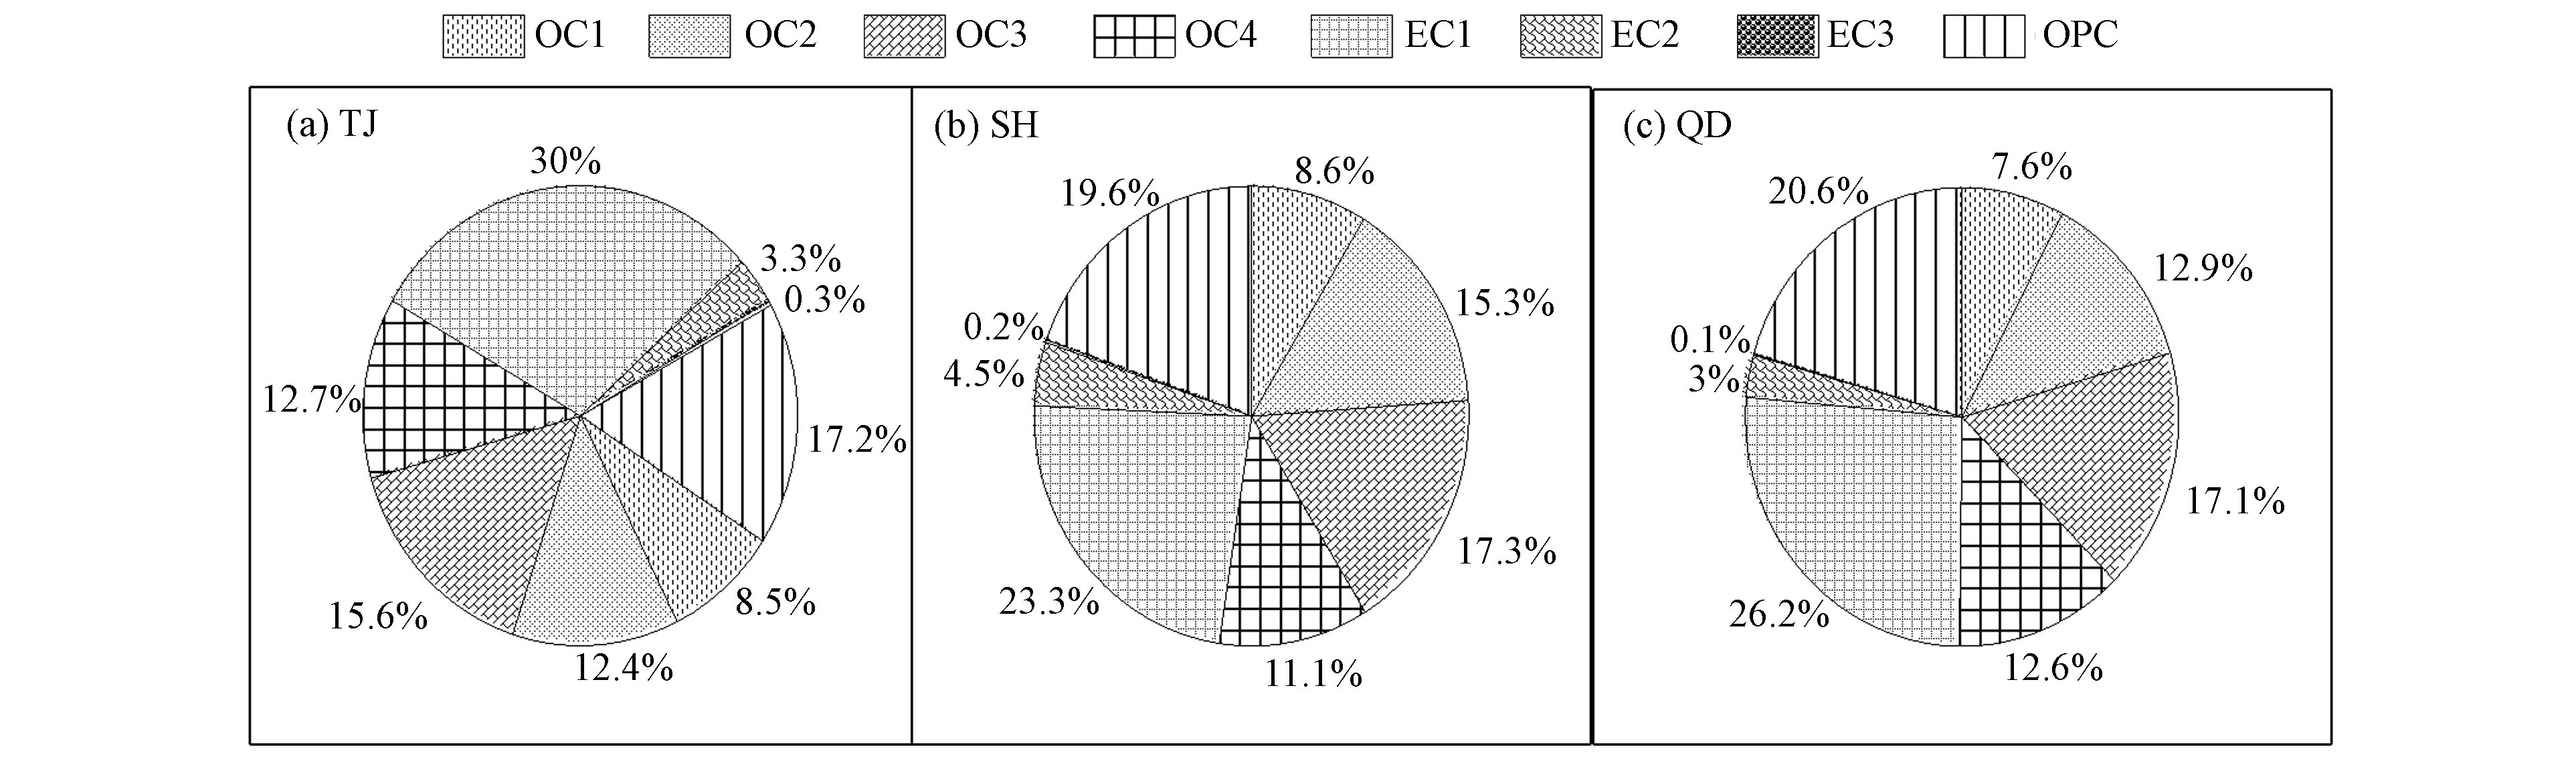
    • 用TOT法得到了8种碳组分(OC1、OC2、OC3、OC4、EC1、EC2、EC3、OPC),这8种碳组分的丰度可以表现其一定的源谱特征。

      图4可见,中国3个典型沿海城市的碳组分组成表现为:天津:EC1> OPC > OC3> OC4> OC2 > OC1> EC2> EC3,上海和青岛均为:EC1> OPC> OC3> OC2> OC4 > OC1> EC2> EC3;3个站点EC3的平均浓度均接近于0,在此不讨论。由此可见,3个城市EC1、OPC、OC3、OC4及OC2所占比重最多,这几种成分占比总和分别为天津(87.6%)、上海(86.7%)和青岛(89.2%)。研究表明, OPC是大气中水溶性极性化合物的主要成分[51],OC2主要来源为燃煤[52],OC3、OC4和EC1主要来源为道路扬尘[53]和汽车尾气的排放[54],EC2、EC3主要来源为柴油车尾气的排放[55]。所以可以初步判定3个沿海城市冬季PM2.5中碳组分主要受机动车尾气、生物质燃烧、燃煤和道路尘排放的影响。

      为进一步了解PM2.5中各碳组分的潜在来源,应用数理统计软件(SPSS 20.0)对3个采样点PM2.5样品中8种碳组分含量进行主成分分析(PCA),提取特征值大于1,累积方差贡献率大于85%的因子,并采用正交旋转使不同组分的因子载荷差异化便于因子识别,分析结果见表3

      表3可见,天津PM2.5中碳组分主要受3个因子的影响,因子1中OC1、OC3和OC4的载荷值较高,方差贡献率37.0%,主要代表生物质燃烧和道路扬尘的影响;因子2中EC1和OPC的载荷值较高,方差贡献率25.9%,主要代表汽油车尾气的影响;因子3中EC2的载荷值较高,方差贡献率24.9%,主要代表柴油车尾气的影响,以上因子解释方差合计87.7%。综上,天津PM2.5中碳组分主要来源于道路尘、生物质燃烧和机动车尾气。上海PM2.5中碳组分主要受2个因子的影响,其中因子1中OC1、OC3、OC4、EC1和OPC的载荷值较高,方差贡献率62.3%,表明上海受生物质燃烧、道路扬尘和汽油车尾气的影响;因子2中EC3的载荷值较高,主要代表了柴油车尾气的影响,解释方差合计91.5%。综上,上海PM2.5的碳组分主要来源于生物质燃烧、道路扬尘和机动车尾气。青岛PM2.5中碳组分主要受2个因子的影响,因子1中OC3、OC4、EC1和OPC的载荷值很高,方差贡献率57.4%,主要代表了道路尘和机动车尾气的影响;因子2中EC2、EC3的载荷值较高,方差贡献率32.1%,主要代表了柴油车尾气的影响,解释方差合计89.2%。综上,青岛PM2.5中碳组分主要来源于道路扬尘和柴油车尾气。

    • 为了研究外来输送对本次采样点位的影响,基于Meteoinfo的TrajStat[55]软件对天津、上海和青岛3个城市的气团进行聚类分析(轨迹数据来源于ftp://arlftp.arlhq.noaa.gov/pub/archives/reanalysis,轨迹起始高度为500 m,后推时间为48 h,采用当地时间00 : 00的数据)。依模型的算法按气团传输方向和距离进行轨迹的聚类,并将每日PM2.5、OC和EC的质量浓度数据按每天的轨迹主要所属类型统计平均,分析不同气团影响下PM2.5中碳组分可能的传播路径和来源(见图5表4)。本次采样期间,天津和上海的气团来源主要有4类,青岛的气团来源主要有3类。

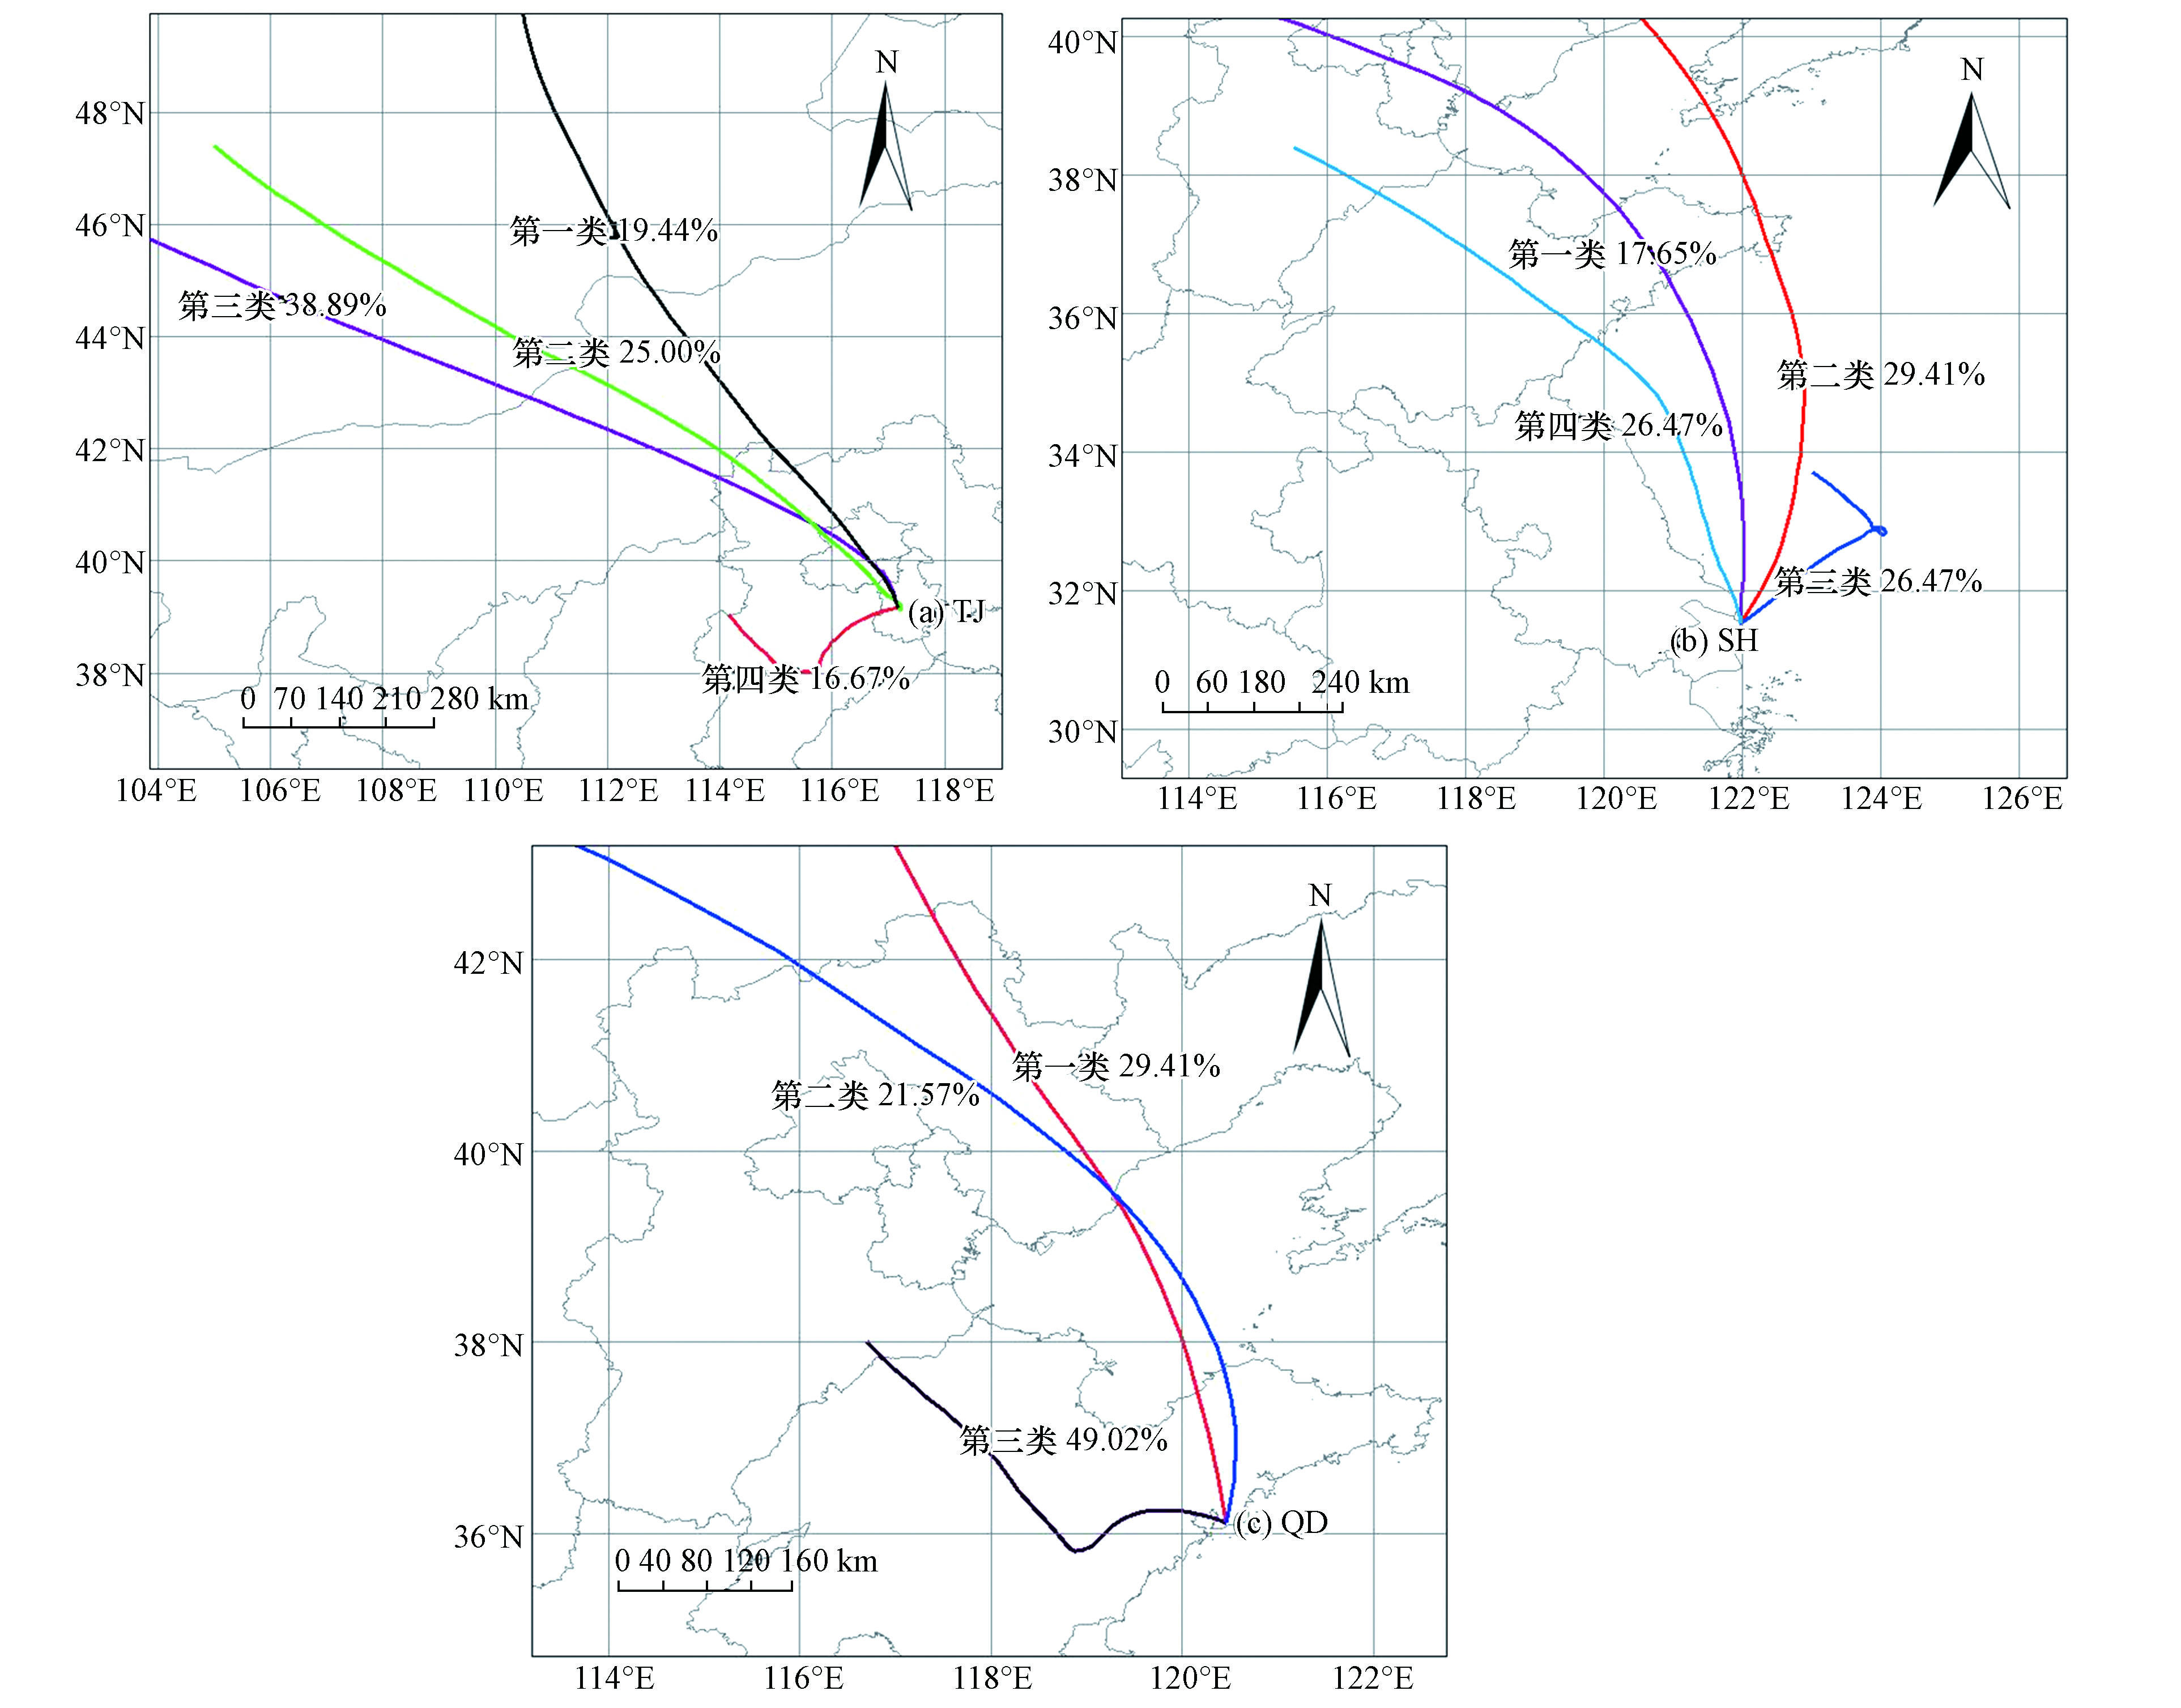
      从气团传输路径上看,天津受第1类、第2类和第3类远距离传输的气团影响更大,这3个气团在总轨迹线中的占比最大,高达83.3%;在这3个气团控制下碳组分和PM2.5的质量浓度均较大,OC、EC和PM2.5的平均质量浓度分别为20.74、5.25、132.80 μg·m−3,这三类气团起源于俄罗斯,途径内蒙古中部、河北省中部和北京南部后到达天津采样点;第四类气团起源于河北省中部通过区域传输到达天津采样点,占比为16.7%,该气团控制下碳组分浓度和PM2.5浓度均最小,表明远距离传输气团携带较多的人为污染物,致使浓度值升高对天津的影响大于本地污染物的排放。对上海而言,第1类、第2类和第4类气团均属于远距离传输,轨迹覆盖区域临近,占比达73.6%,均是污染物随着冷空气南下传输所致,其中碳组分浓度(OC、EC)和PM2.5浓度均值分别为7.22、1.07、33.83 μg·m−3,第3类气团自黄海,属于海洋气团,占比为26.5%,对应的PM2.5质量浓度略低于第1、4类轨迹,虽然来自海面上的气团含有的污染物及其前体物浓度低,但是有时也会出现来自北方气溶胶经过海面传输回到大陆并影响上海的情况,使得上海站点的污染物浓度较高。对青岛而言,其中第1类和第2类气团属于远距离传输,占比达51.0%,第3类气团属于区域传输,主要受山东省内陆城市的影响,而起源于蒙古共和国东部途径山东省沧州、烟台市到达青岛市采样点,在此气团控制下PM2.5和OC、EC质量浓度均最大,分别为101.49,20.67、2.55 μg·m−3,表明青岛站点主要受华北地区污染物和本地排放源的影响。

      应用本研究的结果与先前学者对同地区的研究结果对比可知,燃煤、生物质燃烧和机动车尾气对天津的碳组分贡献明显,上海周边城市对上海的PM2.5及其碳组分浓度贡献较大,青岛市区OC和EC具有很好的同源性[22,17-18]

    3.   结论(Conclusion)
    • (1)采样期间中国3个典型沿海城市PM2.5浓度的空间分布差异明显,天津、上海和青岛PM2.5的平均质量浓度为(116.96± 66.93)、(31.21 ± 25.62)、(74.93 ±54.60 )μg·m−3, PM2.5的日均浓度超标率分别为66.7%、6. 7%和34.0%,这表明中国典型城市整体大气污染较为严重。3个站点OC的质量浓度分别为(18.69±7.95)、(7.28±3.11)、(16.45±8.94) μg·m−3,EC的质量浓度分别为(4.98±2.08)、(1.05±1.25)、(2.01±1.04)μg·m−3,OC和EC的空间分布均为天津>青岛>上海。Char-EC与EC浓度变化趋势一致,而Soot-EC浓度日变化较小。天津、上海和青岛等3个城市总碳的占比分别为24.8%、22.1%和31.3%, 表明碳组分是PM2.5的重要组成部分。

      (2)相关性分析表明,3个采样点冬季PM2.5中OC和EC二者相关性均较强,说明OC和EC的来源一致。中国典型沿海城市3个站点OC/EC比值范围在2.37—7.53,5.47—46.41和4.77—13.36之间,可初步证明各采样点均存在SOC;采用最小R2法对各站点的SOC进行估算,天津、上海和青岛的3个采样点SOC的平均质量浓度为(5.09±4.68)、(3.90 ±1.65)、(4.21 ±4.31) μg·m−3,分别占OC总量的27.2%、55.8%和19.5%。天津和青岛的SOC在OC中的占比较小,表明这两个城市的碳组分主要来自污染源的直接排放,而上海的SOC在OC中的占比最大,高达56.2%,表明本地区的二次污染严重。

      (3)PCA分析结果表明,天津PM2.5中碳组分主要来源于道路尘、生物质燃烧和机动车尾气,上海PM2.5中碳组分主要来源于生物质燃烧、道路扬尘和机动车尾气。青岛PM2.5中碳组分主要来源于道路扬尘和机动车尾气。

      (4)后向轨迹聚类结果表明,来自西北方向的远距离传输对天津的影响较大,PM2.5浓度和碳组分的浓度最大;而对上海而言,主要受北方气溶胶经过海面又传输回上海的气团的影响;青岛站点主要受华北地区污染物和本地排放源的影响。

    Figure (5)  Table (4) Reference (55)

Catalog

    /

    DownLoad:  Full-Size Img  PowerPoint